. 2022 Apr;604(7904):111-119.
doi: 10.1038/s41586-022-04541-3. Epub 2022 Mar 30.

Human distal lung maps and lineage hierarchies reveal a bipotent progenitor

Affiliations

Human distal lung maps and lineage hierarchies reveal a bipotent progenitor

Preetish Kadur Lakshminarasimha Murthy et al. Nature. 2022 Apr.

Abstract

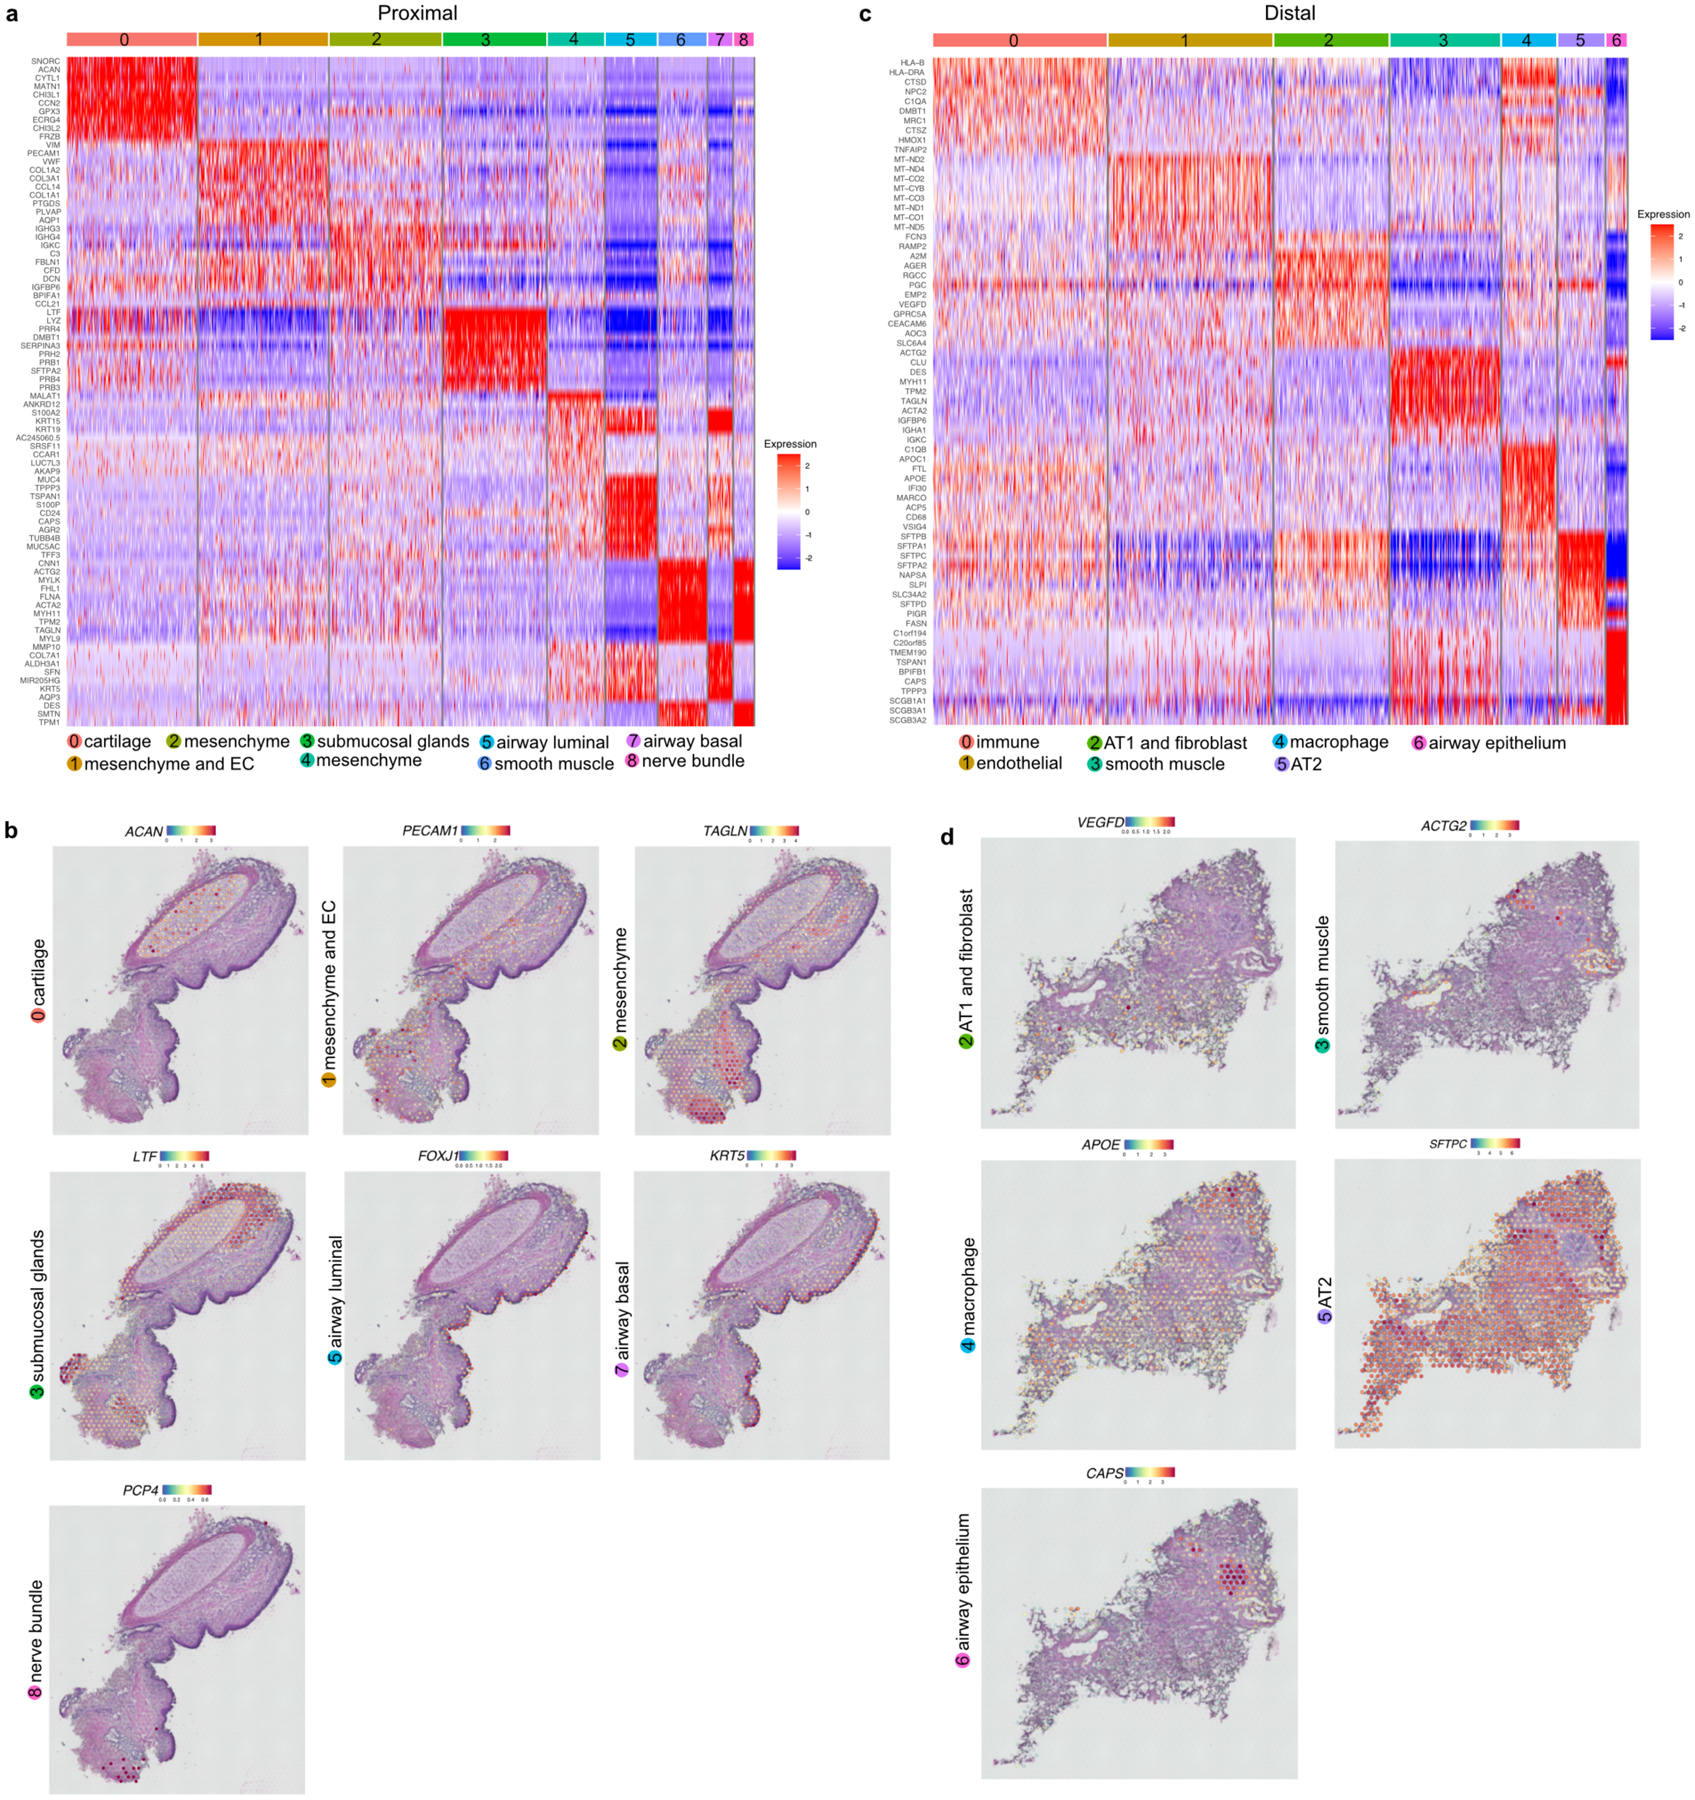
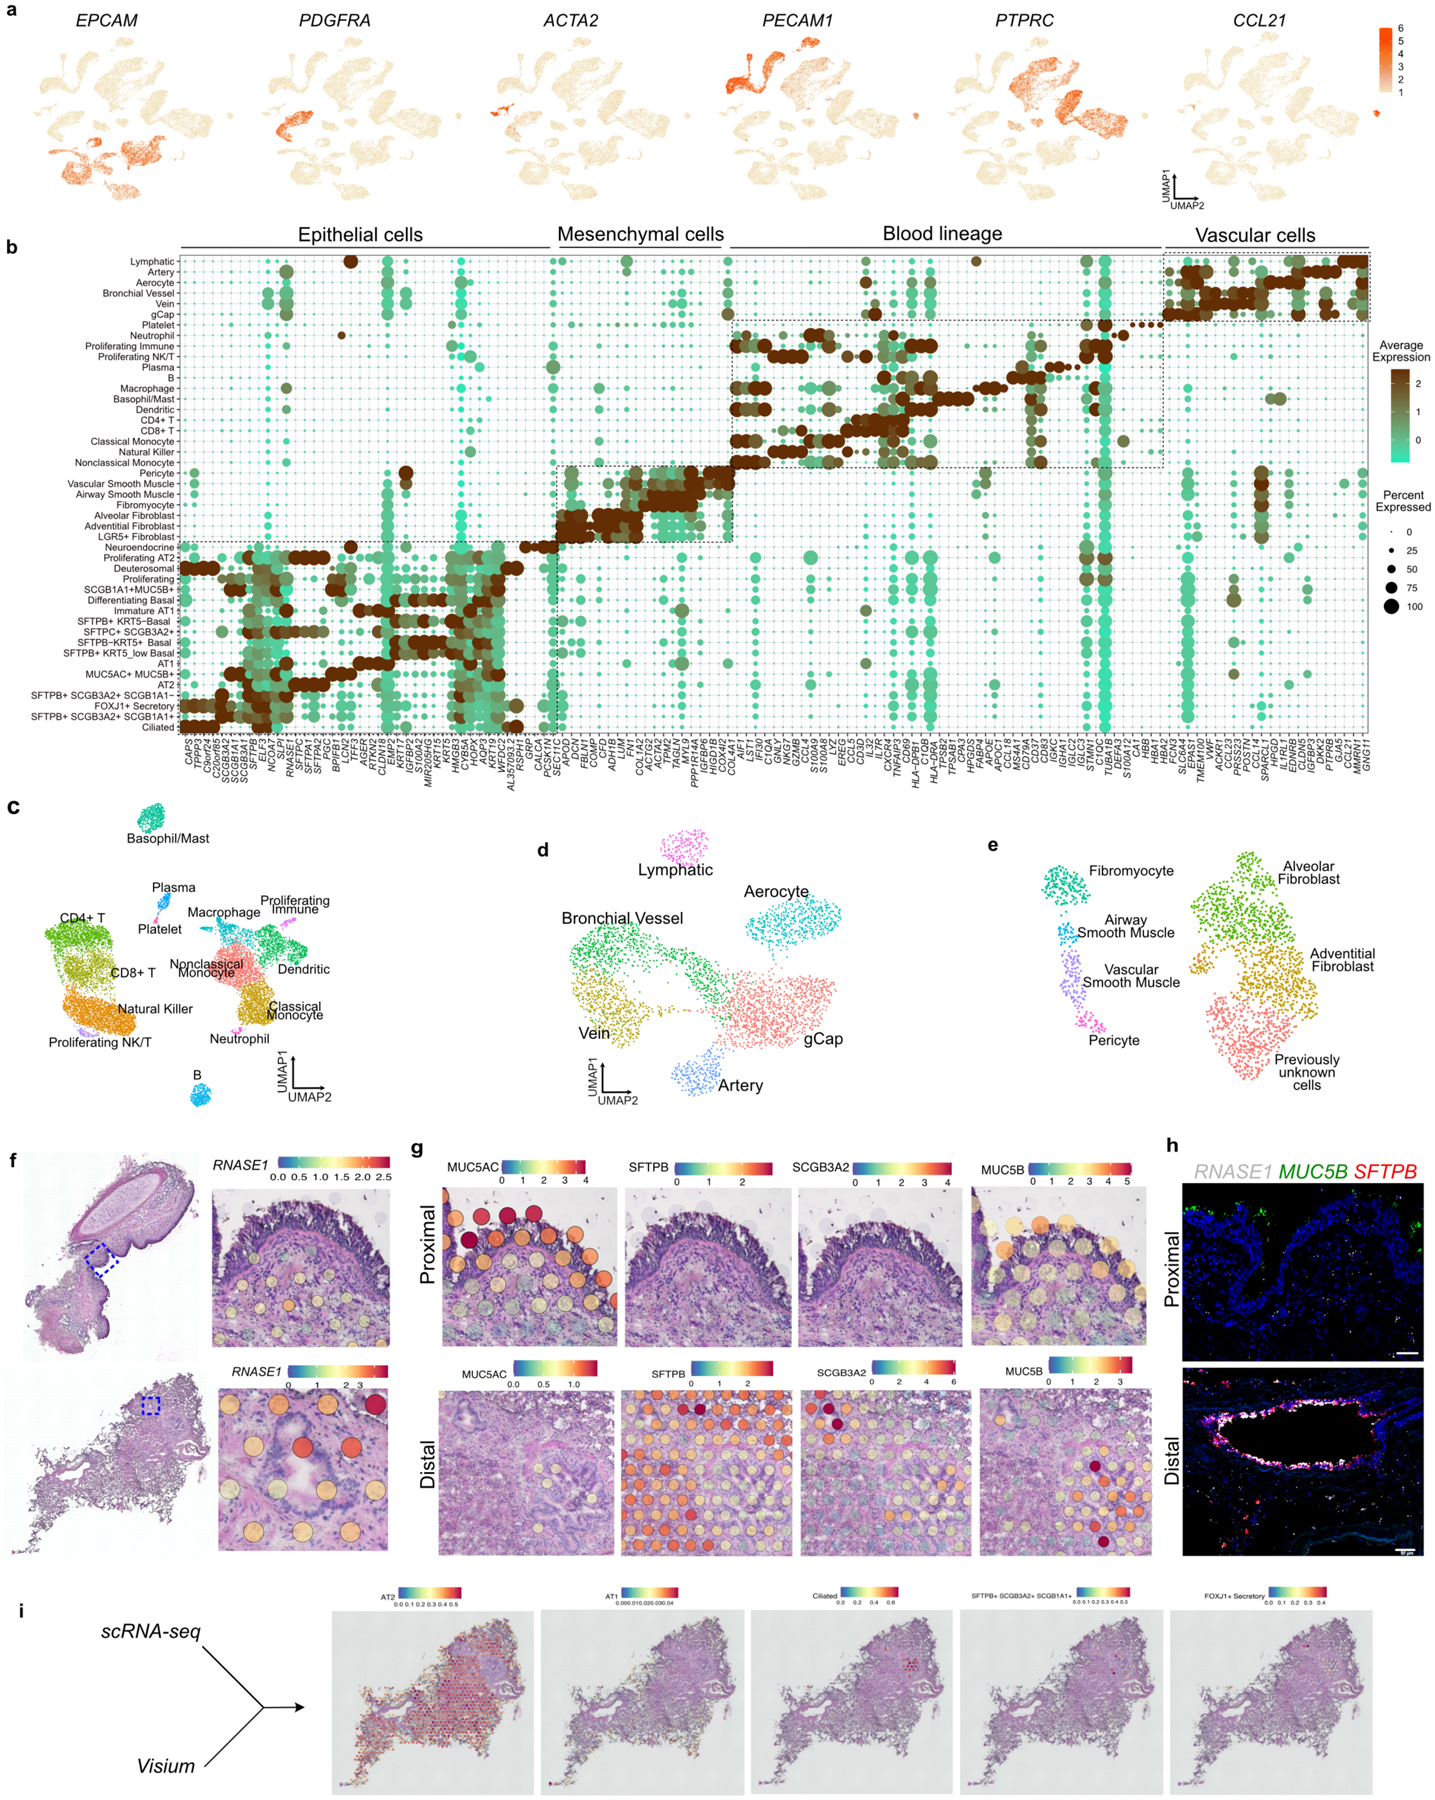
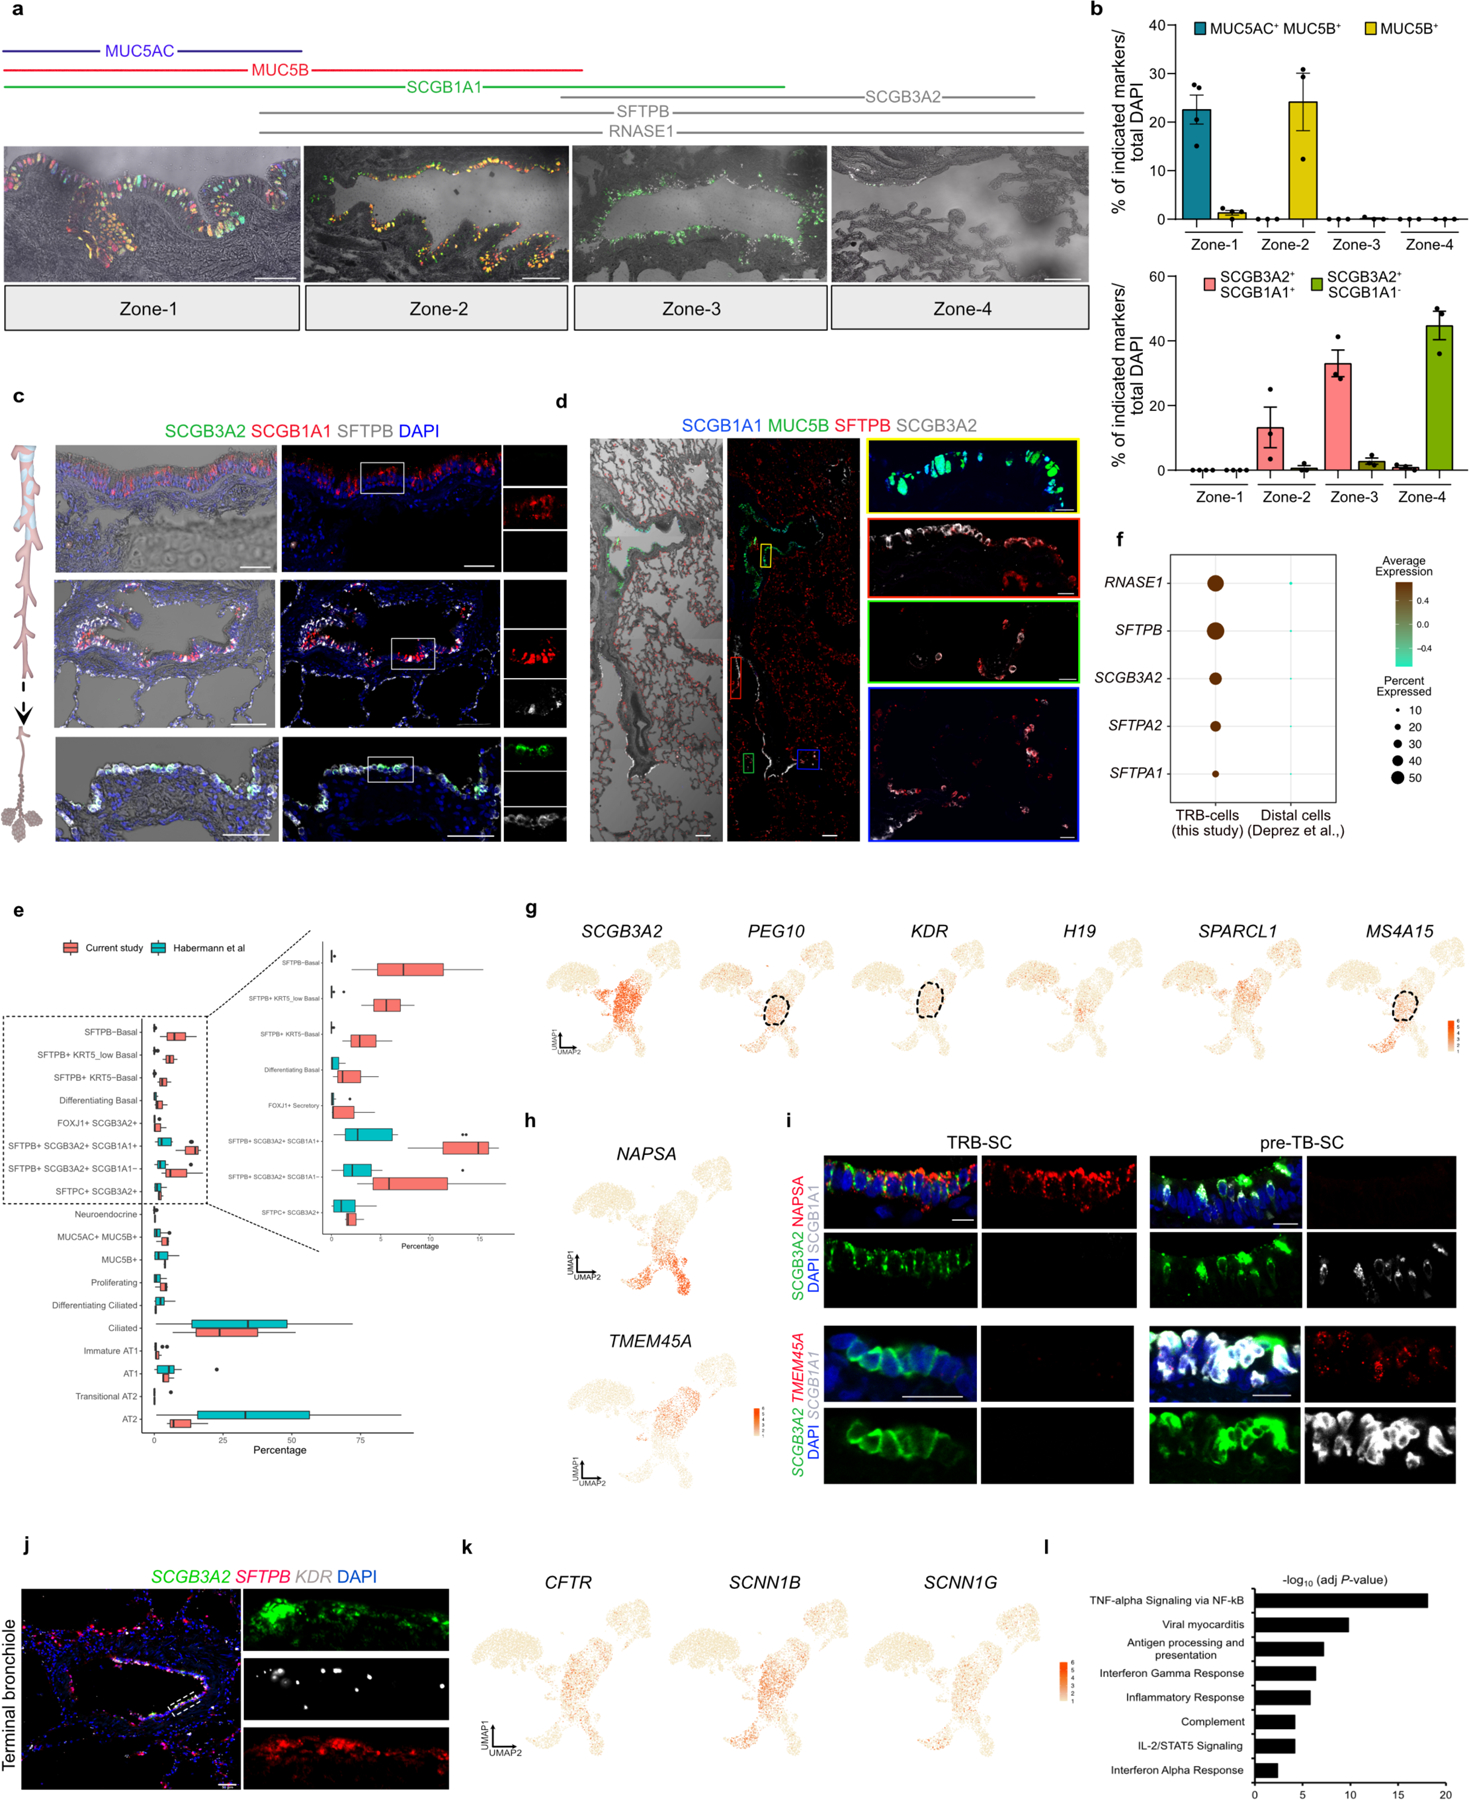
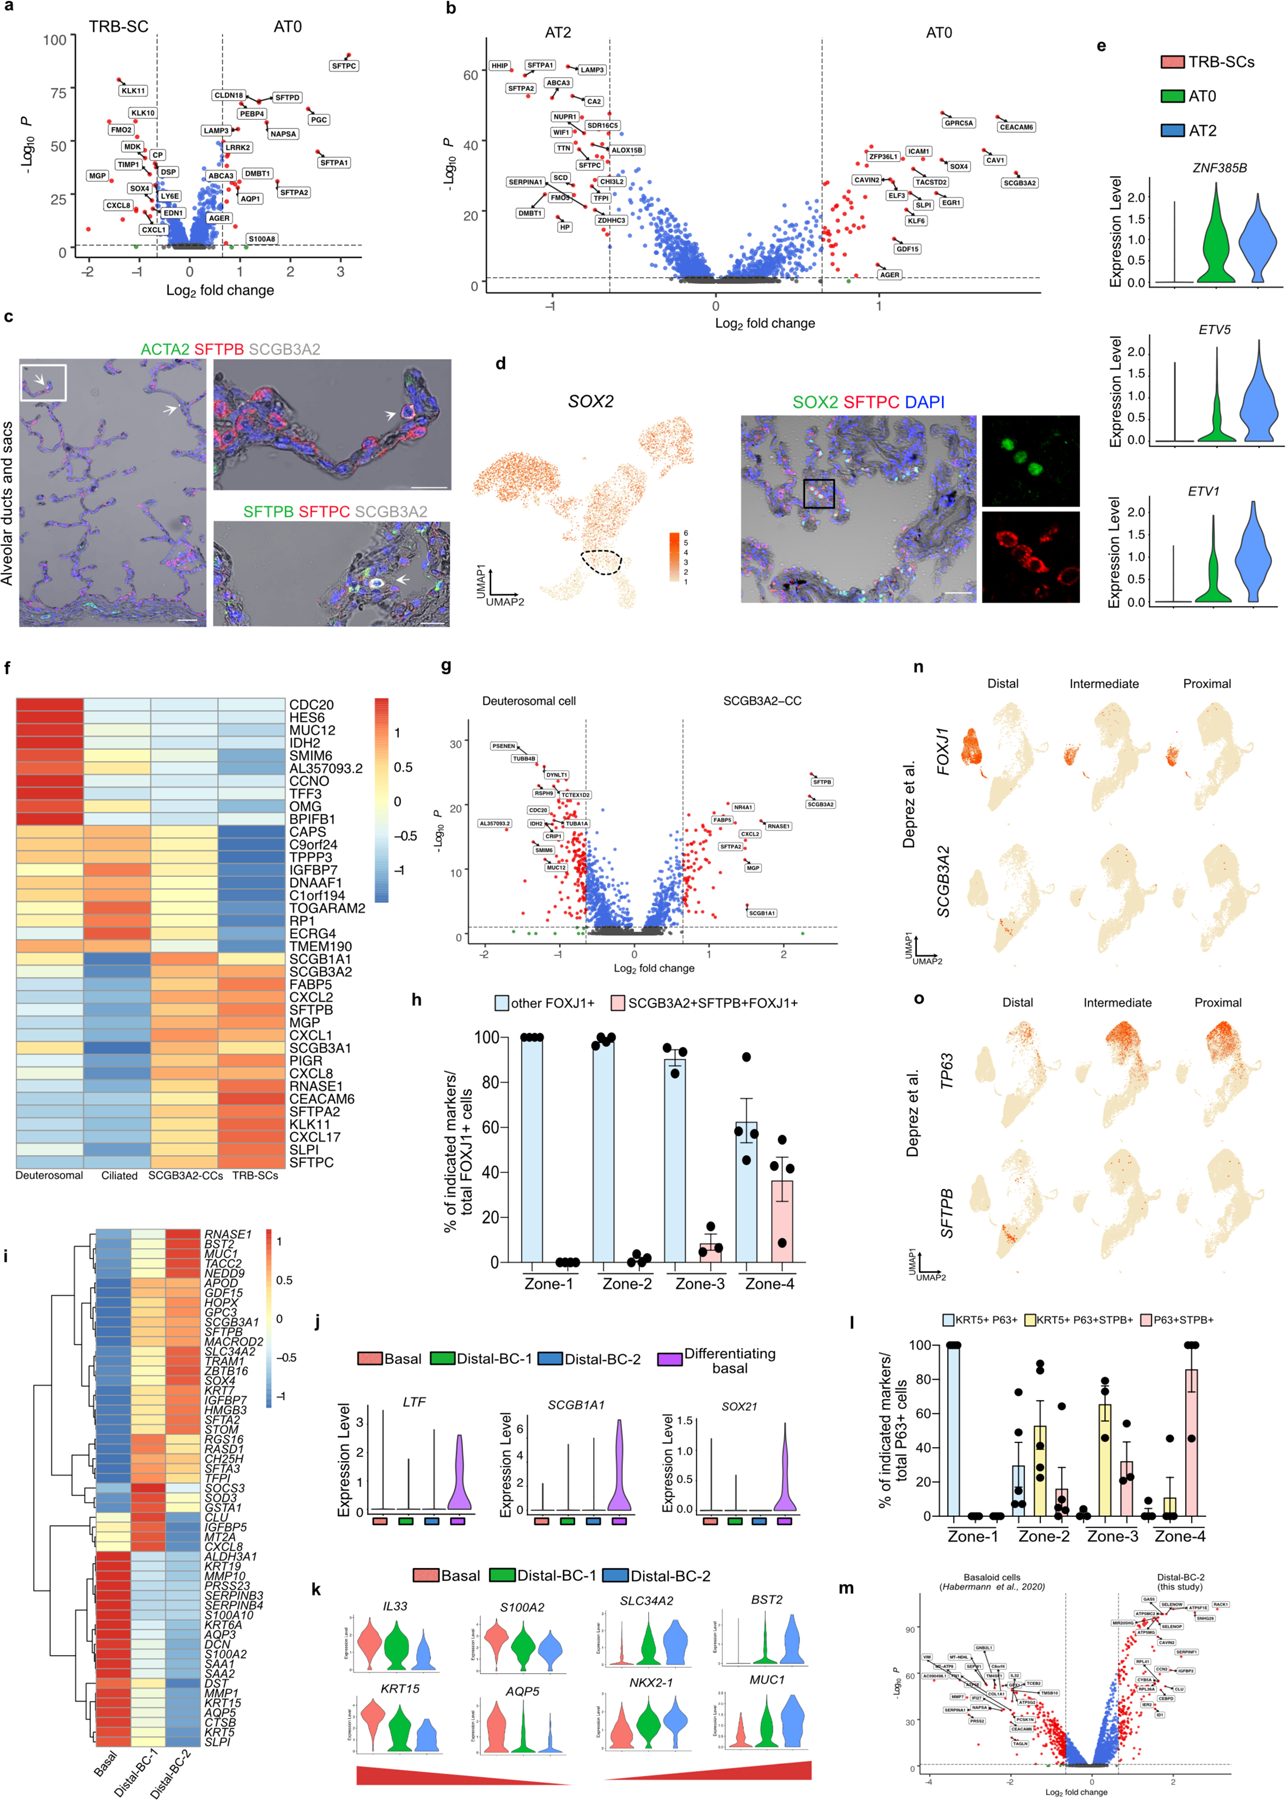
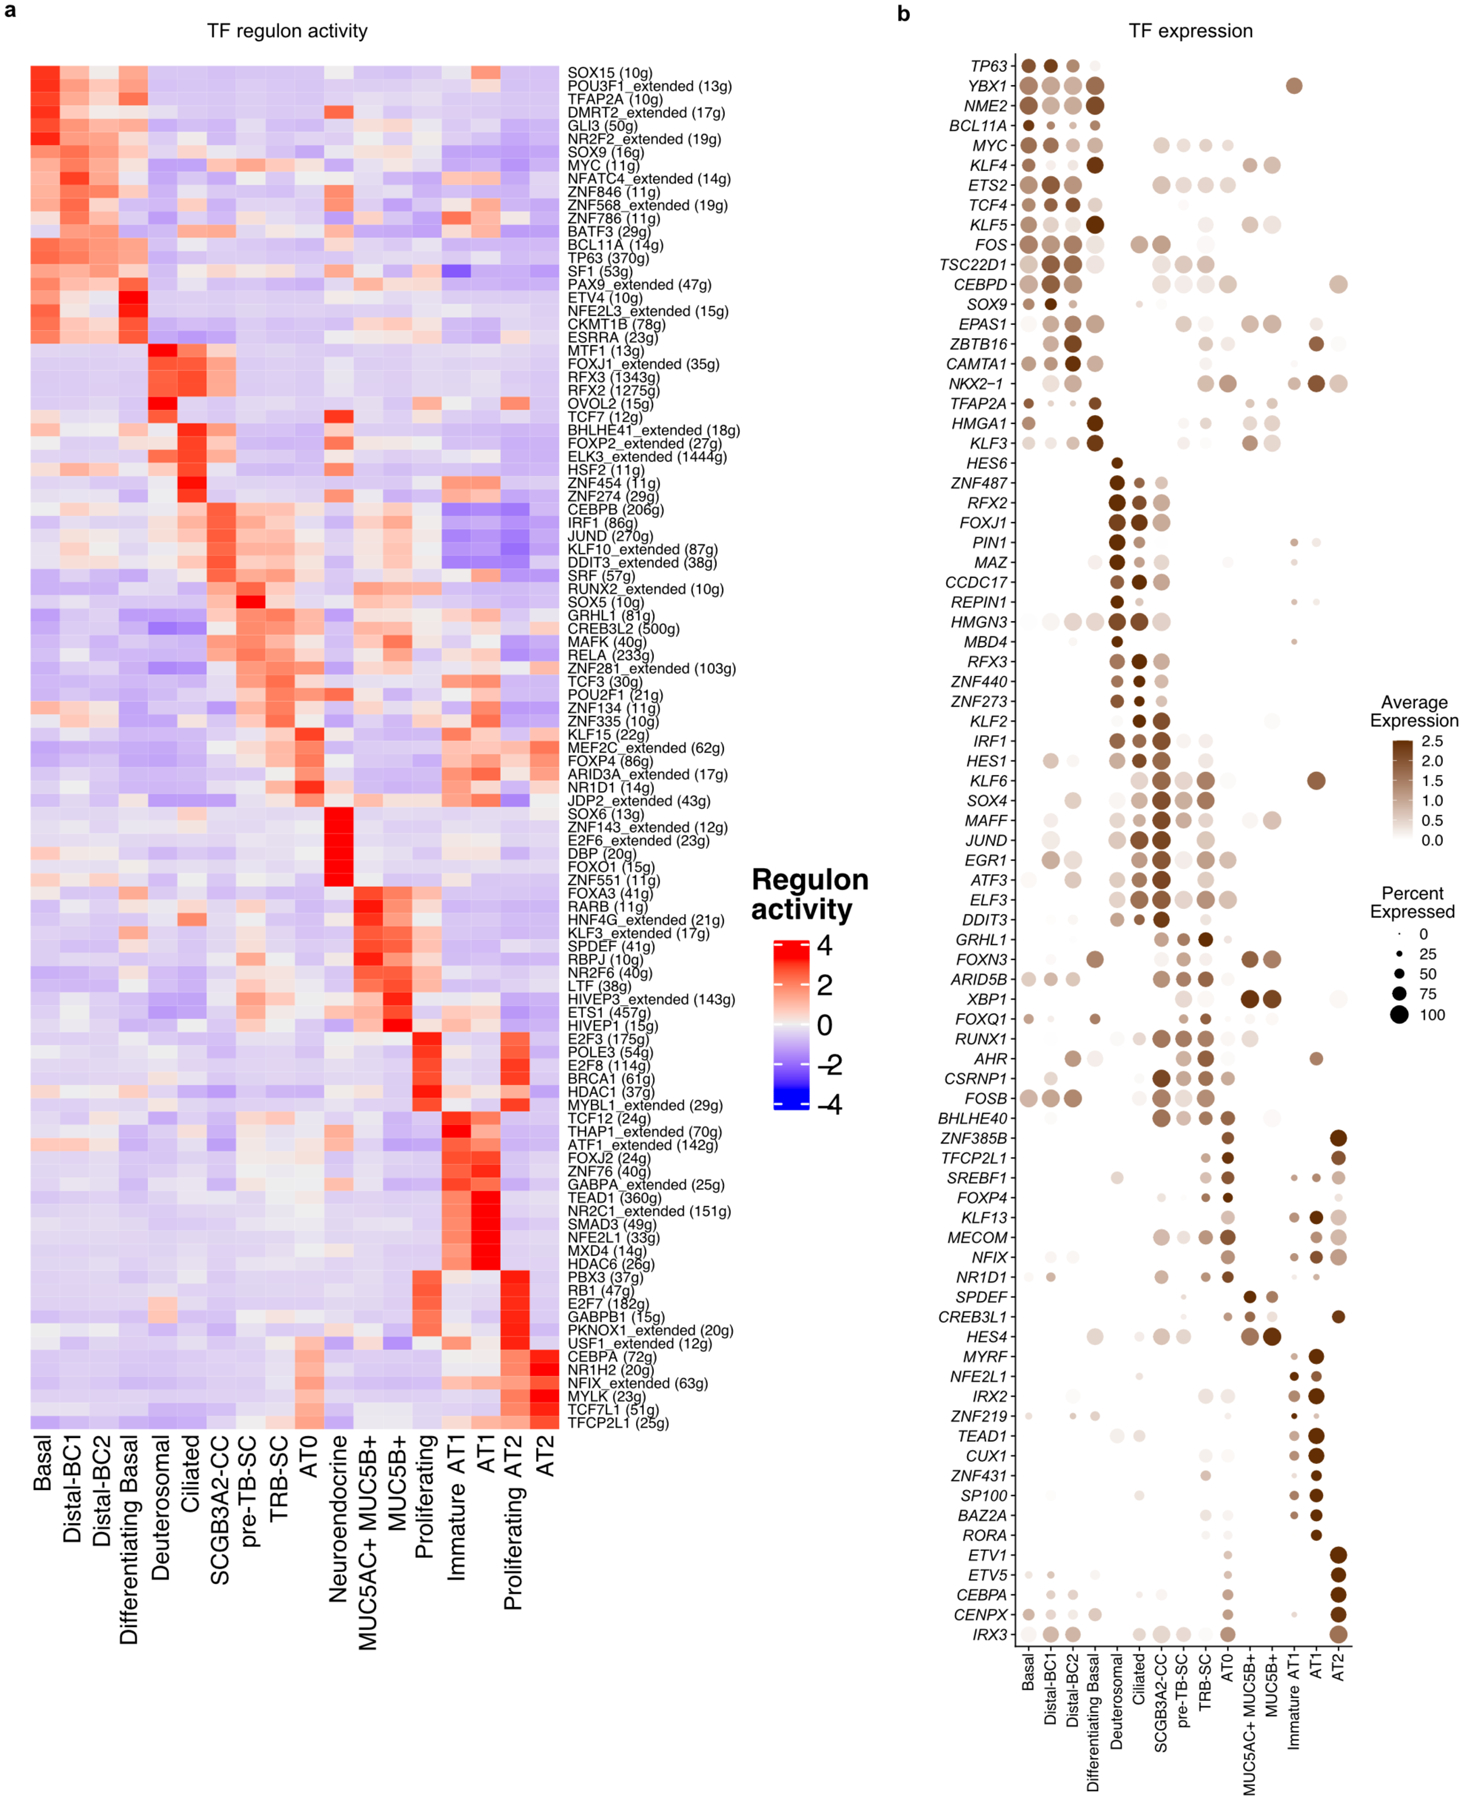
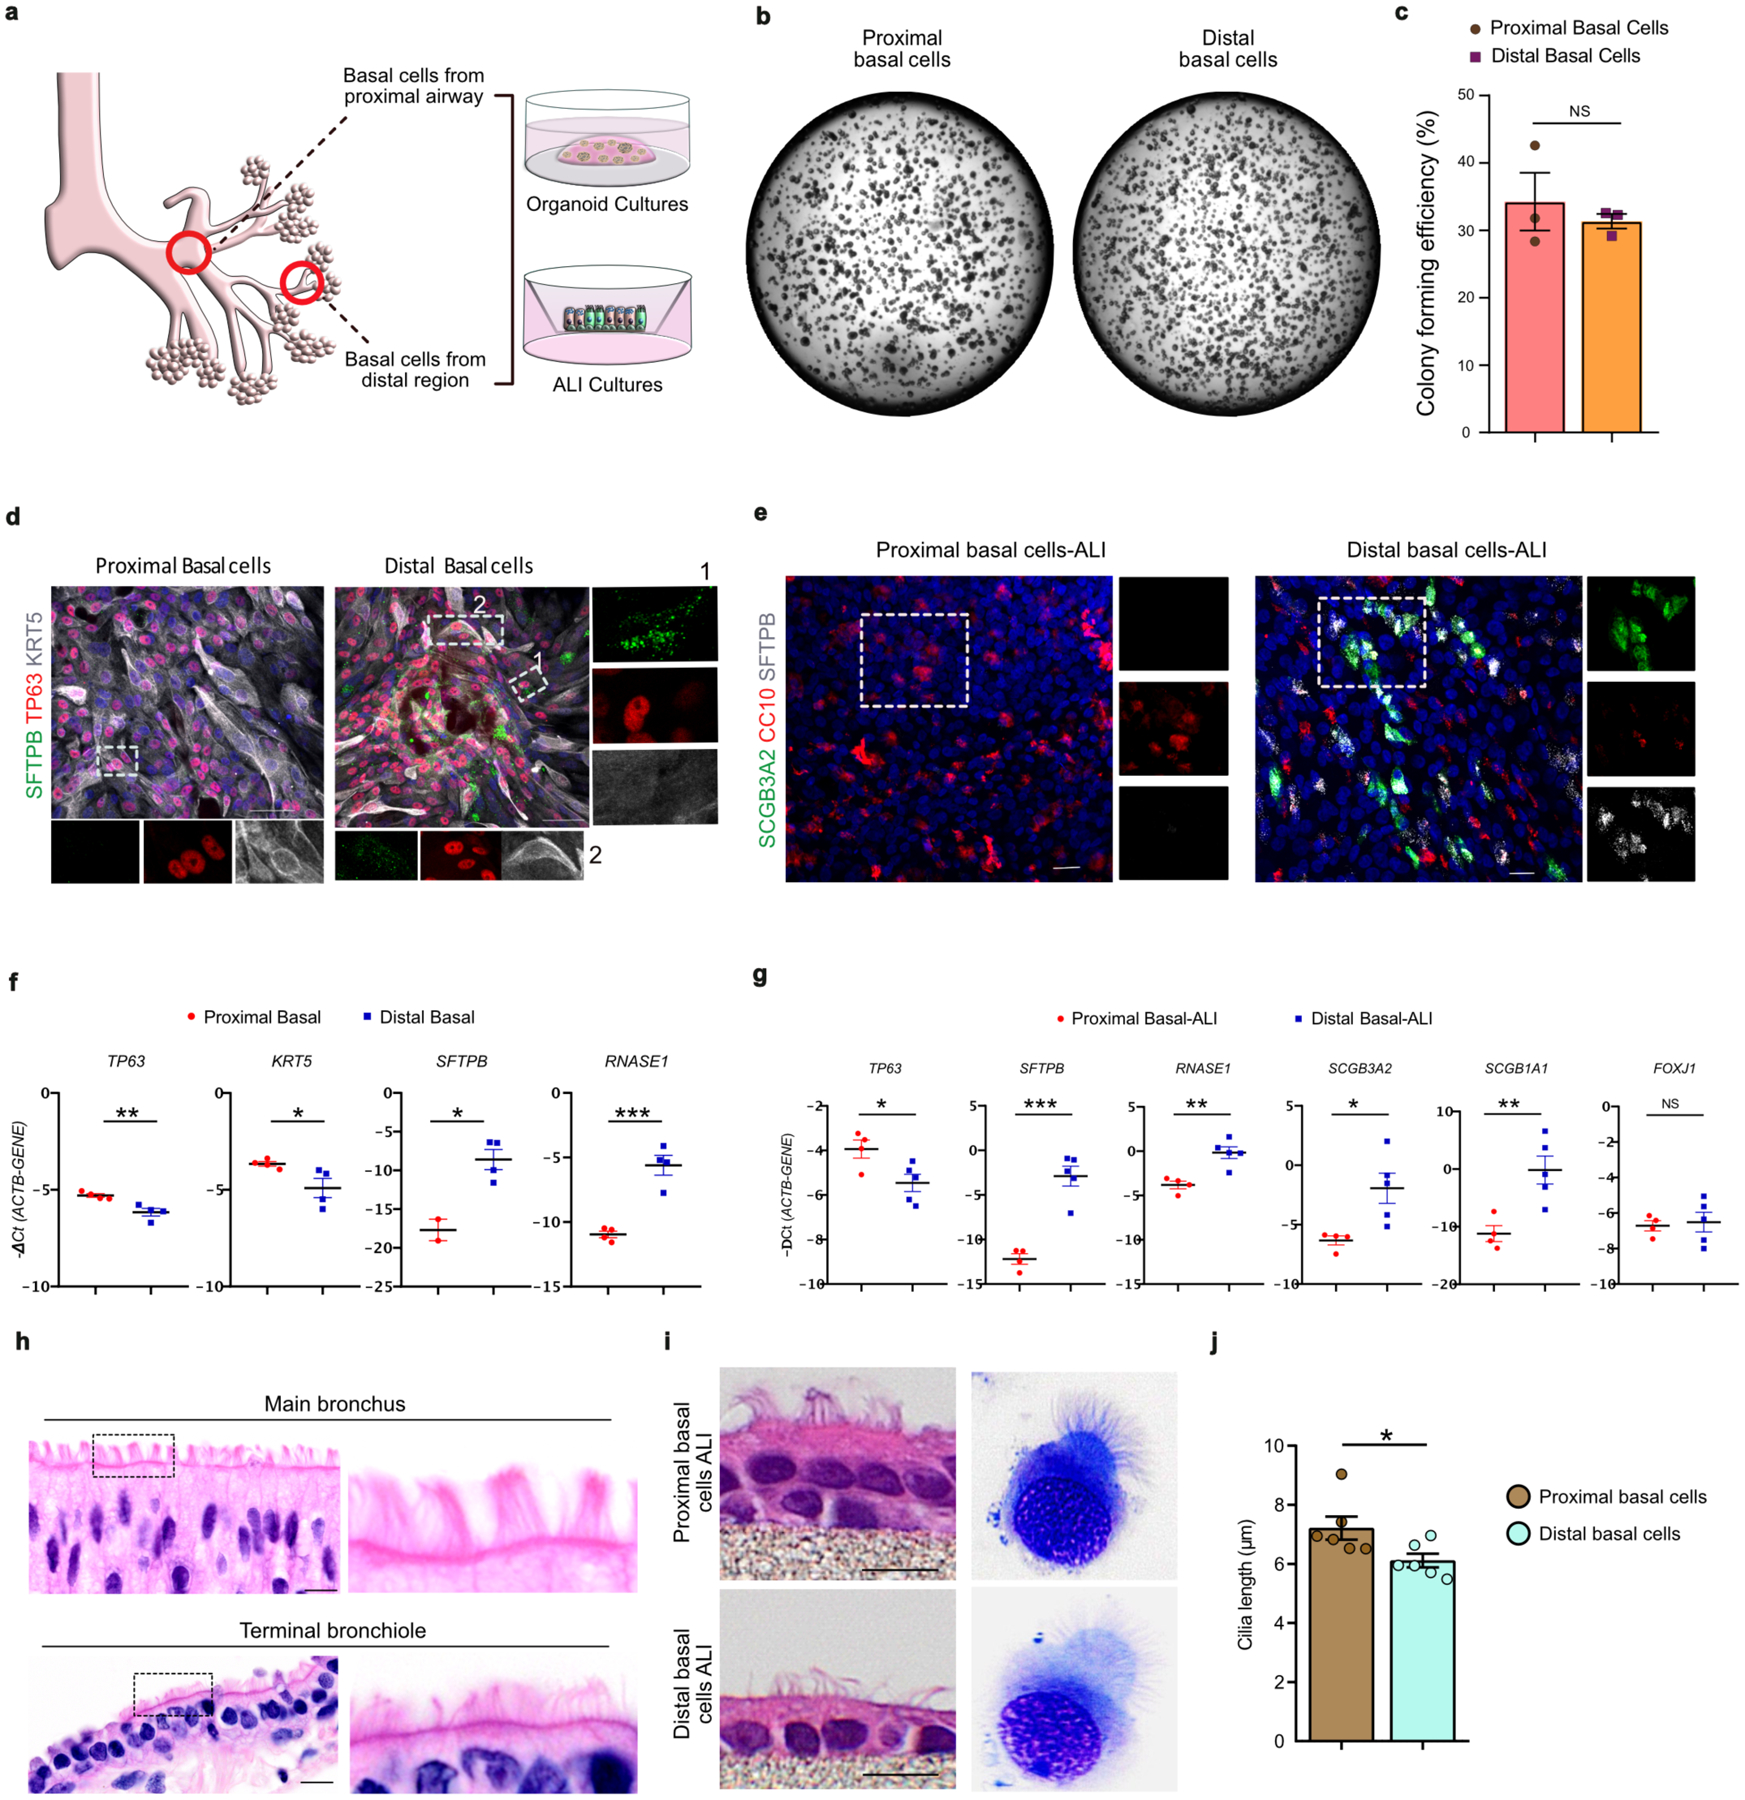
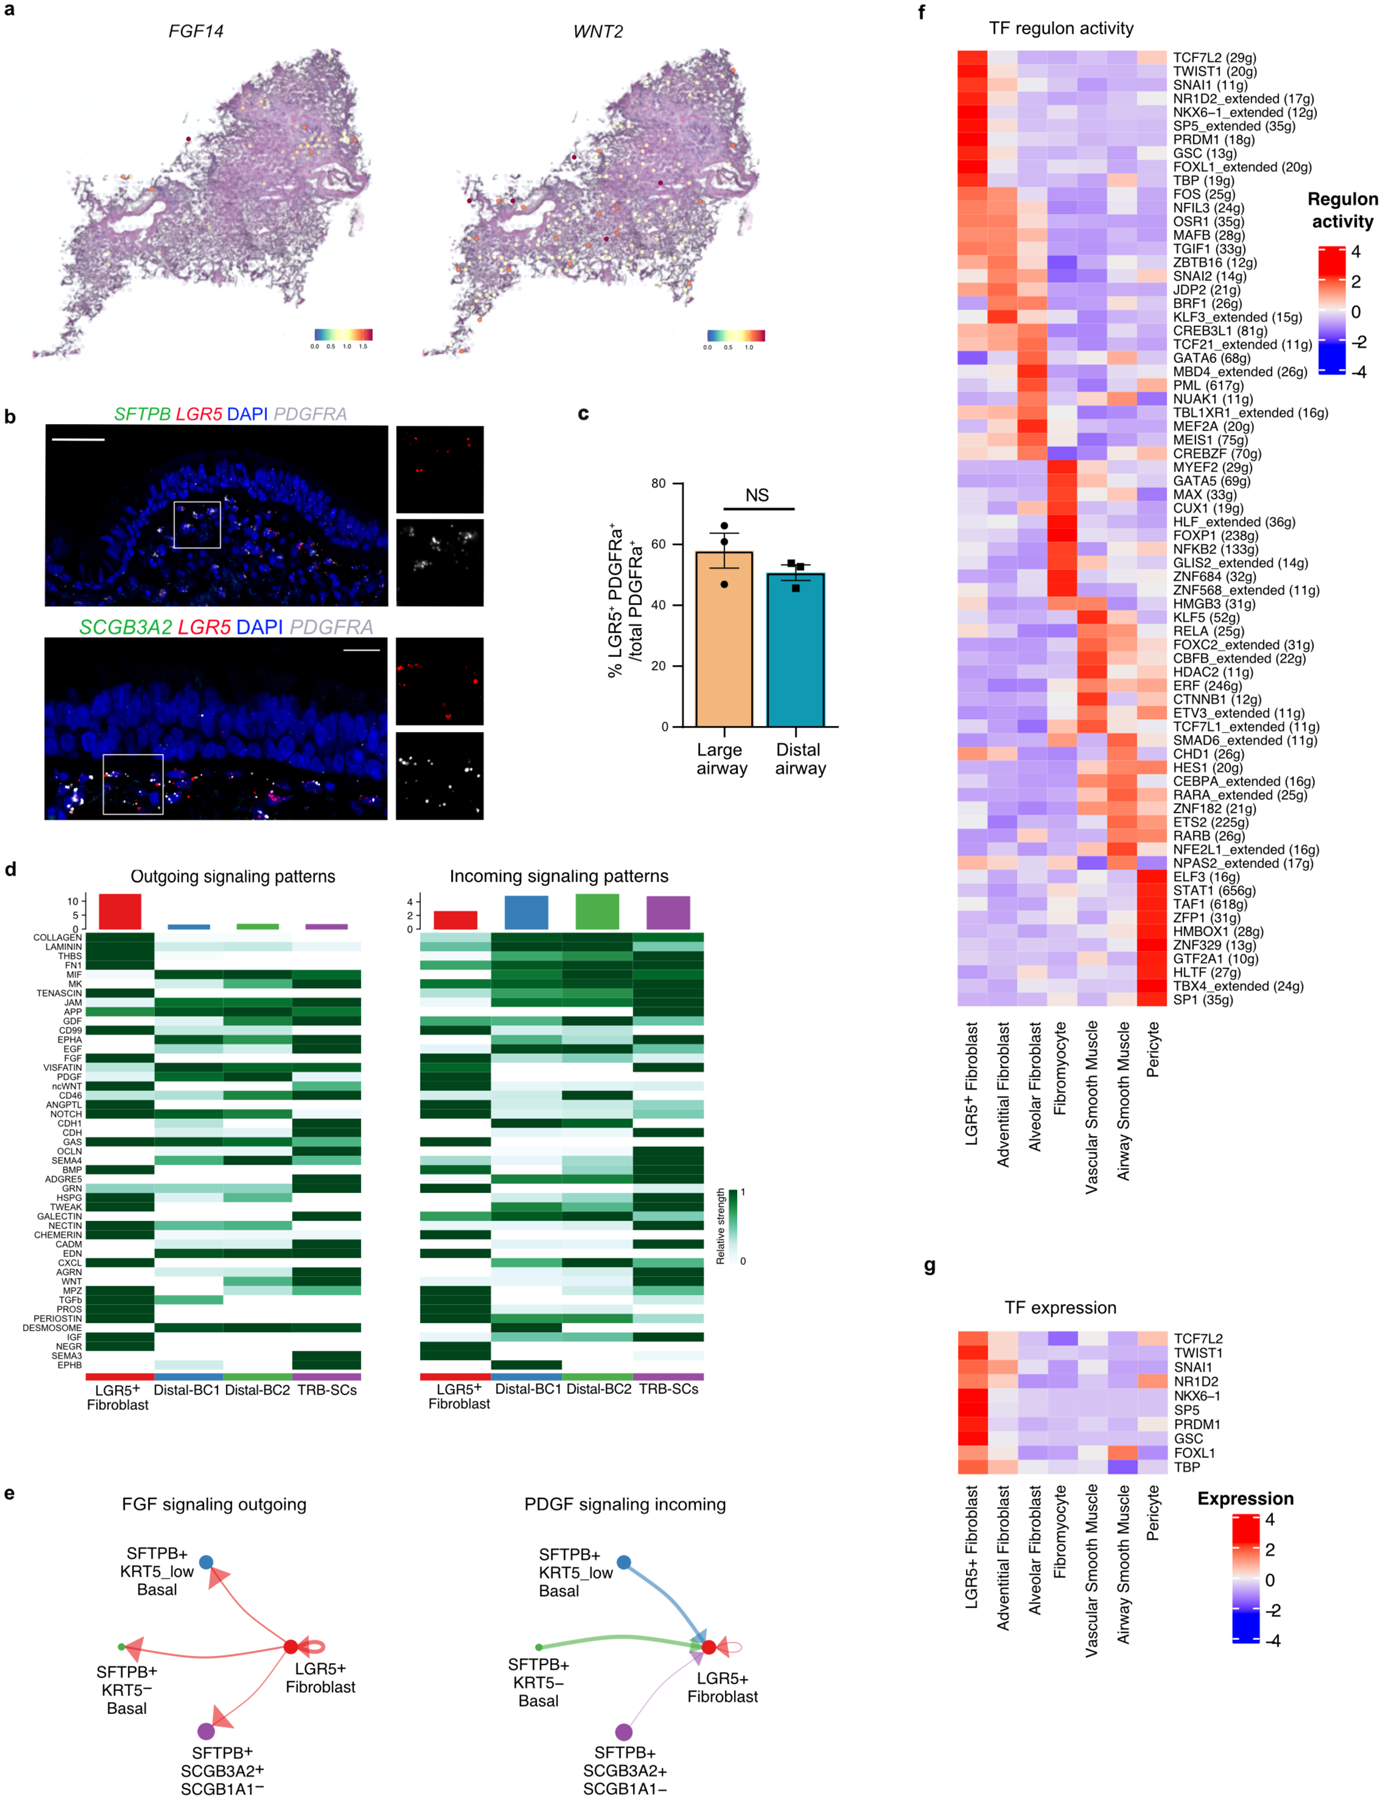
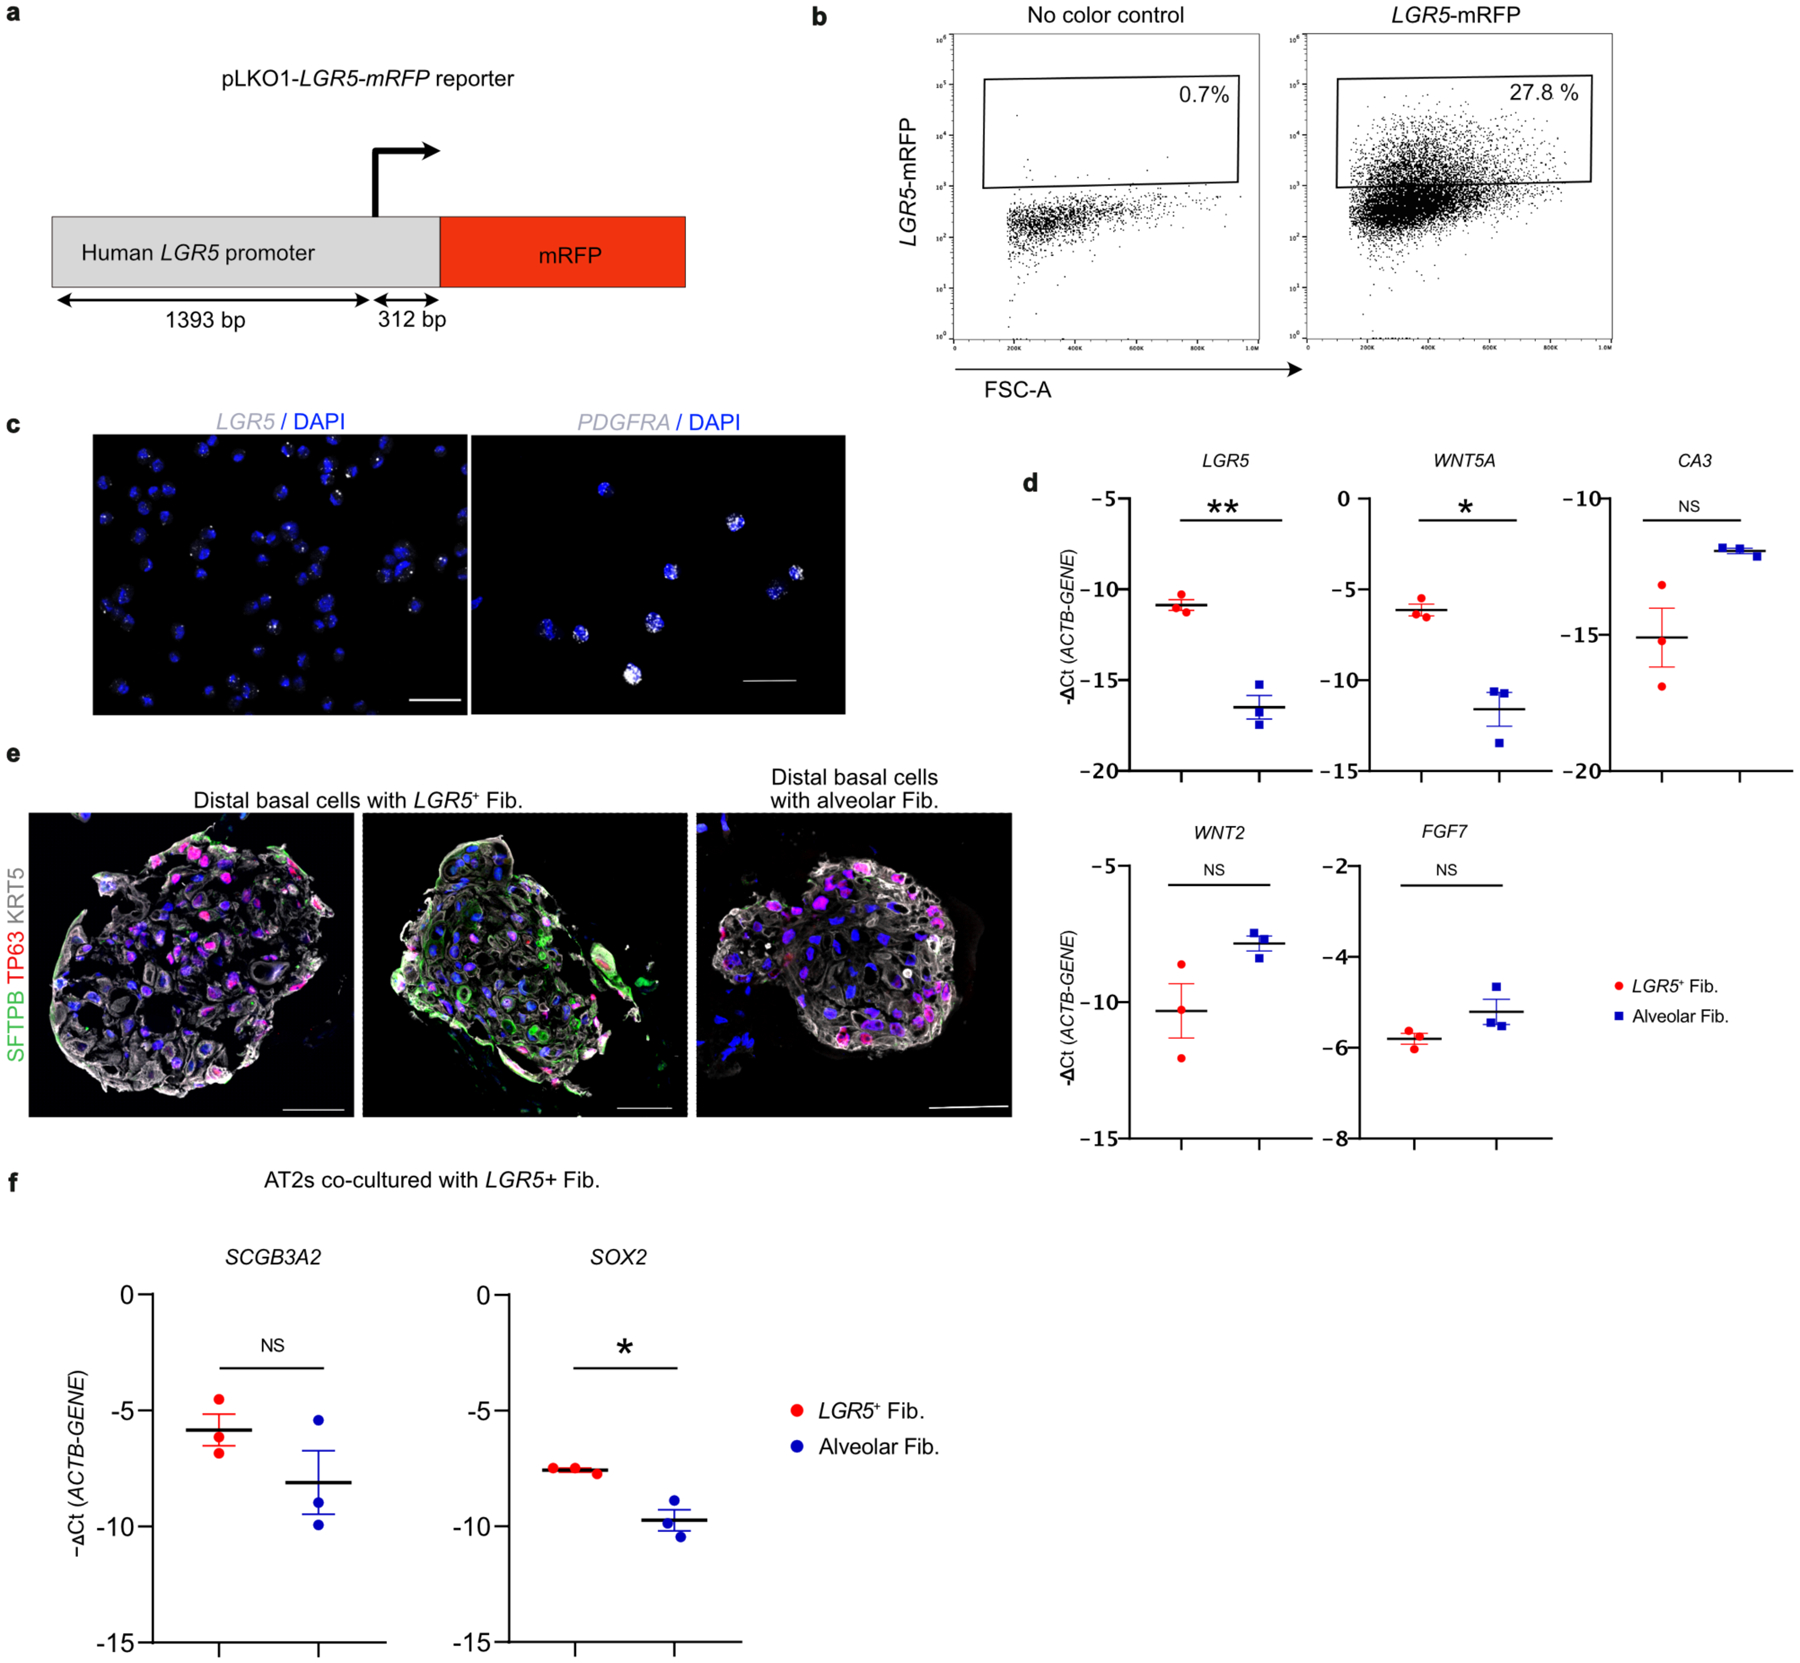
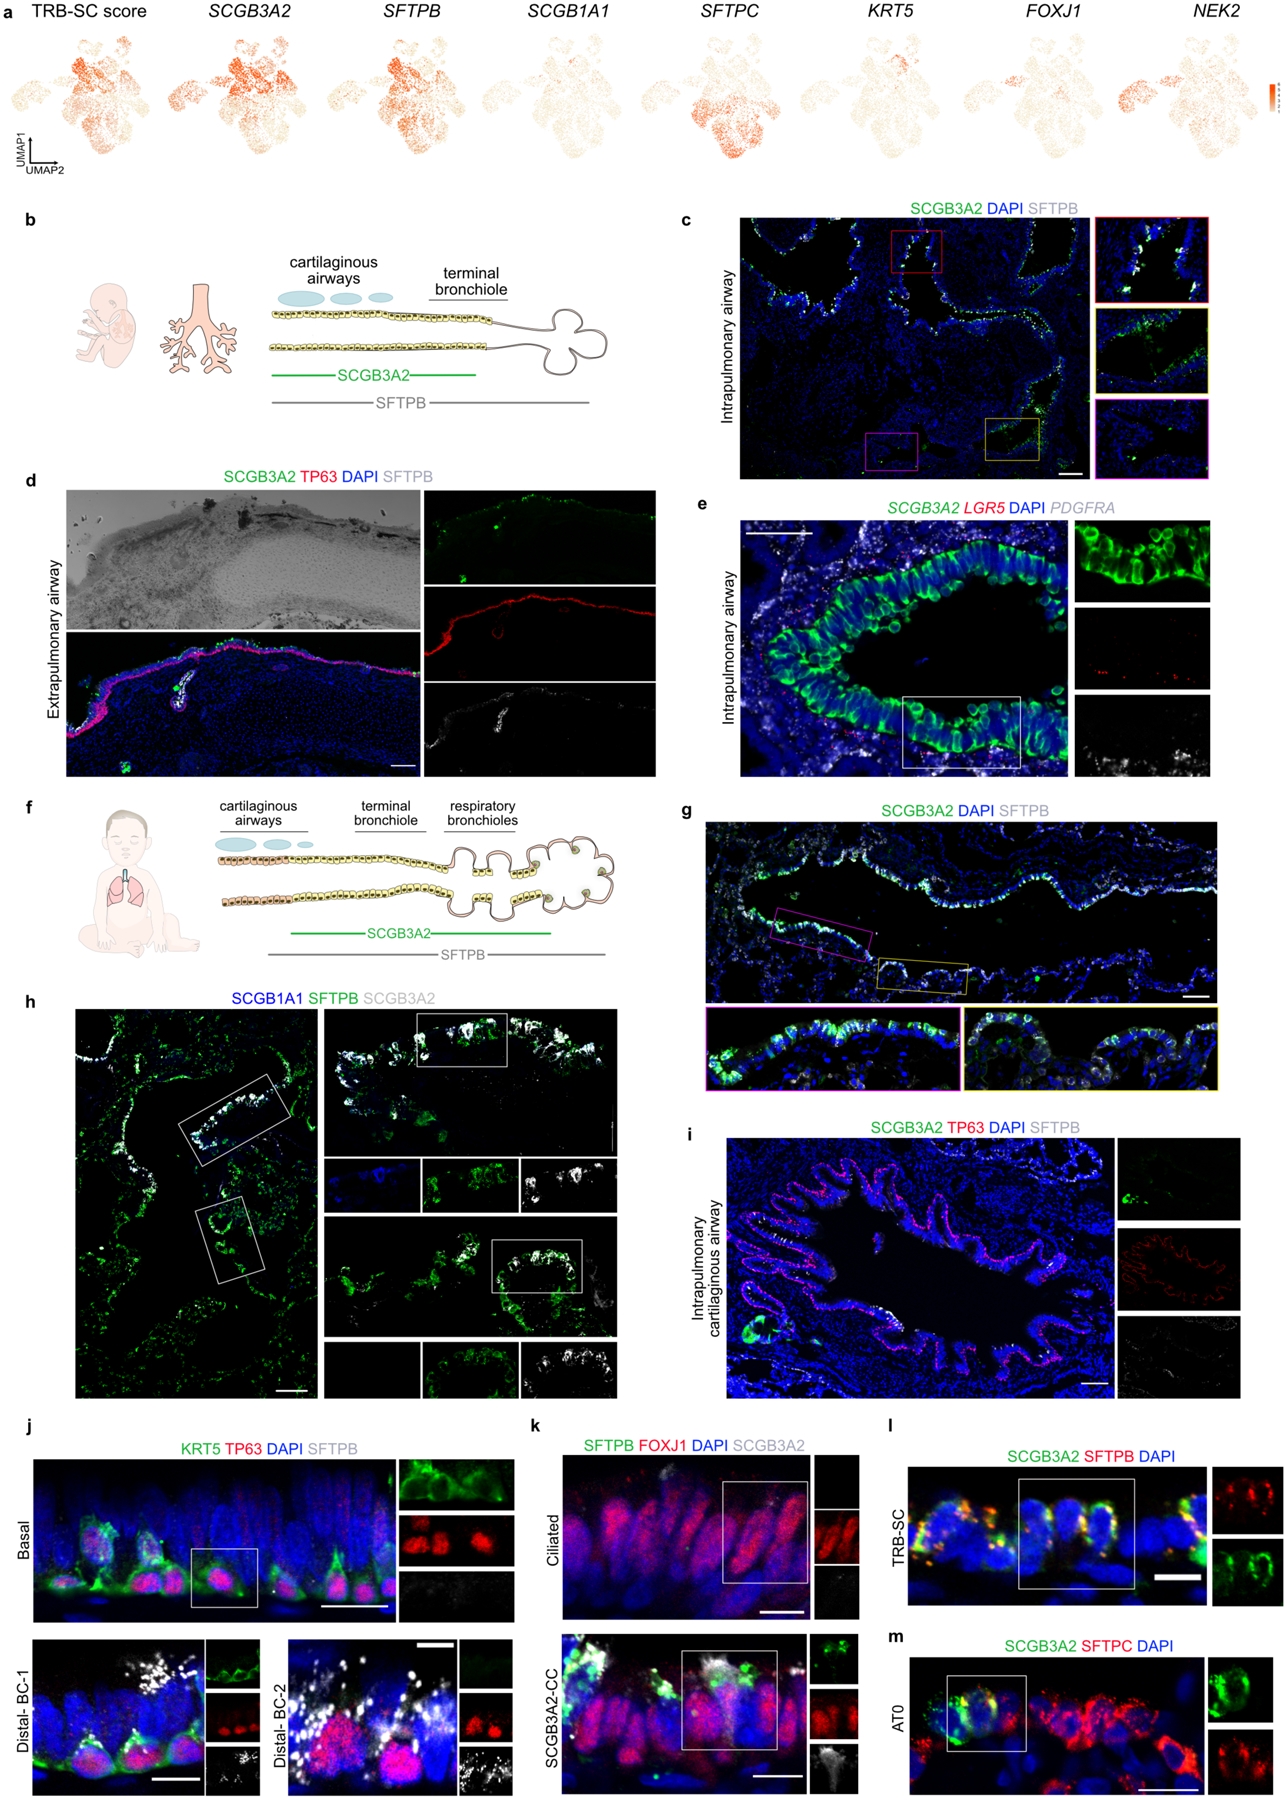
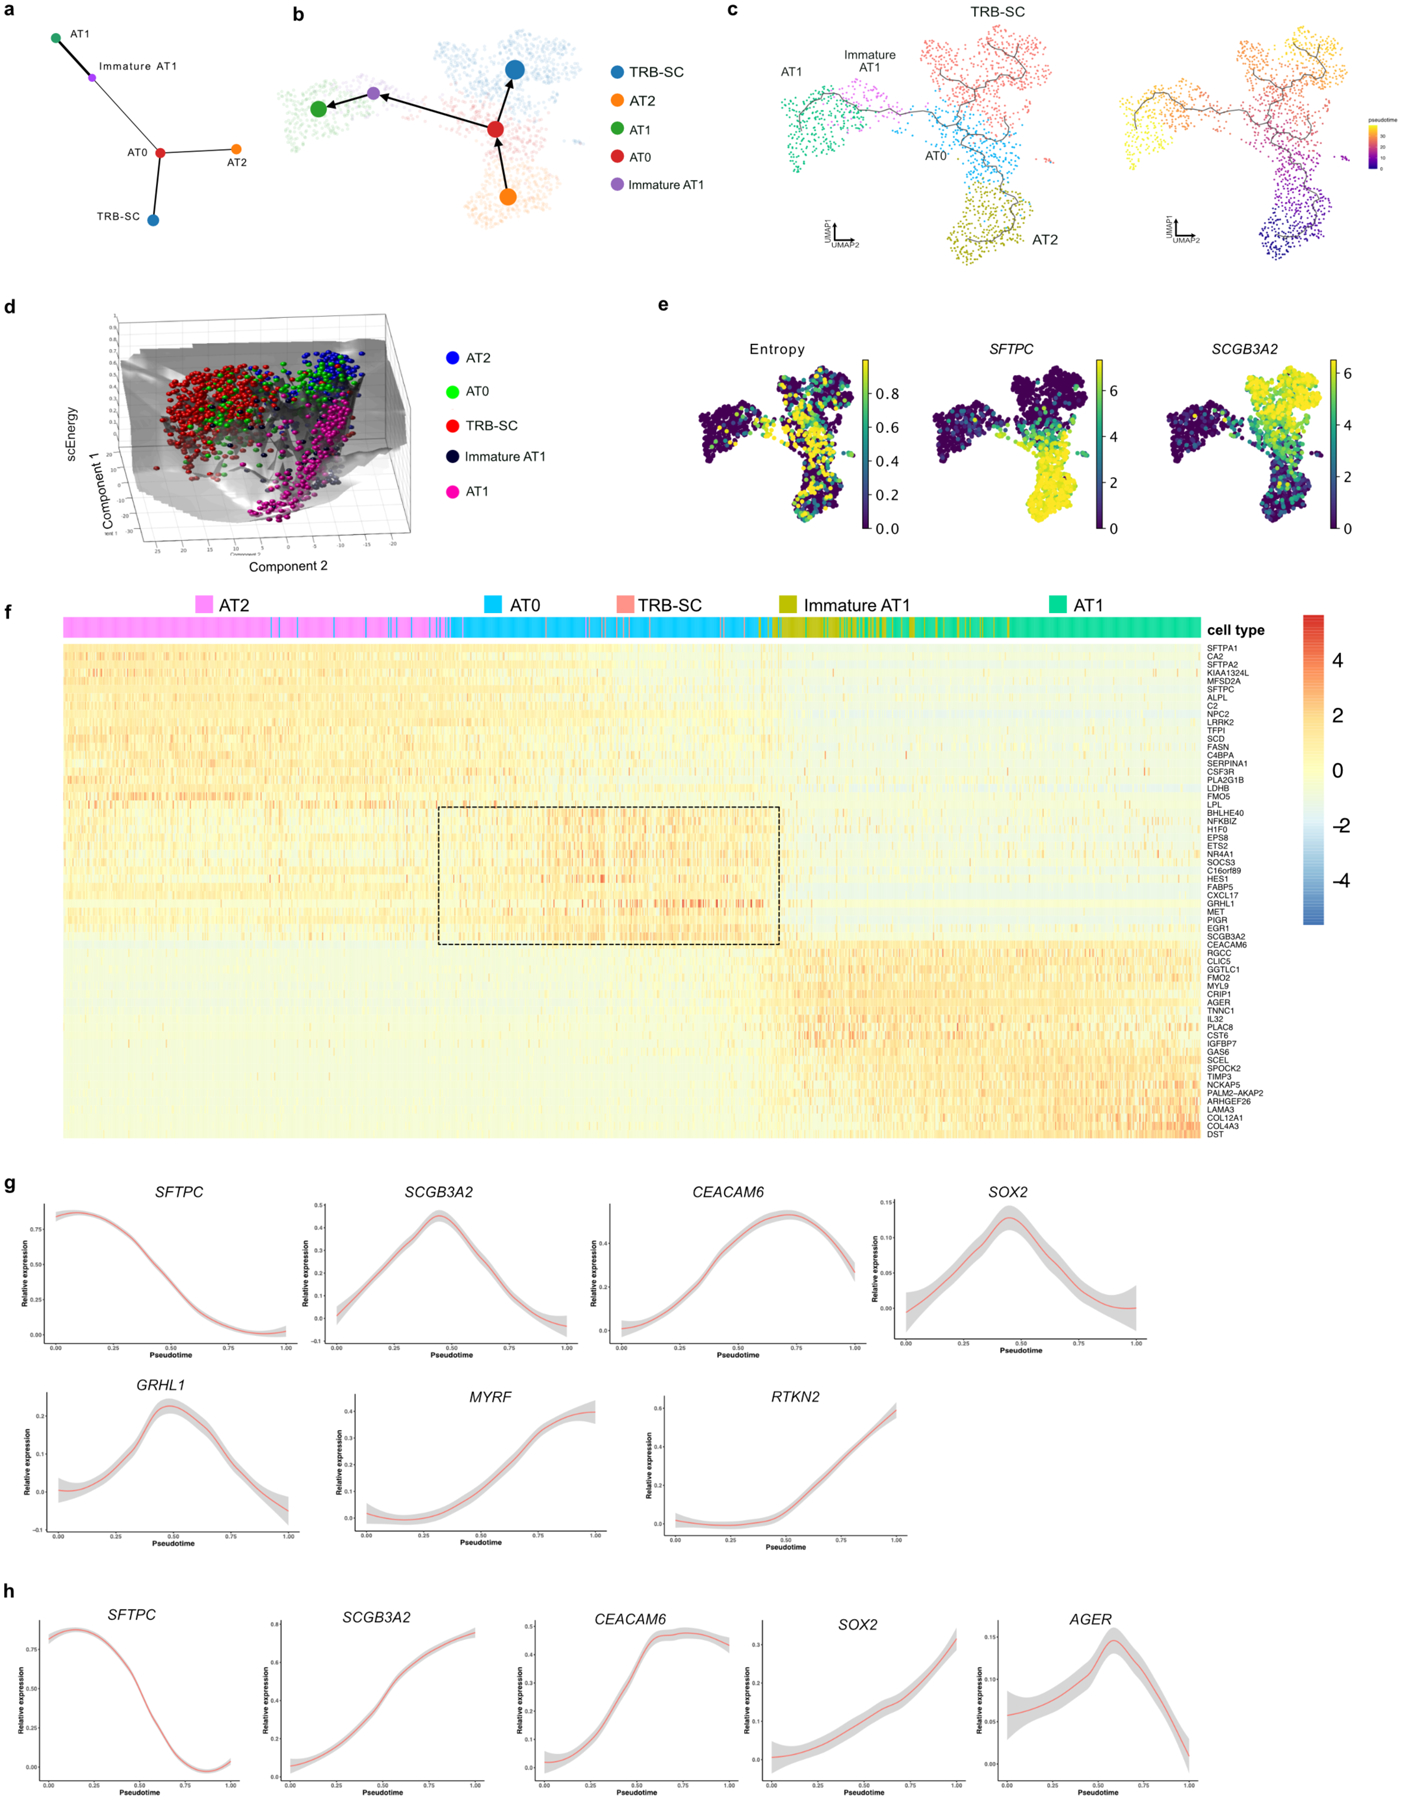
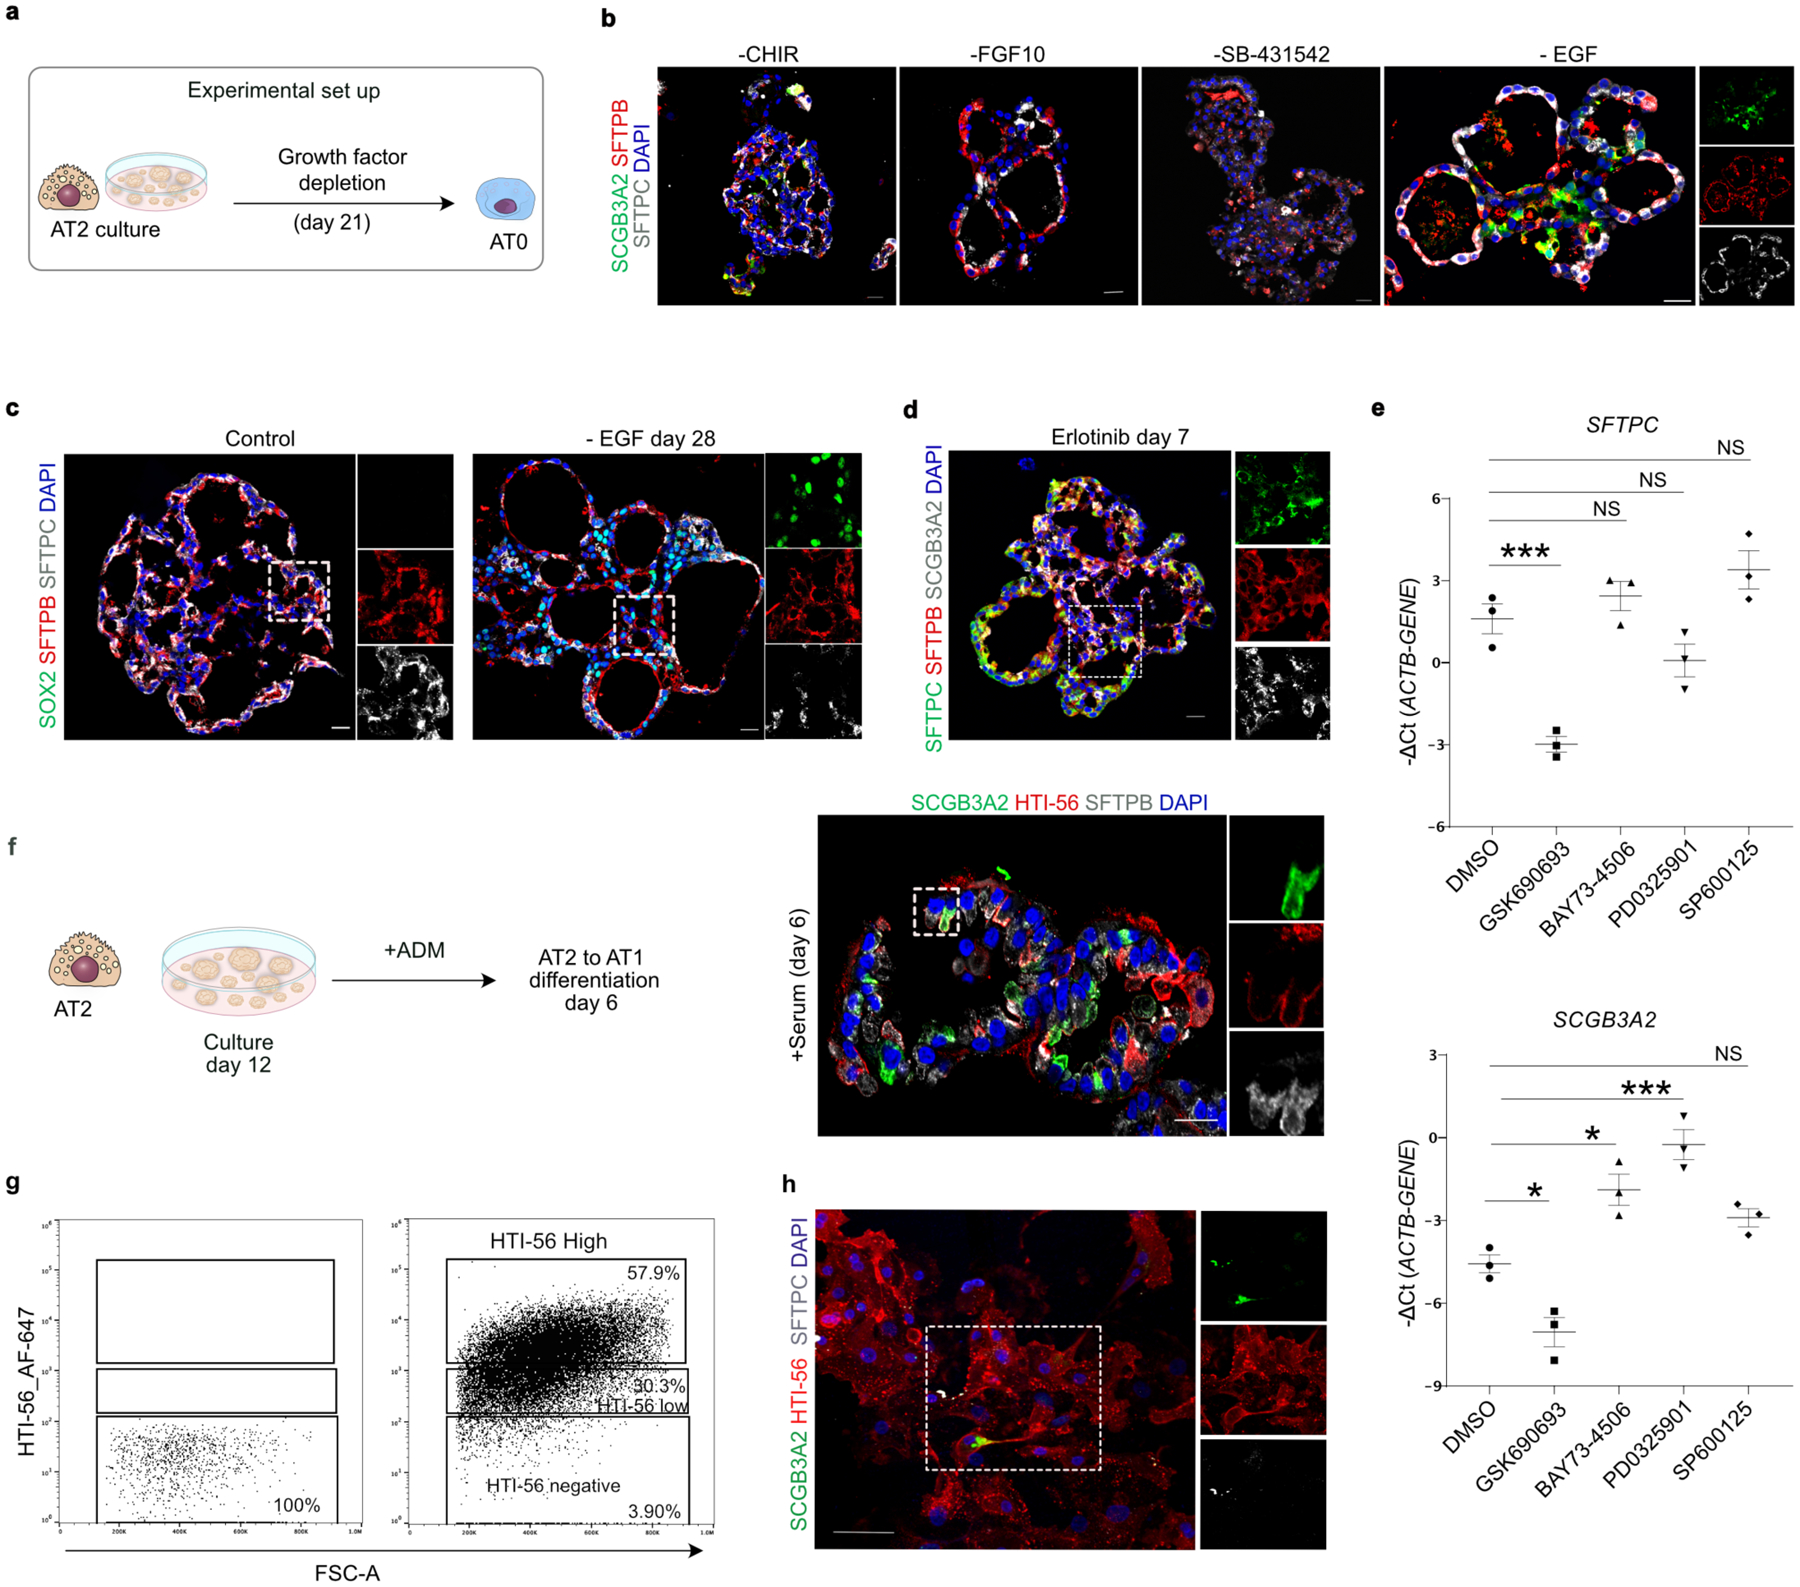
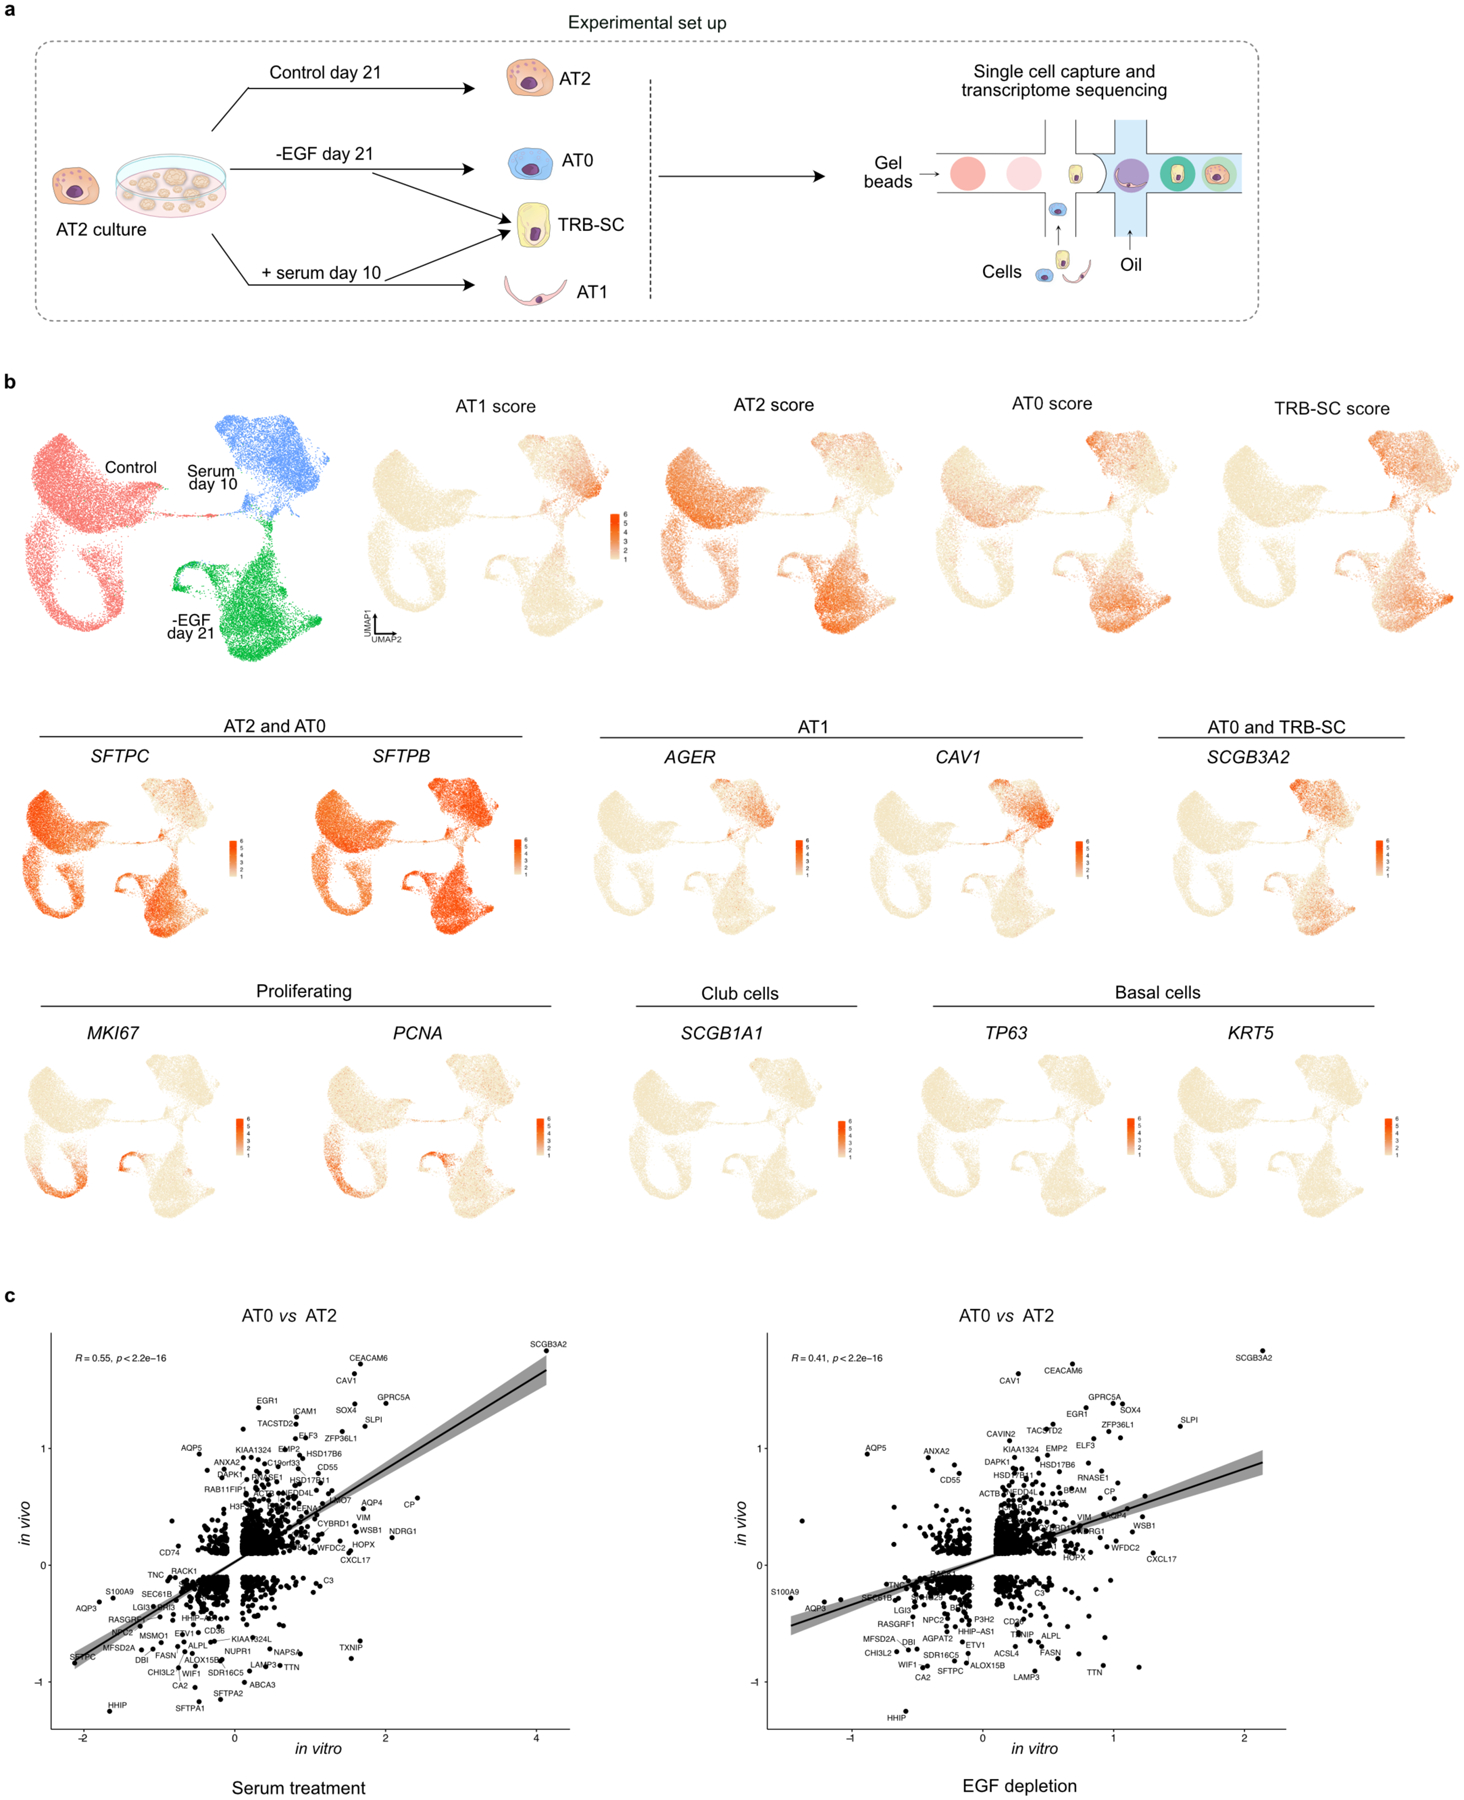
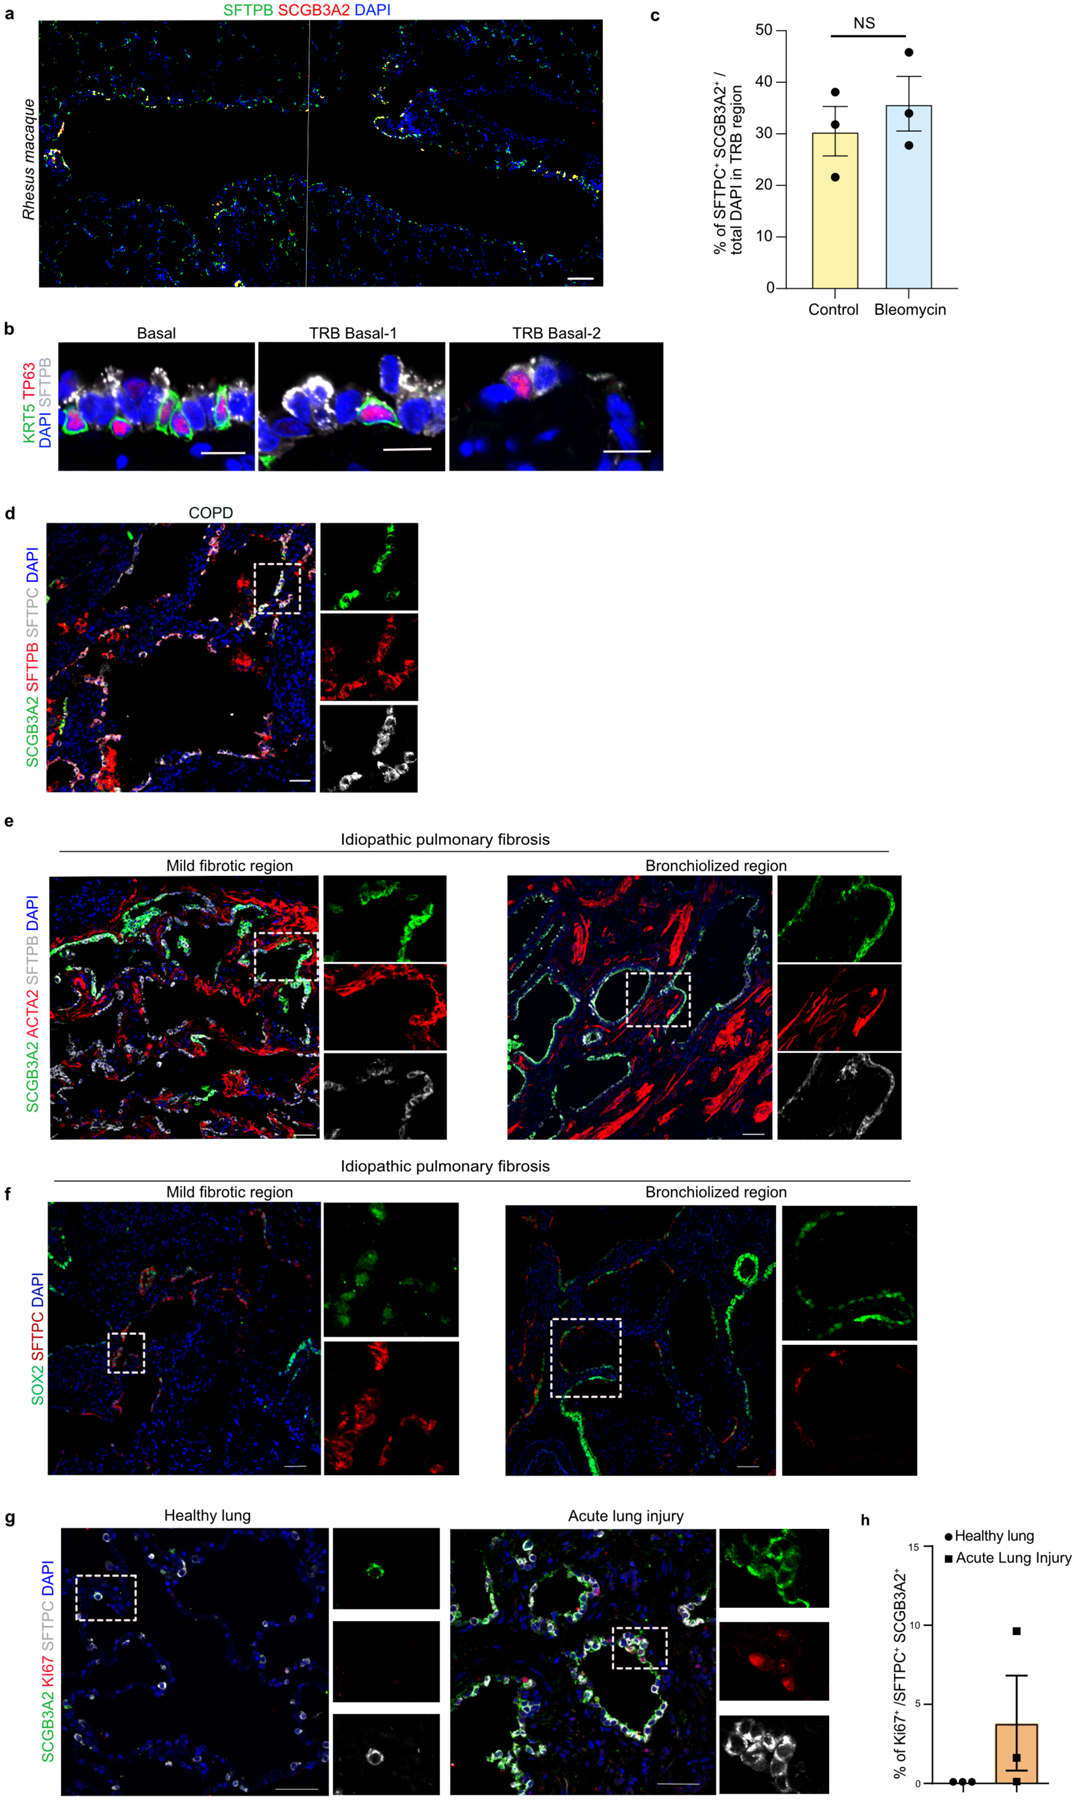
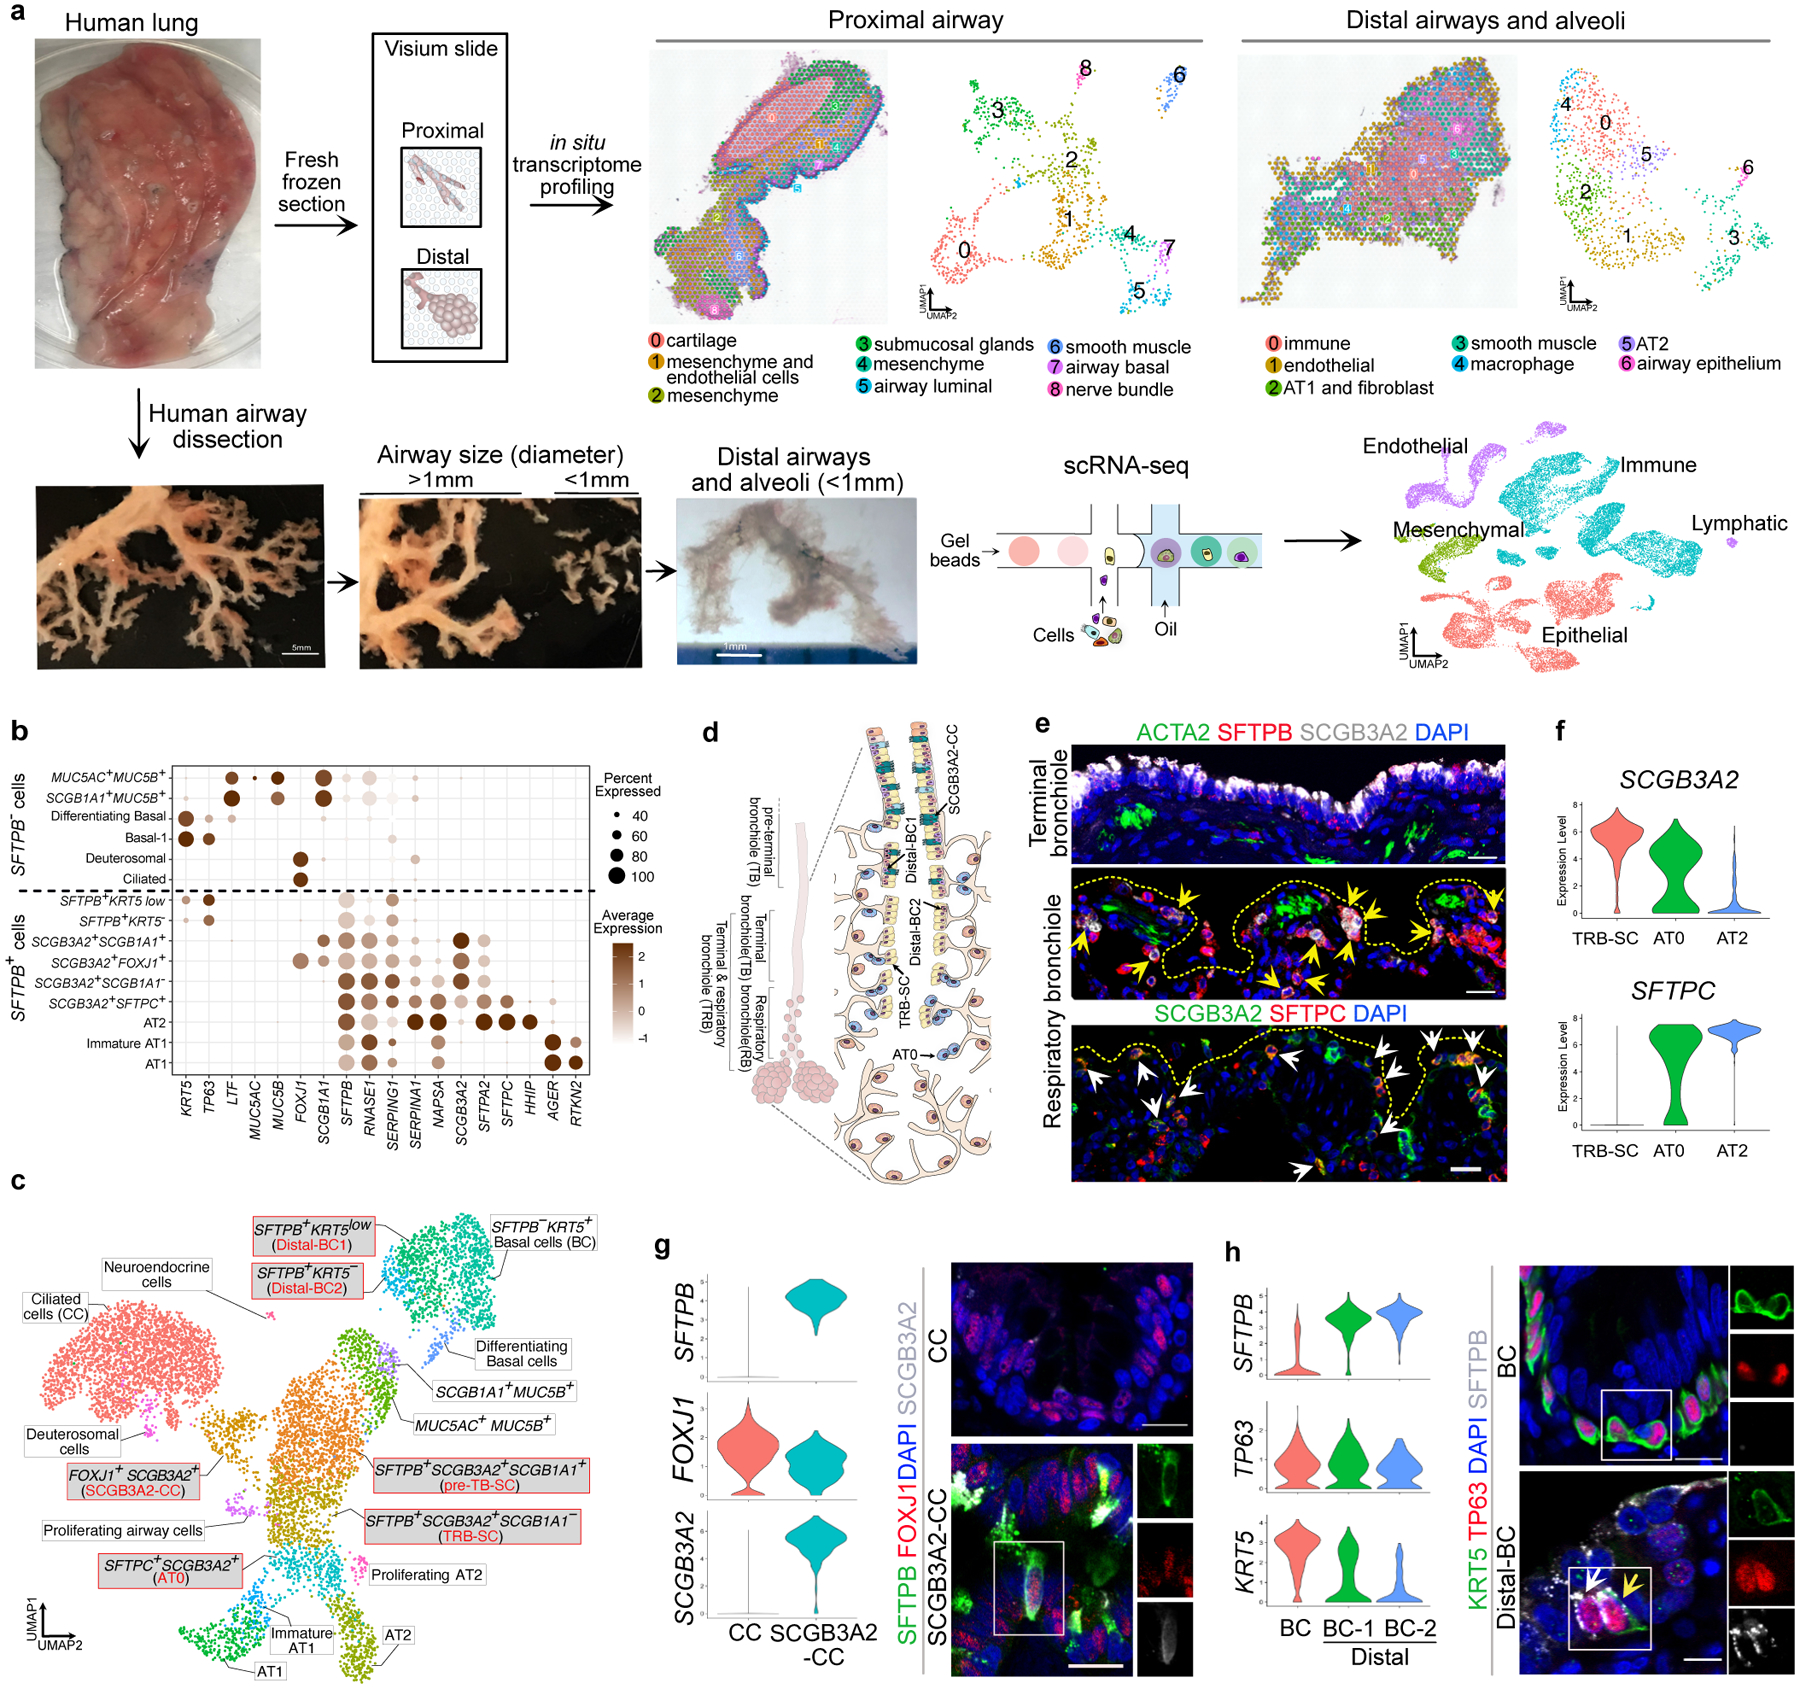
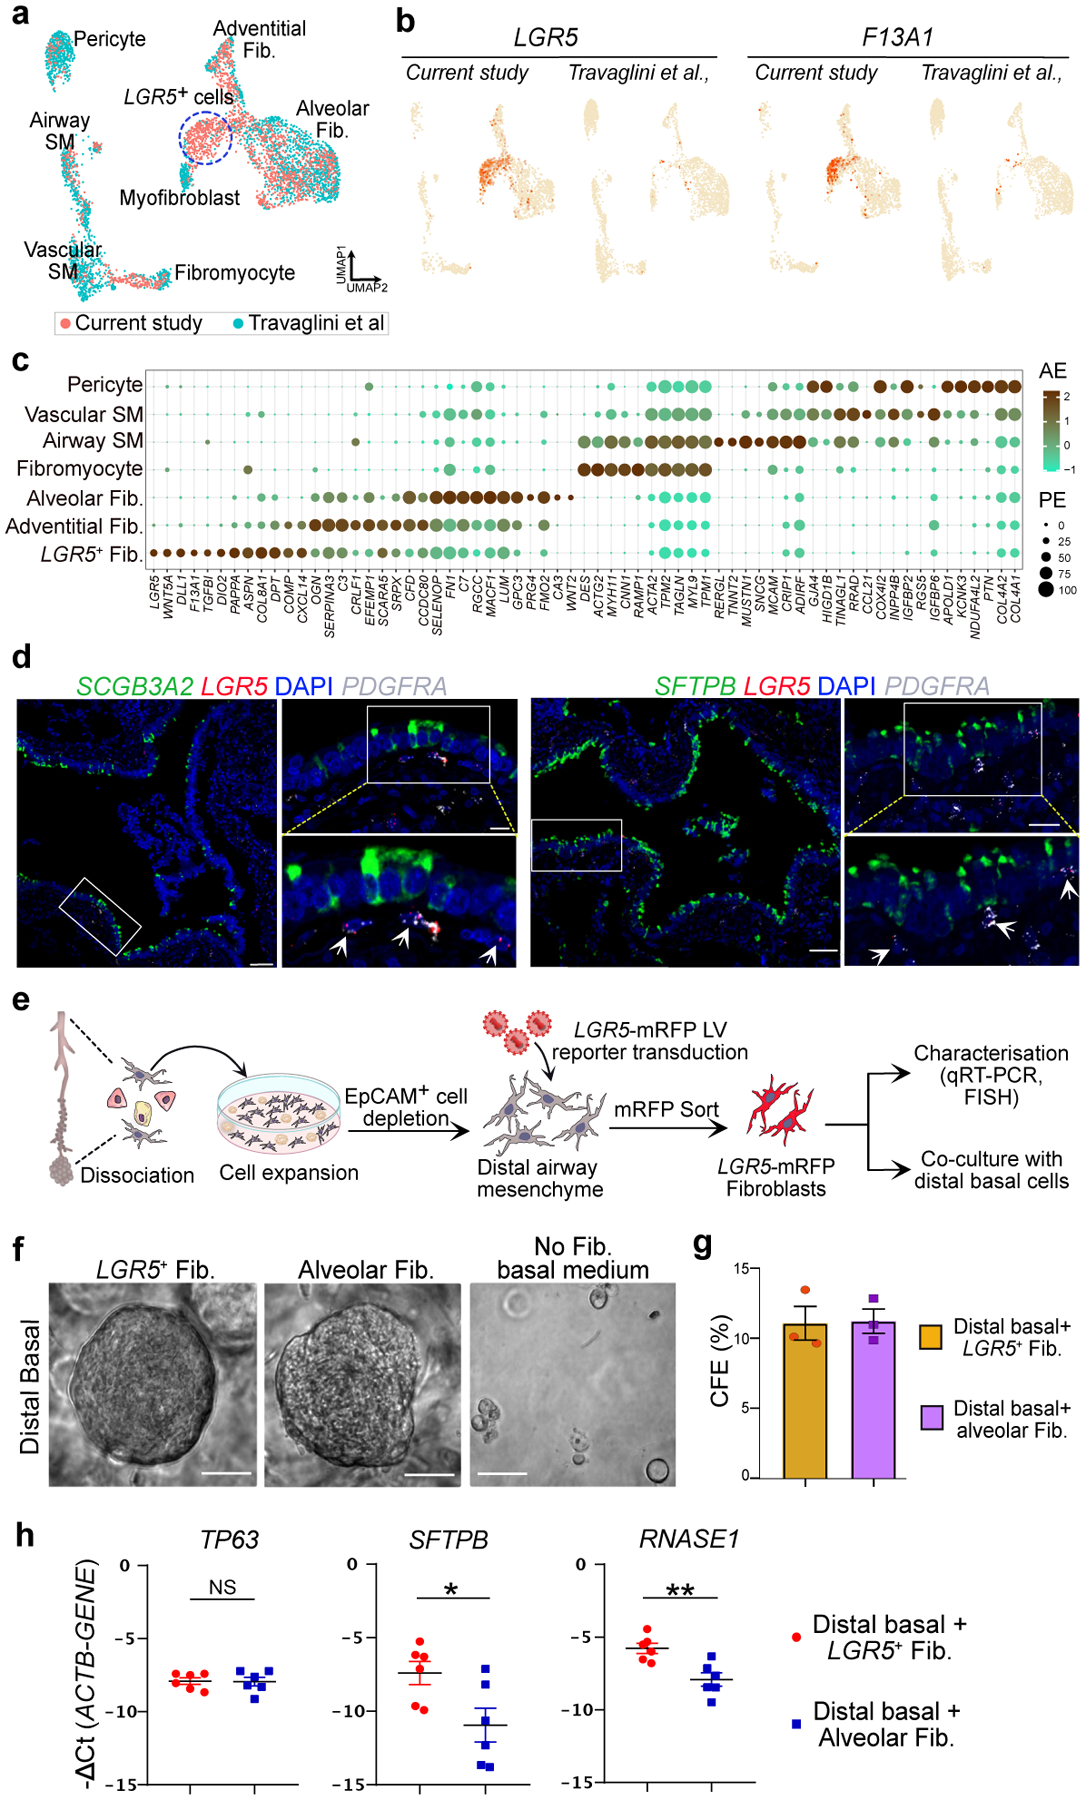
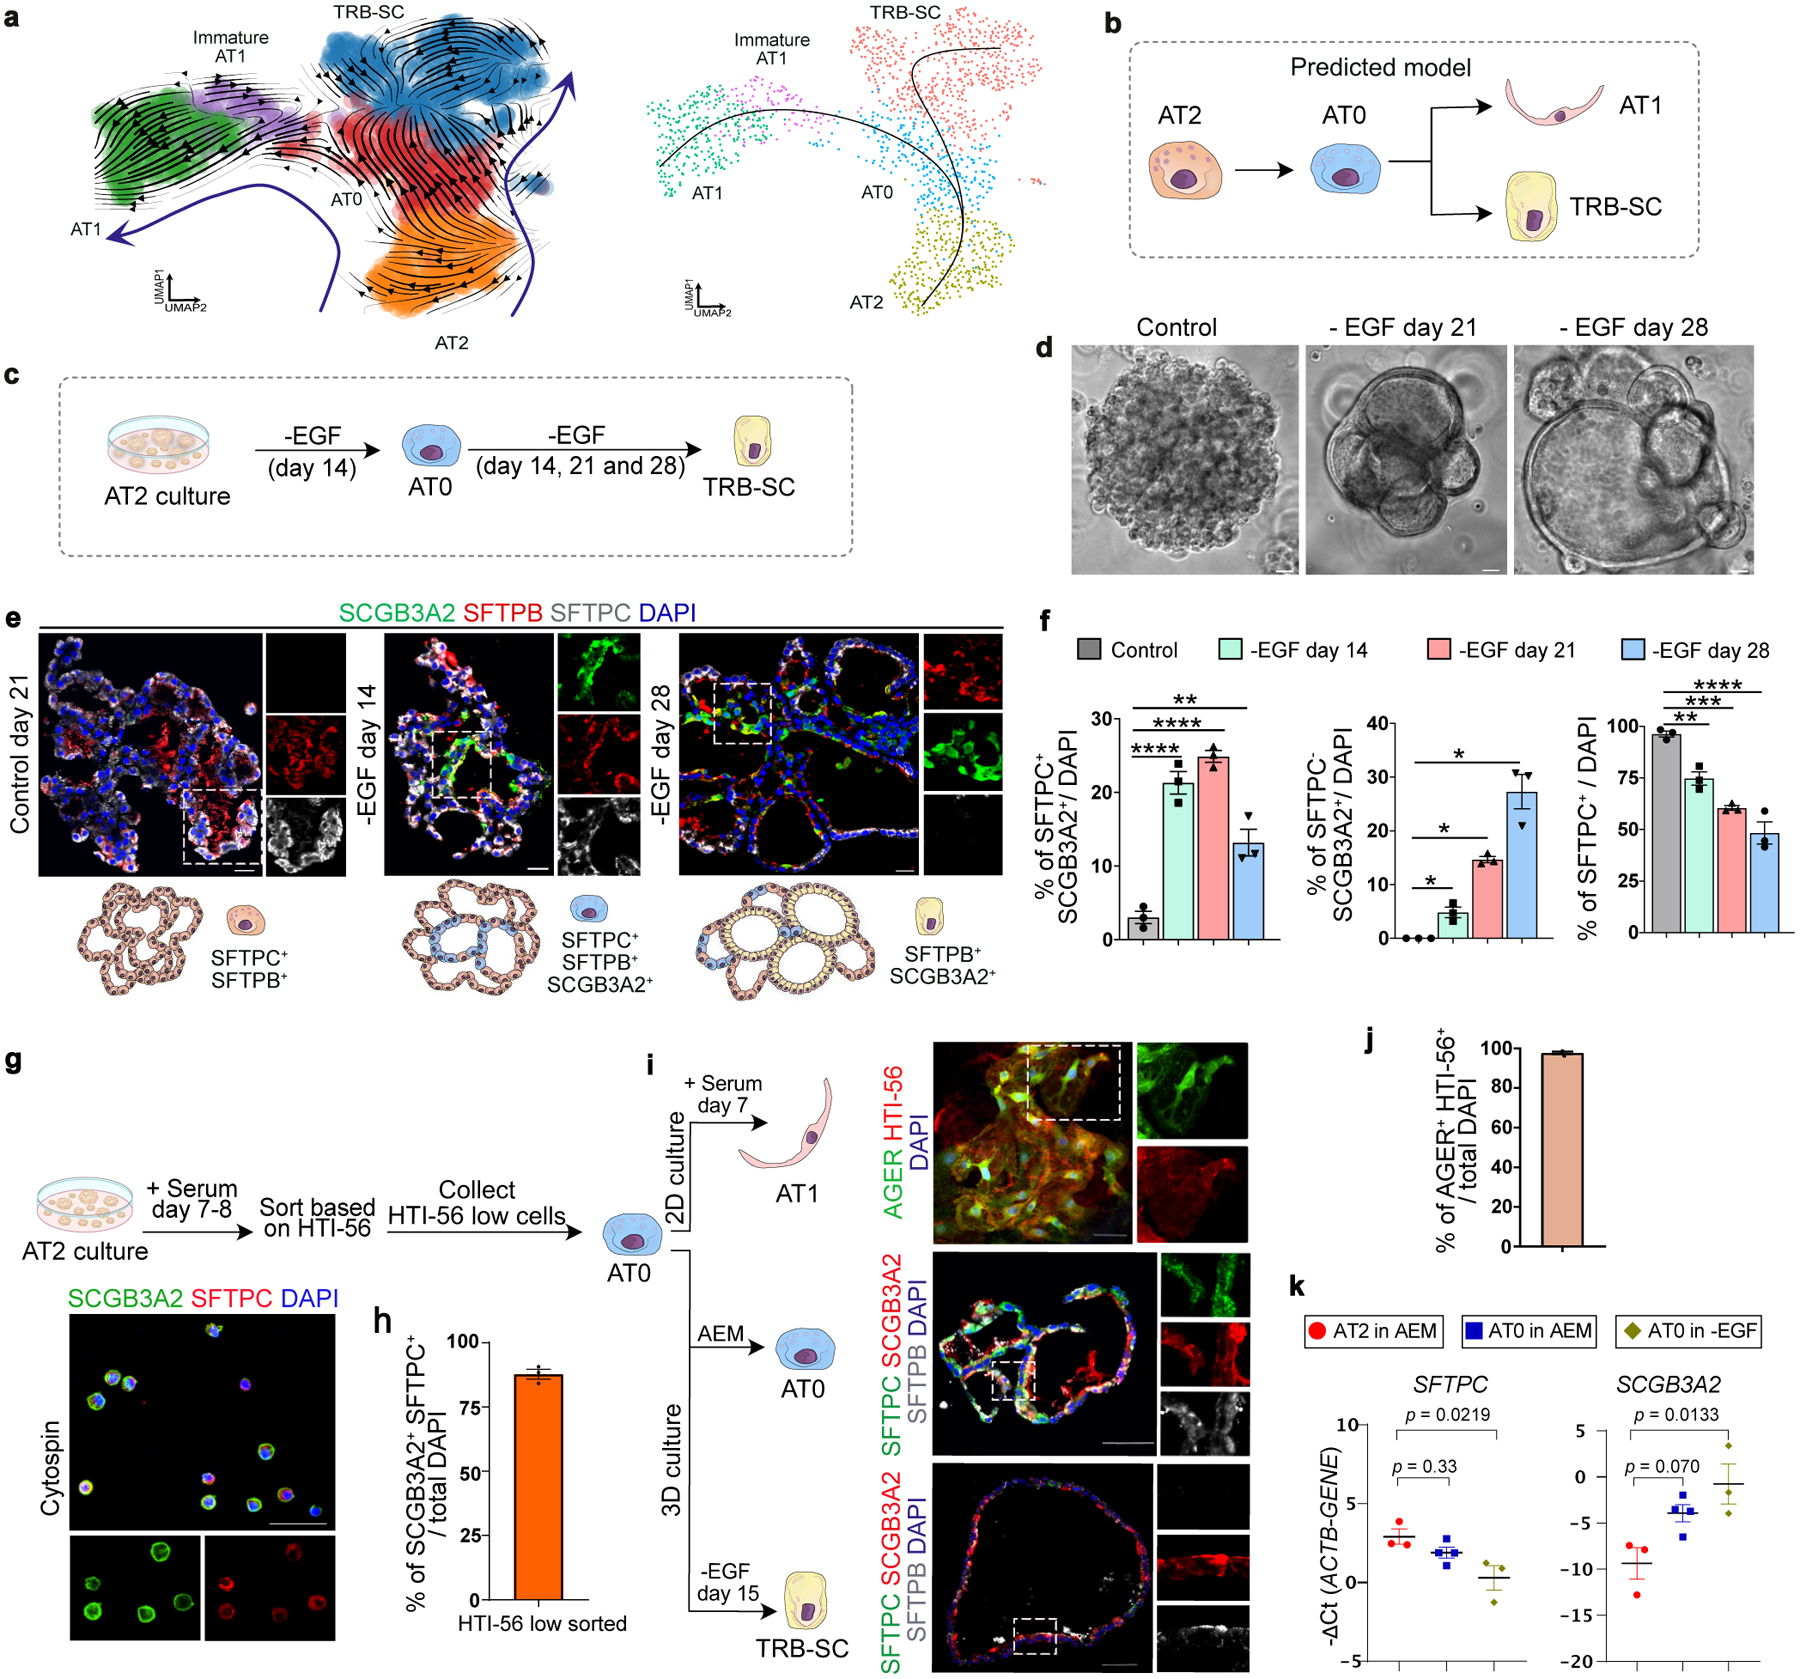
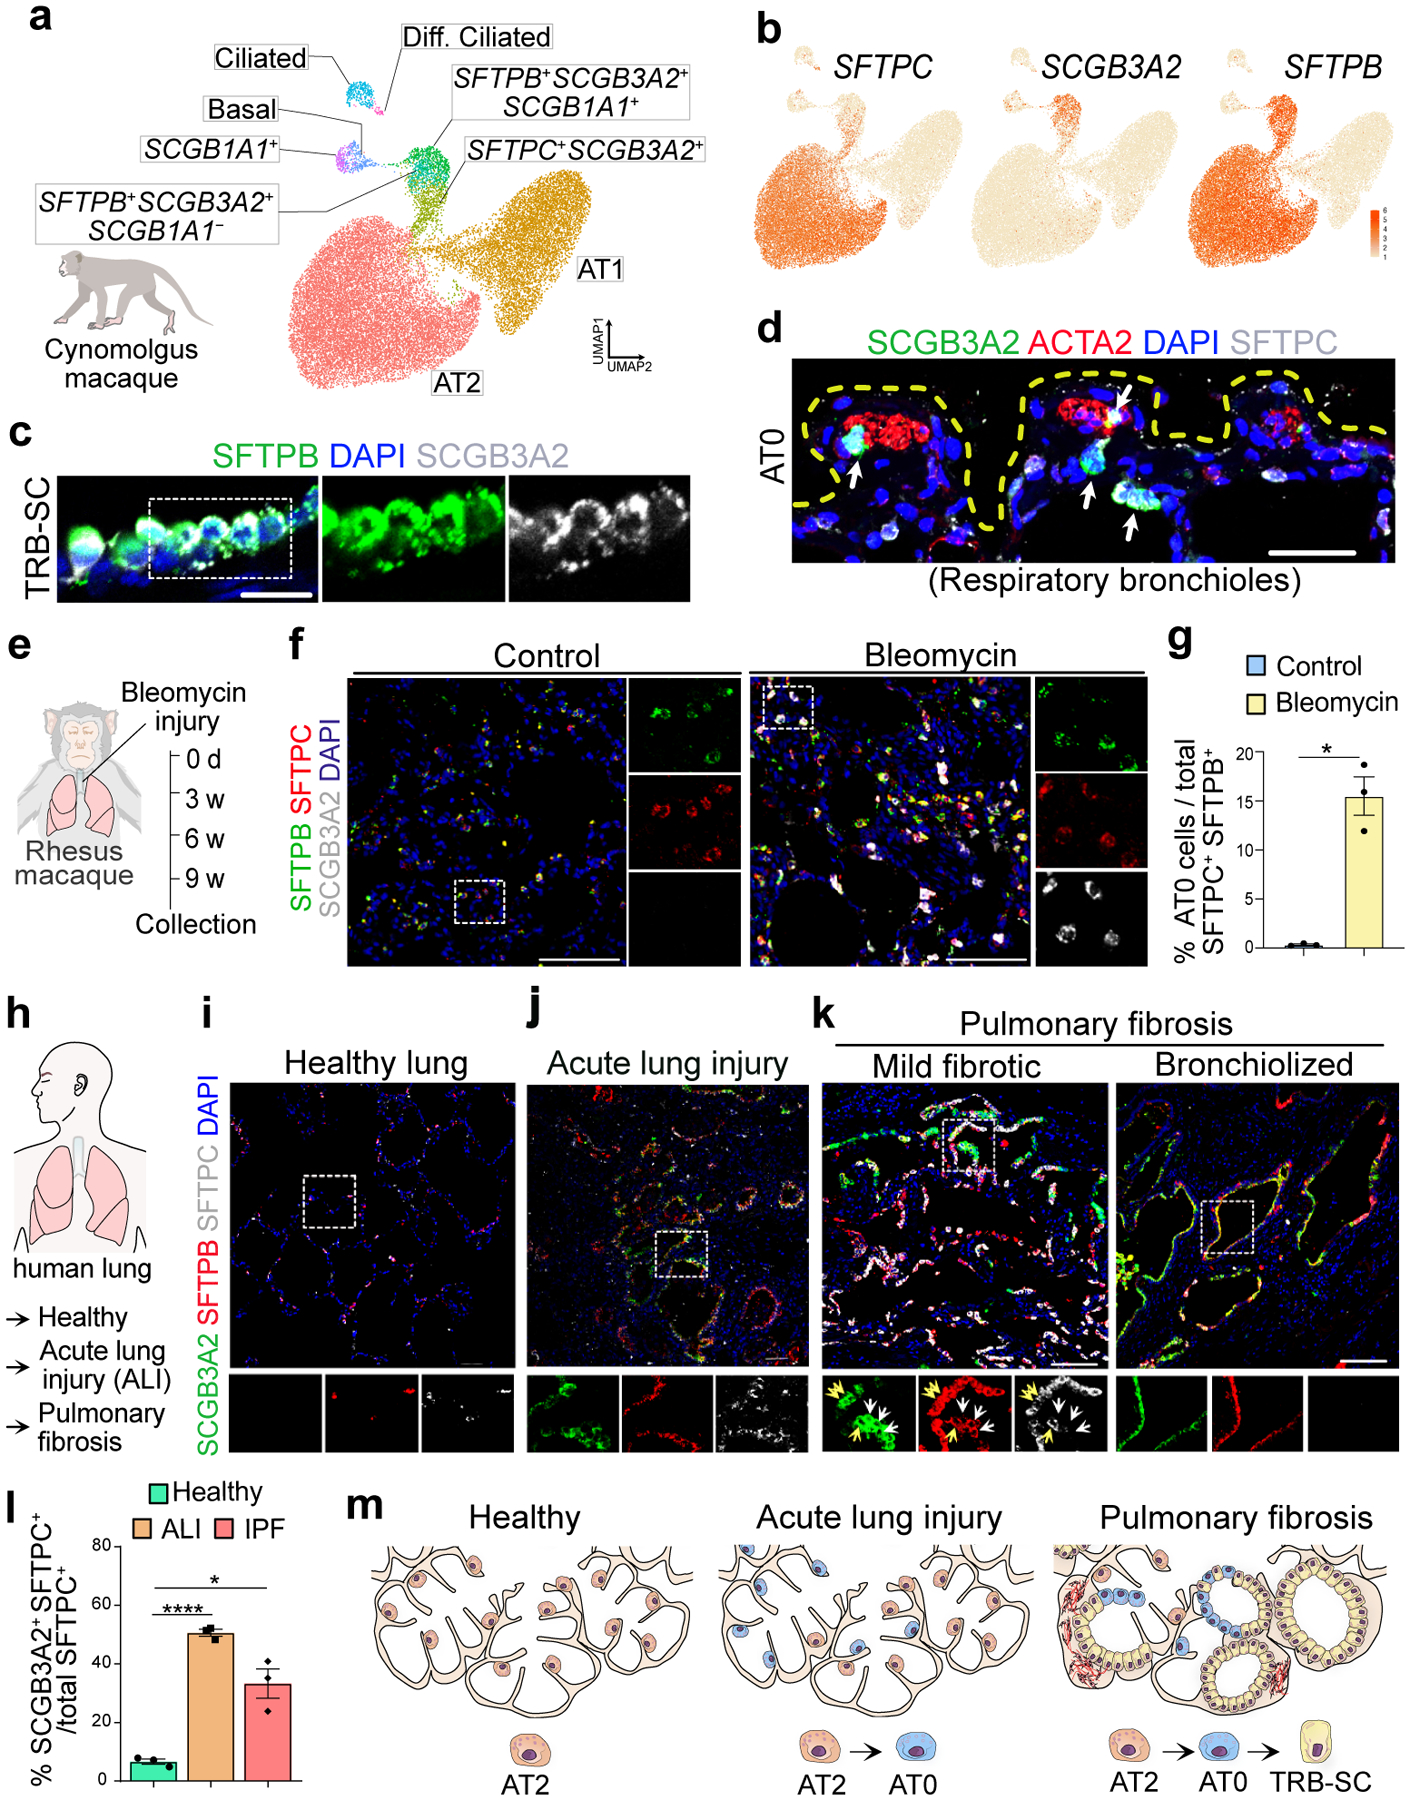
Mapping the spatial distribution and molecular identity of constituent cells is essential for understanding tissue dynamics in health and disease. We lack a comprehensive map of human distal airways, including the terminal and respiratory bronchioles (TRBs), which are implicated in respiratory diseases1-4. Here, using spatial transcriptomics and single-cell profiling of microdissected distal airways, we identify molecularly distinct TRB cell types that have not-to our knowledge-been previously characterized. These include airway-associated LGR5+ fibroblasts and TRB-specific alveolar type-0 (AT0) cells and TRB secretory cells (TRB-SCs). Connectome maps and organoid-based co-cultures reveal that LGR5+ fibroblasts form a signalling hub in the airway niche. AT0 cells and TRB-SCs are conserved in primates and emerge dynamically during human lung development. Using a non-human primate model of lung injury, together with human organoids and tissue specimens, we show that alveolar type-2 cells in regenerating lungs transiently acquire an AT0 state from which they can differentiate into either alveolar type-1 cells or TRB-SCs. This differentiation programme is distinct from that identified in the mouse lung5-7. Our study also reveals mechanisms that drive the differentiation of the bipotent AT0 cell state into normal or pathological states. In sum, our findings revise human lung cell maps and lineage trajectories, and implicate an epithelial transitional state in primate lung regeneration and disease.


Conflict of interest statement

Competing interest declaration

P.R.T. serves as a consultant for Surrozen Inc., Cellarity Inc., and Celldom Inc., on work not related to the contents of this manuscript. JRR is an employee of Genentech Inc. The other authors declare no competing interests.

Figures

Extended Data Fig. 1.
Extended Data Fig. 1.. Spatial transcriptomics of cartilaginous airway and distal lung.
Heatmap shows differentially expressed genes in each cluster of ST assay from proximal airway. b. ST spots show expression of indicated genes from proximal airway. c. Heatmap indicates differentially expressed genes in each cluster of ST assay from the distal lung. d. ST spots indicate the expression of indicated genes from the distal lung.
Extended Data Fig. 2
Extended Data Fig. 2. scRNA-seq of human distal airways and alveoli.
a. UMAPs show the expression of cell class specific marker genes. b. Dot plot indicates expression of cell type specific markers. c. UMAP shows the annotation of cell types from blood (c), endothelial (d), and mesenchymal (e) lineages. f. H&E reference sections and ST spots show the expression of RNASE1 in proximal (top) and distal airway (bottom). g. ST spots show the expression of MUC5AC, SFTPB, MUC5B and SCGB3A2 in proximal and distal airways as indicated. h. PLISH for RNASE1 (grey), MUC5B (green) and SFTPB (red) in proximal (top) and distal airways (bottom). Scale bar: 50 μm. i. Visualisation of indicated epithelial cell transcriptomic signatures on ST tissue section from distal lung.
Extended Data Fig. 3.
Extended Data Fig. 3.. Molecularly distinct cell types and zones in human airway.
a. Immunostaining for MUC5B (blue), MUC5AC (red), SCGB1A1 (green) and SCGB3A2 (grey) (bottom panel). Lines illustrate described zones. Scale bar: 100 μm. b. Quantification of distal airway epithelial cell types across the airway zones. Data is presented as mean ± SEM. (n=4 for zone-1 and n=3 for zones-2, 3 and 4). c. Co-staining for SCGB3A2 (green), SCGB1A1 (red), SFTPB (grey) in different regions of the human airway. Scale bar: 100 μm. d. Staining for SCGB1A1 (blue), MUC5B (green), SFTPB (red) and SCGB3A2 (grey) in different regions of the airway. Scale bar: 100 μm (main panel) and 20 μm (inset). e. Box plot showing the difference in cell populations identified in this study (red bar) and Habermann et al., (turquoise bar). Line in the box: median; box edges: 25/75 percentile; whiskers: 1.5 times interquartile range; points: outliers. f. Dot plot shows expression of indicated genes in TRB-epithelial cells (this study) but not in Deprez et al., scRNA-seq data from airway epithelial cells (annotated as distal airway). In panels c and d, images were stitched to show large area. Insets show zoomed images of regions highlighted in boxes. g. UMAP plots show the expression of indicated genes in epithelial cells. h. UMAP plots show the expression of indicated genes in epithelial cells. i. (top) Immunostaining for SCGB3A2 (green), SCGB1A1 (grey) and NAPSA (red) showing the expression of NAPSA in TRB-SC and TB-SC. Scale bar: 10 and 20 μm. (bottom) RNA-FISH for SCGB3A2 (green), TMEM45A (red) and SCGB1A1 (grey) showing the expression of TMEM45A in TRB-SC and TB-SC. Scale bar: 20 μm. j. PLISH for SCGB3A2 (green), SFTPB (red) and KDR (grey). Scale bar 50 μm. k. UMAPs show the expression of indicated genes in epithelial cell types. l. Bar plot showing the pathways enriched in TRB-SCs.
Extended Data Fig. 4
Extended Data Fig. 4. Gene expression signatures and pathway analysis of AT0s, distal-BCs and SCGB3A2-CCs.
a. Volcano plot shows differential gene expression between TRB-SC and AT0s. b. Volcano plot shows differential gene expression between AT2 and AT0s. c. Immunostaining for ACTA2 (green), SFTPB (red) and SCGB3A2 (grey) (left and top right) showing rare AT0s found in alveolar septae in normal lungs. Immunostaining for SFTPB (green), SFTPC (red) and SCGB3A2 (grey) (bottom right) showing alveolar sacs. Scale bar: 50 and 20 μm. d. UMAP plot and immunostaining for SOX2 (green), SFTPC (red) show the expression of SOX2 in AT0s near respiratory bronchioles. Scale bar: 50 μm. Inset: individual channels of regions indicated by a black box. e. Violin plots show expression patterns of genes encoding indicated transcription factors in TRB-SC, AT0, and AT2s. f. Heatmap shows expression of indicated genes in deuterosomal, ciliated, SCGB3A2-CC and TRB-SC cell populations. (Scale shows z-score). g. Volcano plot shows differential gene expression between SCGB3A2-CC and deuterosomal cell populations. h. Quantification of SCGB3A2-CC cell type across the airway zones. Data is presented as mean ± SEM (n=4 for zones-1, 2 and 4; n=3 for zone-3). i. Heatmap shows expression of indicated genes in basal, distal-BC1 and distal-BC2 cell populations. (rows were hierarchically clustered and scale shows z-score). j. Violin plot shows the expression of indicated genes in basal cell populations. k. Violin plot demonstrates the expression of indicated genes in different basal cell populations. l. Quantification of distal basal cell types across the airway zones. Data is presented as mean ± SEM (n=4 for zone-1, n=5 for zone-2, n=3 for zone-3 and n=4 for zone-4). m. Volcano plot shows differential gene expression between IPF basaloid (from Habermann et al.,) and distal-BC2 cell populations. n and o. UMAPs show the expression of TP63, SFTPB and FOXJ1 and SCGB3A2 in distal, intermediate and proximal airway cells profiled in Deprez et al.
Extended Data Fig. 5.
Extended Data Fig. 5.. Transcriptional regulation of TRB-specific epithelial cells.
a. Heatmap showing the enrichment of transcription factor regulons in epithelial cell types. b. Dot plots indicate the expression of transcription factors in epithelial cell types.
Extended Data Fig. 6.
Extended Data Fig. 6.. Molecular and phenotypic differences of basal cells isolated from proximal and distal airways.
a. Schematic depicting the location of airway for sampling the basal cells (top, proximal airways and bottom, distal airways) for organoid cultures and Air liquid interface (ALI) cultures. b. Representative basal cell organoid images of proximal and distal airways. c. Quantification of the colony formation efficiency (CFE). Data is presented as mean ± SEM. NS (p = 0.5462) (unpaired two-tailed t-test) (n=3). d. SFTPB (green), TP63 (red) and CK5 expression (grey) on 2D cultures. Scale bar 50 μm. e. Representative whole mount immunostaining image for SCGB3A2 (green), SCGB1A1 (red) and SFTPB (red) expression in basal cell ALI culture of proximal and distal airways at day 28. Scale bar: 20 μm. f. Relative mRNA expression of TP63, SFTPB, KRT5 and RNASE1 in basal cell cultures. Data is presented as mean ± SEM. (** p = 0.0073 for TP63), (* p = 0.0490 for KRT5), (* p = 0.0130 for SFTPB) and (*** p = 0.0006 for RNASE1) (unpaired two-tailed t-test) (n=3, distal airway; n=4, proximal airway, SFTPB mRNA was not detected in two biological replicates of proximal airway). g. Relative mRNA expression of TP63, SFTPB, RNASE1, SCGB1A1, SCGB3A2, and FOXJ1 in basal cell ALI culture of proximal and distal airways at day 28. Data is presented as mean ± SEM. (* p = 0.0312 for TP63), (*** p = 0.0003 for SFTPB), (** p = 0.0028 for RNASE1), (* p = 0.0234 for SCGB3A2), (** p = 0.0071 for SCGB1A1), and (NS p = 0.75 for FOXJ1) (unpaired two-tailed t-test with Welch’s correction) (n=5, distal airway; n=4, proximal airway). h. Representative histology images showing the difference in ciliary length in proximal and distal airways. Scale bar: 10 μm. i. Representative histology images showing the difference in ciliary length in basal cell ALI culture proximal and distal airways at day 28. Scale bar: 10 μm. j. Quantification of cilia length and cilia beating frequency in basal cell ALI culture of proximal and distal airways. Data is presented as mean ± SEM. * (p = 0.0359) (unpaired two-tailed t-test) (n=6).
Extended Data Fig. 7.
Extended Data Fig. 7.. Transcriptional and signalling activity of newly identified mesenchymal cells.
a. ST spots show the expression of FGF14 and WNT2. b. Representative RNA-FISH images showing the expression of SFTPB (green), LGR5 (red) and PDGFRA (grey) (left) and SCGB3A2 (green), LGR5 (red) and PDGFRA (grey) (right) and Scale bar: 50 μm and 20 μm. DAPI stains nuclei (blue). Insets show magnified regions. c. Quantification of LGR5+ fibroblasts in large and distal airway. Data is presented as mean ± SEM. NS (p = 0.3152) (unpaired two-tailed t-test) (n=3) d. Heatmap showing net outgoing and incoming signals in respective cell types as predicted by Cellchat algorithm. e. FGF and PDGF signalling activity from (top panel) and towards (bottom panel) LGR5+ cells and their interaction with epithelial cells as predicted using CellChat algorithm. f. Heatmap shows the enrichment of transcription factor regulons in mesenchymal cell types. g. Heatmap shows LGR5+ fibroblast specific transcription factor expression pattern in mesenchymal cell types (scale shows z-score).
Extended Data Fig. 8.
Extended Data Fig. 8.. LGR5-mRFP reporter validation and co-culture.
a. Schematic depicting pLKO-LGR5-mRFP reporter construct. b. Representative gating for FACS sorting of LGR5-mRFP reporter fibroblasts utilized for organoid co-cultures. c. RNA-FISH for LGR5 (left), and PDGFRα (right) on LGR5-mRFP fibroblasts. d. Relative mRNA expression of LGR5, WNT5A, WNT2, CA3, and FGF7 in cultured LGR5-mRFP fibroblasts vs alveolar fibroblasts. Data is presented as mean ± SEM. (** p = 0.0055 for LGR5), (* p = 0.0187 for WNT5A), (NS p = 0.0972 for CA3), (NS p = 0.1216 for WNT2), and (NS p = 0.1525 for FGF7) (unpaired two-tailed t-test with Welch’s correction) (n=3). e. Immunostaining for SFTPB (green), TP63 (red) and KRT5 (grey) in basal cell organoid co-cultured with LGR5-mRFP fibroblasts or alveolar fibroblasts. Scale bar: 50 μm. f. Relative mRNA expression of SCGB3A2 and SOX2 in AT2s co-cultured with LGR5-mRFP fibroblasts. Data is presented as mean ± SEM. NS p = 0.2383, and *p = 0.0383 and (unpaired two-tailed t-test with Welch’s correction) (n=3).
Extended Data Fig. 9.
Extended Data Fig. 9.. Expression pattern of markers of distal airway cells in fetal and post-natal human airways.
UMAP shows expression pattern of indicated genes in fetal lung epithelial scRNA-seq data from Miller et al. b. Schematic representation of human fetal airway and distal tip bud. c. Immunostaining for SCGB3A2 (green) and SFTPB (grey) on 19–20 weeks old human fetal lung. Scale bar 100 μm. Insets show magnified regions. d. Immunostaining for SCGB3A2 (green), TP63 (red) and SFTPB (grey) in human fetal extrapulmonary airway. Scale bar: 100 μm. e. Representative RNA-FISH images showing the expression of SCGB3A2 (green), LGR5 (red) and PDGFRA (grey). Scale bar: 50 μm. DAPI stains nuclei (blue). f. Schematic representation of human postnatal lung showing TRBs and distal alveoli. g. Co-staining for SCGB3A2 (green) and SFTPB (grey) in 7-month-old postnatal human lung. Scale bar 100 μm. Insets show magnified regions. h. Immunostaining for SCGB1A1 (blue), SCGB3A2 (grey) and SFTPB (green) expression in postnatal human lung. Scale bar: 100 μm. i. Co-staining for SCGB3A2 (green), TP63 (red) and SFTPB (grey) expression in 7–12 months old post-natal lung. Scale bar: 100 μm. j-m. Representative immunostaining images from 7 months old postnatal human lung show the expression of (j) KRT5 (green), TP63 (red) and SFTPB (grey). Scale bars: 20 μm (top), 10 μm (bottom left) and 5 μm (bottom right). (k) SFTPB (green), FOXJ1 (red) and SCGB3A2 (grey). Scale bar: 10 μm. (l) SCGB3A2 (green) and SFTPB (red). Scale bar 10 μm. (m) SCGB3A2 (green) and SFTPC (red). Scale bar 20 μm. DAPI stains nuclei (blue). c, e-m: Insets indicate individual colour channels of regions marked in white boxes.
Extended Data Fig.10.
Extended Data Fig.10.. Computational prediction of AT2 cellular transition dynamics.
a. PAGA graph of AT0, AT1, Immature AT1, AT2 and TRB-SC cells from normal adult human lung. b. Cellular trajectory on AT0, AT1, Immature AT1, AT2 and TRB-SC cells as inferred by scVelo and PAGA algorithms. c. Cellular trajectory (left) and cells ordered along pseudotime (right) as inferred by Monocle 3 algorithm on of AT0, AT1, Immature AT1, AT2 and TRB-SC cells. d. Overall energy landscape view of AT0, AT1, Immature AT1, AT2 and TRB-SC cells as predicted by scEpath algorithm. e. MuTrans analysis of AT0, AT1, Immature AT1, AT2 and TRB-SC cells. Plots showing (from left to right) entropy, SFTPC level and SCGB3A2 level. f. Heatmap showing expression of genes along trajectory from AT2 to AT1 predicted by Slingshot algorithm. Genes enriched in AT0 cells are highlighted by the black outline. g. Line plots showing smoothened expression (Loess smoothened) of select genes along Slingshot predicted AT2 to AT1 trajectory. Gray indicates 95% confidence interval derived from the smoothened fit. h. Line plots showing smoothened expression (Loess smoothened) of select genes along Slingshot predicted AT2 to TRB-SC trajectory. Gray indicates 95% confidence interval derived from the smoothened fit.
Extended Data Fig.11.
Extended Data Fig.11.. Organoid models reveal new cell trajectories in human lungs
a. Schematic depicting experimental workflow for signalling modulation in organoid cultures. b. Representative immunofluorescence images show expression of SCGB3A2 (green), SFTPB (red), and SFTPC (grey) in organoids cultured in CHIR, FGF10, SB43152 and EGF depletion conditions for 21 days. Scale bar: 20 μm. c. Staining for SOX2 (green), SFTPB (red), and SFTPC (grey) in control and EGF depleted organoids. Scale bar: 20 μm. d. Staining for SFTPC (green), SFTPB (red), and SCGB3A2 (grey) expression in organoid cultures treated with Erlotinib (2 μm) at day 7. Scale bar: 20 μm. e. Relative mRNA expression of SFTPC, and SCGB3A2 in AT2 cultures treated with indicated small molecules for 7 days. Data is presented as mean ± SEM. *** (p = 0.0005 for GSK690693), NS (p = 0.6722 for BAY73–4506), NS (p = 0.2167 for PD0325901), NS (p = 0.1279 for SP600125) for SFTPC. * (p = 0.0133 for GSK690693), ** (p = 0.0081 for BAY73–4506), *** (p = 0.0003 for PD0325901), NS (p = 0.0940 for SP600125) for SCGB3A2. (Dunnett’s multiple comparisons test) (n=3). f. (left) Schematic depicting the experimental workflow to study AT2 to AT1 differentiation. (right) Immunostaining for SCGB3A2 (green) and HTI-56 (red), and SFTPB (grey) on organoids cultured in ADM for 6 days. Scale bar: 20 μm. DAPI stains nuclei (blue). g. Representative gating for FACS sorting of AT0 cells based on HTI-56 levels. h. Immunostaining for SCGB3A2 (green) and HTI-56 (red), and SFTPC (grey) on AT0 cells cultured in ADM for 7 days.
Extended Data Fig.12.
Extended Data Fig.12.. scRNA-seq on human lung organoids from different treatments and AT0 sorting.
a. Schematic showing experimental workflow for organoid scRNA-seq. b. UMAPs show expression pattern of indicated genes in specific cell populations as revealed by scRNA-seq from different culture conditions. c. Scatterplot showing the relative expression of genes in AT0 cells when compared to AT2 cells in organoid cultures (EGF depletion or serum addition) or in vivo. Linear regression is shown by the black line and Pearson correlation is shown with 95% confidence interval indicated by grey colour.
Extended Data Fig. 13.
Extended Data Fig. 13.. TRB regions of non-human primates.
a. Immunostaining for SFTPB (green) and SCGB3A2 (red) in terminal and respiratory bronchioles of Rhesus macaque. Scale bar 100 μm. Images from adjacent regions were aligned to show large area. b. Representative immunofluorescence images from terminal and respiratory bronchioles of Rhesus macaque show the expression of KRT5 (green), TP63 (red) and SFTPB (grey). Scale bar 12.5 μm (left and right) and 15 μm (middle). c. Quantification of AT0 cells in TRB regions in control and bleomycin treated lungs. Data is presented as mean ± SEM (p = 0.496) (unpaired two-tailed t-test) (n=3). d. Immunostaining for SCGB3A2 (green), SFTPB (red), and SFTPC (grey) in COPD lung. Scale bar: 50 μm. (left). e. Staining for SCGB3A2 (green), ACTA2 (red), and SFTPC (grey) in mild fibrotic (left) and bronchiolized region (right) of the IPF lung. Scale bar: 50 μm. f. Staining for SOX2 (green) and SFTPC (red) in mild fibrotic (left) and bronchiolized region (right) of the IPF lung. Scale bar: 50 μm. Maximum intensity projection of z-stacks were shown. g. Staining for SCGB3A2 (green), KI67 (red) and SFTPC (grey) in normal human lung and in acute lung injury. Scale bar: 50 μm. h. Quantification of proliferating (Ki67+) cells in control and ALI lungs. Data is presented as mean ± SEM (n=3). In panels – d-g, insets indicate individual color channels of regions marked in white boxes.
Figure. 1.
Figure. 1.. Spatial and single-cell transcriptomics reveal previously uncharacterized epithelial cell-types in distal airways.
a. Schematic representation of experimental workflow for spatial transcriptomics (ST) (left upper panel) and distal airway dissection, dissociation, and capture for scRNA-seq (left bottom panel). In situ (left) and UMAP visualization of ST spot clusters obtained from the proximal airway and distal lung (right upper panel). UMAP visualization of major cell classes profiled by scRNA-seq (right bottom panel). b. Dot plot shows distal and proximal airway cell specific markers. c. UMAP indicates the annotation of epithelial cell types. d. Schematic representation of human distal airways. e. Immunostaining for ACTA2 (green), SFTPB (red) and SCGB3A2 (grey) (top and middle panels); SCGB3A2 (green) and SFTPC (red) (bottom panel). Top panel: terminal bronchiole and bottom two panels: respiratory bronchioles. Yellow arrows (middle panel) and white arrows (bottom panel) indicate SFTPB+ SCGB3A2+ and AT0 cells, respectively. Scale bar 20μm. Top and middle panels: maximum intensity projection of zstacks. f. Violin plots show the expression of indicated genes in TRB-SC, AT0 and AT2s. g. Violin plots show the expression of indicated genes in ciliated and SCGB3A2+-CC (left) and co-staining for SFTPB (green), FOXJ1 (red) and SCGB3A2 (grey) (right) in proximal (upper image) and distal airway (bottom image). Scale bar 20 μm (top), 10 μm (bottom). h. Violin plots show the expression of indicated genes in airway basal, distal-BC1 and distal-BC2 (left) and immunostaining for KRT5 (green), TP63 (red) and SFTPB (grey) in proximal (upper image) and distal airways (bottom image). White arrow indicates distal-BC1 and yellow arrow indicates distal-BC2. Scale bars 20 μm (top), 10 μm (bottom). g, h: Insets indicate individual channels of regions marked by white boxes. DAPI-nuclei (blue).
Fig. 2.
Fig. 2.. LGR5 marks a unique fibroblast population in airways.
a. UMAP shows integration of mesenchymal cells from this study and data from Travaglini et al. b. UMAP shows the expression of LGR5 and F13A1 in the integrated dataset specifically in the newly identified cell population in this study. c. Dot plot show the relative expression of markers of mesenchymal cell types detected in this study. AE refers to Average Expression and PE is percent expressed. d. Representative RNA-FISH images showing the expression of SCGB3A2 (green), LGR5 (red) and PDGFRA (grey) (top) and SFTPB (green), LGR5 (red) and PDGFRA (grey) (bottom). Scale bar 20 μm and 50 μm. DAPI stains nuclei (blue). Insets show magnified regions. Maximum intensity projection of z-stacks are shown. e. Schematic depicting experimental workflow for LRG5+ fibroblast isolation, culture, characterisation and co-culture. f. Representative brightfield images of human basal cell organoids from distal airways cultured in indicated conditions at day 8. Scale bar: 500 μm. g. Quantification of the colony formation efficiency (CFE) of human distal basal organoids grown in indicated conditions at day 8. Data is presented as mean ± SEM. NS (p = 0.9231) (unpaired two-tailed t-test with Welch’s correction) (n=3). h. Relative mRNA expression of TP63, SFTPB, and RNASE1 in organoids that are grown in fibroblast co-cultures. Data is presented as mean ± SEM. NS (p = 0.9181), * (p = 0.0321), and ** (p = 0.0043) (unpaired two-tailed t-test with Welch’s correction) (n=6). In panels a and c, SM refers to smooth muscle.
Fig. 3.
Fig. 3.. Dynamics of AT0 and unique cell trajectories in human alveolar epithelium
a. scVelo (left) and Slingshot (right) analysis on AT2, AT0, immature-AT1, AT1 and TRB-SCs from normal adult distal lung. Arrows indicate the predicted lineage trajectories. b. Schematic showing predicted model. c. Schematic depicting experimental workflow. d. Representative brightfield images show organoid morphology. Scale bar: 500 μm. e. Immunostaining for SCGB3A2 (green), SFTPB (red), and SFTPC (grey). Schematic in lower panel indicate the differences in cellular and morphological characteristics in organoids from different conditions. Scale bar: 20 μm. f. Quantification of SFTPC+ SCGB3A2+ (left), SFTPC SCGB3A2+ cells (middle) and SFTPC+ (right). **** (p < 0.0001), ** (p = 0.0016) in left graph (Dunnett’s multiple comparisons test). * (p = 0.05) in middle graph (Mann-Whitney test, one tailed), ** (p = 0.0042), *** (p = 0.0002), **** (p < 0.0001) in right graph (Dunnett’s multiple comparisons test). (n=3). g. Schematic depicting the experimental workflow (top). Immunostaining for SCGB3A2 (green) and SFTPC (red) on sorted cells. Scale bar: 50 μm. h. Quantification of AT0 cell purity after sorting. (n=3). i. Immunostaining for AGER (green) and HTI-56 (red) on AT0s cultured in ADM (top), immunostaining for SFTPC (green), SCGB3A2 (red) and SFTPB (grey) on AT0s cultured in AEM (middle), or EGF depleted AEM (bottom). Scale bar: 50 μm. j. Quantification of AGER+ HTI-56+ cells in AT0s cultured in ADM. (n=3). k. Relative mRNA expression of SFTPC and SCGB3A2 in AT0s cultured in AEM and EGF depleted AEM. (Dunnett’s multiple comparisons test) (n=3, for AT2 in AEM and AT0 in EGF withdrawal; n=4, AT0 in AEM). e, g and i: Insets indicate individual channels of regions marked in white boxes.
Fig. 4.
Fig. 4.. Revised lineage hierarchies in primate alveolar regeneration and disease.
a. UMAPs show epithelial cells from Cynomolgus monkey lungs published in Ma et al. 2021. Diff. Ciliated refers to differentiating ciliated cells. b. UMAPs show the expression of indicated genes in epithelial cell types. c. Representative immunofluorescence images from TRB of Rhesus macaque show the expression of SFTPB (green) and SCGB3A2 (grey). Scale bar 20 μm. d. SCGB3A2 (green), ACTA2 (red) and SFTPC (grey). Scale bar 50 μm. e. Experimental workflow of bleomycin injury in Rhesus macaque. f. Immunostaining for SFTPB (green), SFTPC (red) and SCGB3A2 (grey) in control and bleomycin injured Rhesus macaque lungs. Scale bar 100 μm. DAPI stains nuclei (blue). g. Quantification of AT0 in control and bleomycin treated Rhesus macaque in alveolar region of the lung. p-value: ** (p = 0.0162) (unpaired two-tailed t-test with Welch’s correction). h. Schematic indicating the human normal and disease samples used. i-k. Immunostaining for SCGB3A2 (green), SFTPB (red), and SFTPC (grey) in healthy human lung (i), acute lung injury (j) and IPF mild fibrotic and bronchiolized regions (k). Yellow arrows indicate SFTPC+SFTPB+SCGB3A2+ (AT0) cells. White arrows indicate SFTPCSFTPB+SCGB3A2+ (TRB-SCs). Scale bar: 50 and 100 μm. l. Quantification of AT0 in normal, acute lung injury and IPF human lungs. Only those images that had AT0s were selected for quantification. * (p = 0.0474), and **** (p < 0.0001) (Dunnett’s T3 multiple comparisons test) (n=3). m. Schematic showing revised cell lineages in healthy, ALI and IPF lung. In panels c, f, i, j and k, insets indicate individual colour channels of regions marked in white boxes.

References

    1. Verleden SE et al. Small airways pathology in idiopathic pulmonary fibrosis: a retrospective cohort study. Lancet Respir Med 8, 573–584 (2020). - PMC - PubMed
    1. Hogg JC, Macklem PT & Thurlbeck WM The resistance of small airways in normal and diseased human lungs. Aspen Emphysema Conf 10, 433–441 (1967). - PubMed
    1. Tanabe N et al. Micro-Computed Tomography Comparison of Preterminal Bronchioles in Centrilobular and Panlobular Emphysema. Am J Respir Crit Care Med 195, 630–638 (2017). - PMC - PubMed
    1. Weibel ER & Gomez DM Architecture of the human lung. Use of quantitative methods establishes fundamental relations between size and number of lung structures. Science 137, 577–585 (1962). - PubMed
    1. Kobayashi Y et al. Persistence of a regeneration-associated, transitional alveolar epithelial cell state in pulmonary fibrosis. Nat Cell Biol 22, 934–946 (2020). - PMC - PubMed