. 2022 Apr;604(7905):337-342.
doi: 10.1038/s41586-022-04536-0. Epub 2022 Mar 30.

Obesity alters pathology and treatment response in inflammatory disease

Affiliations

Obesity alters pathology and treatment response in inflammatory disease

Sagar P Bapat et al. Nature. 2022 Apr.

Abstract

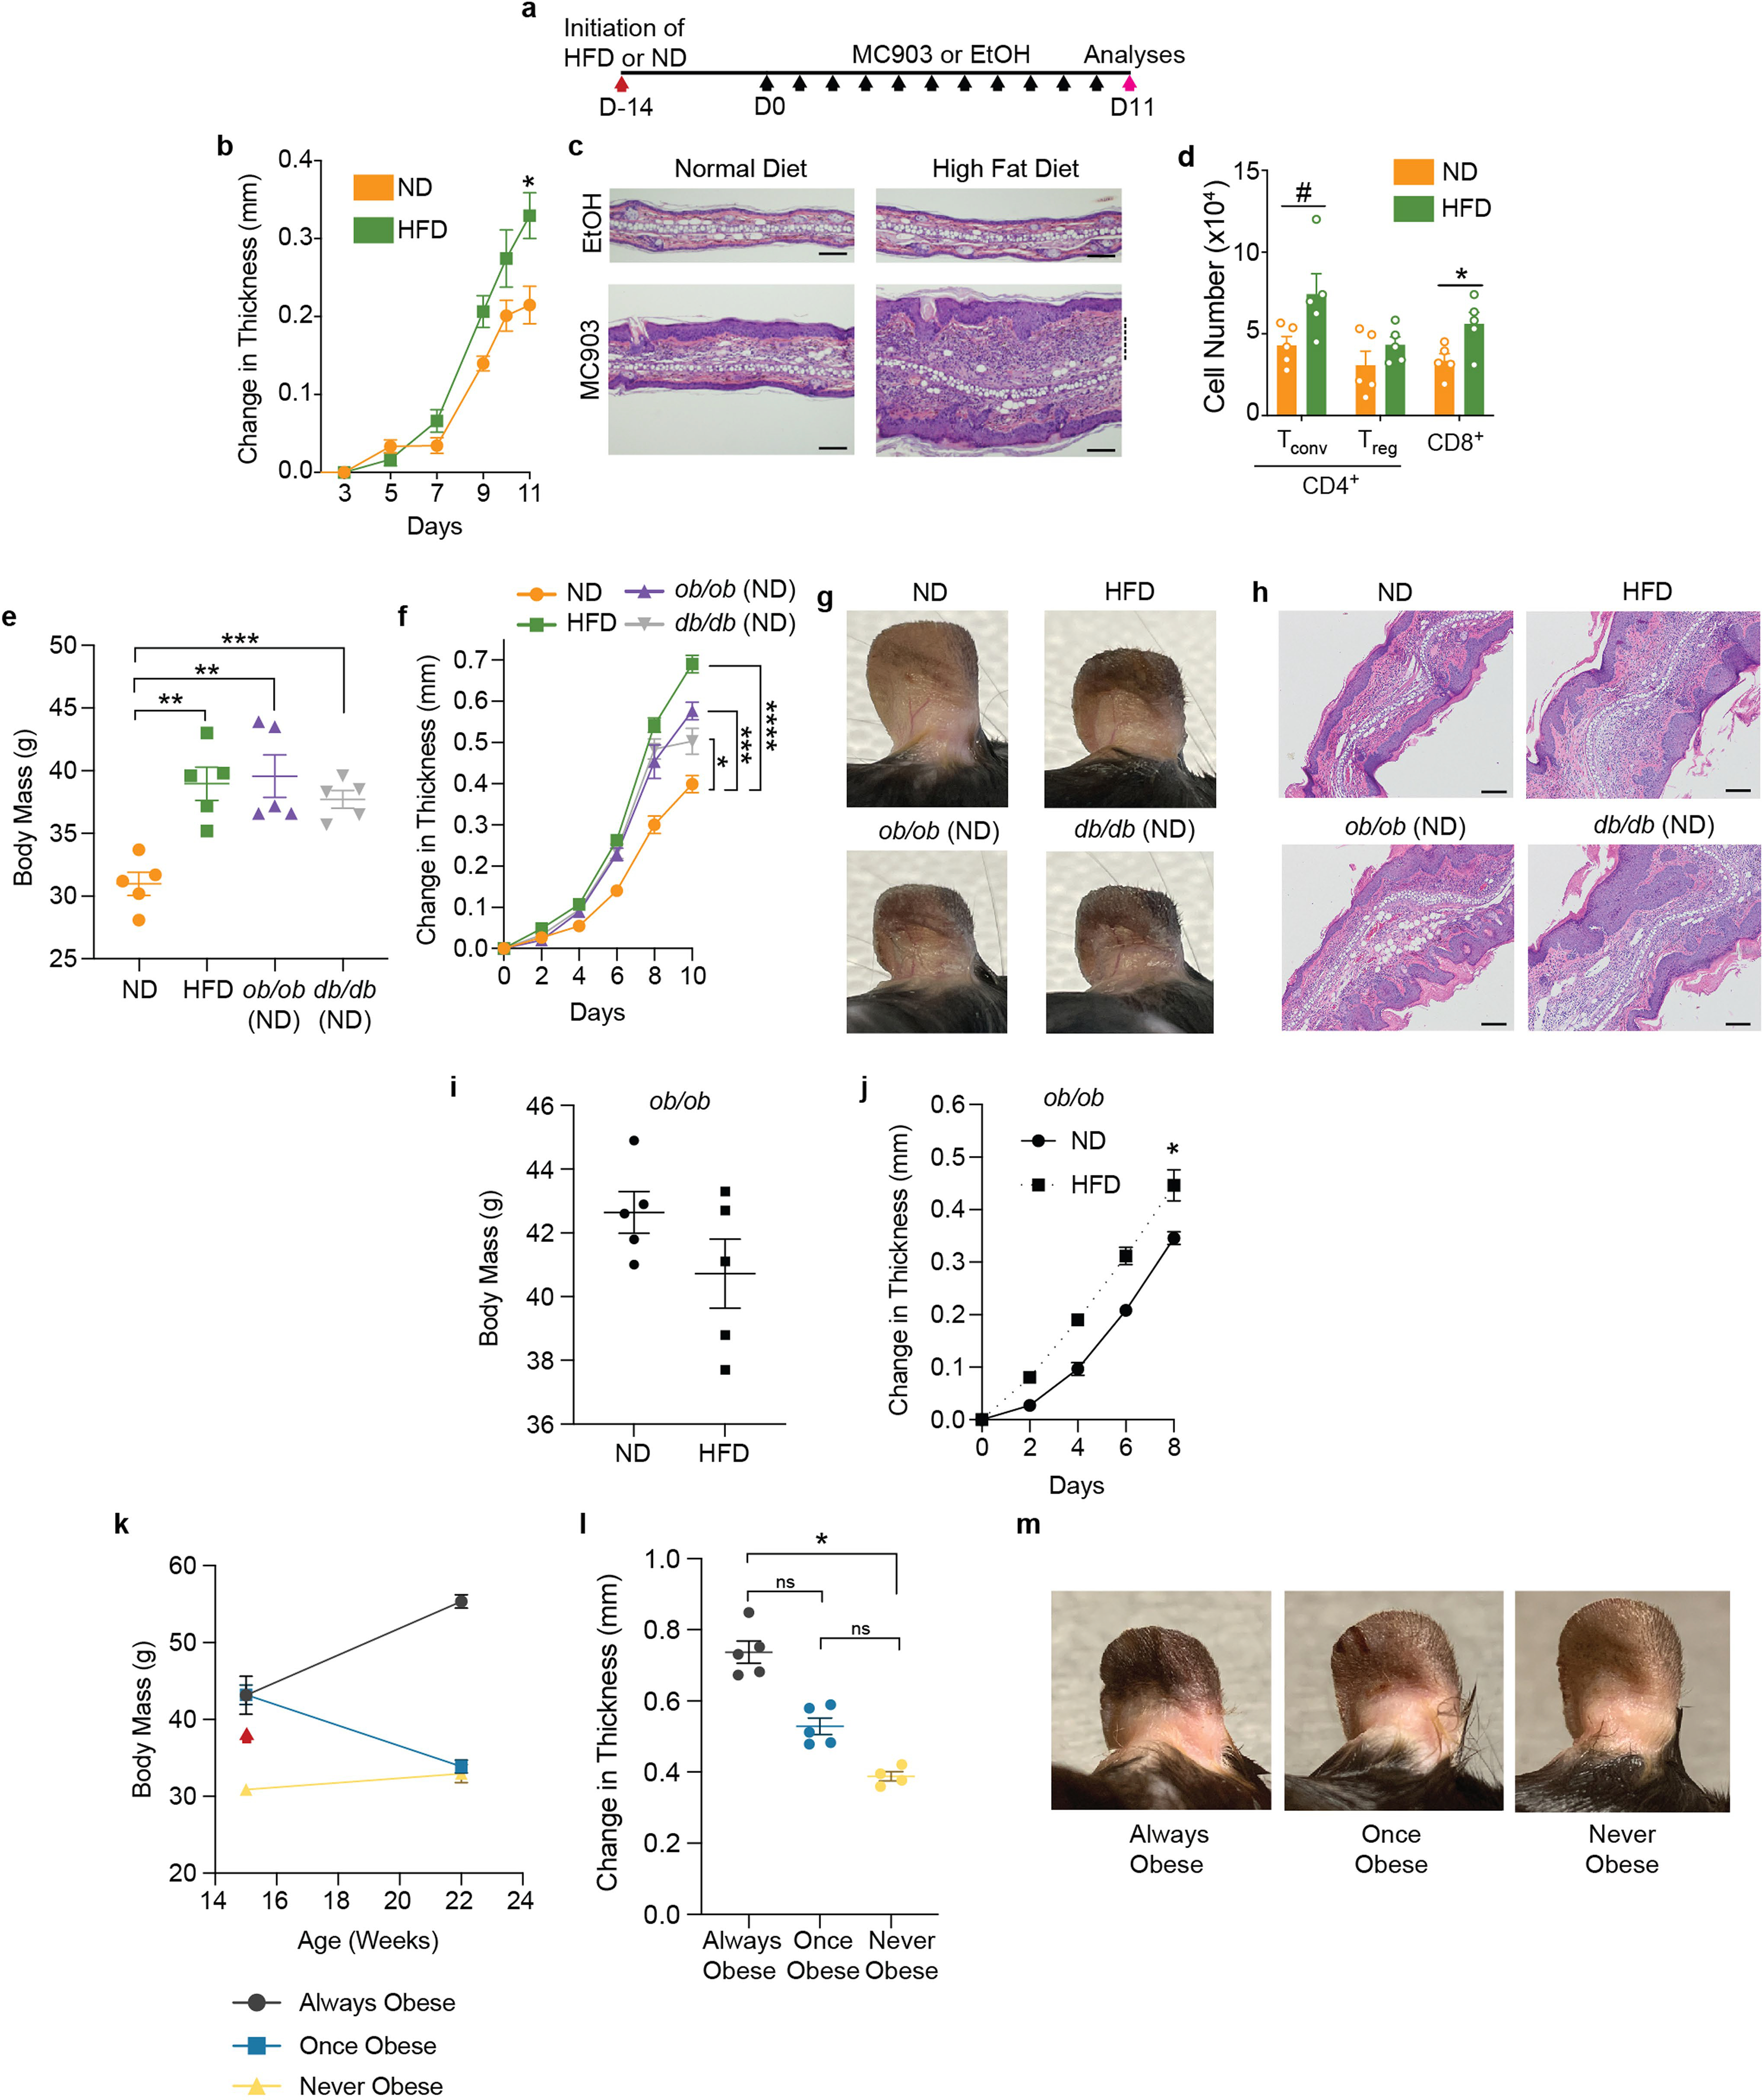
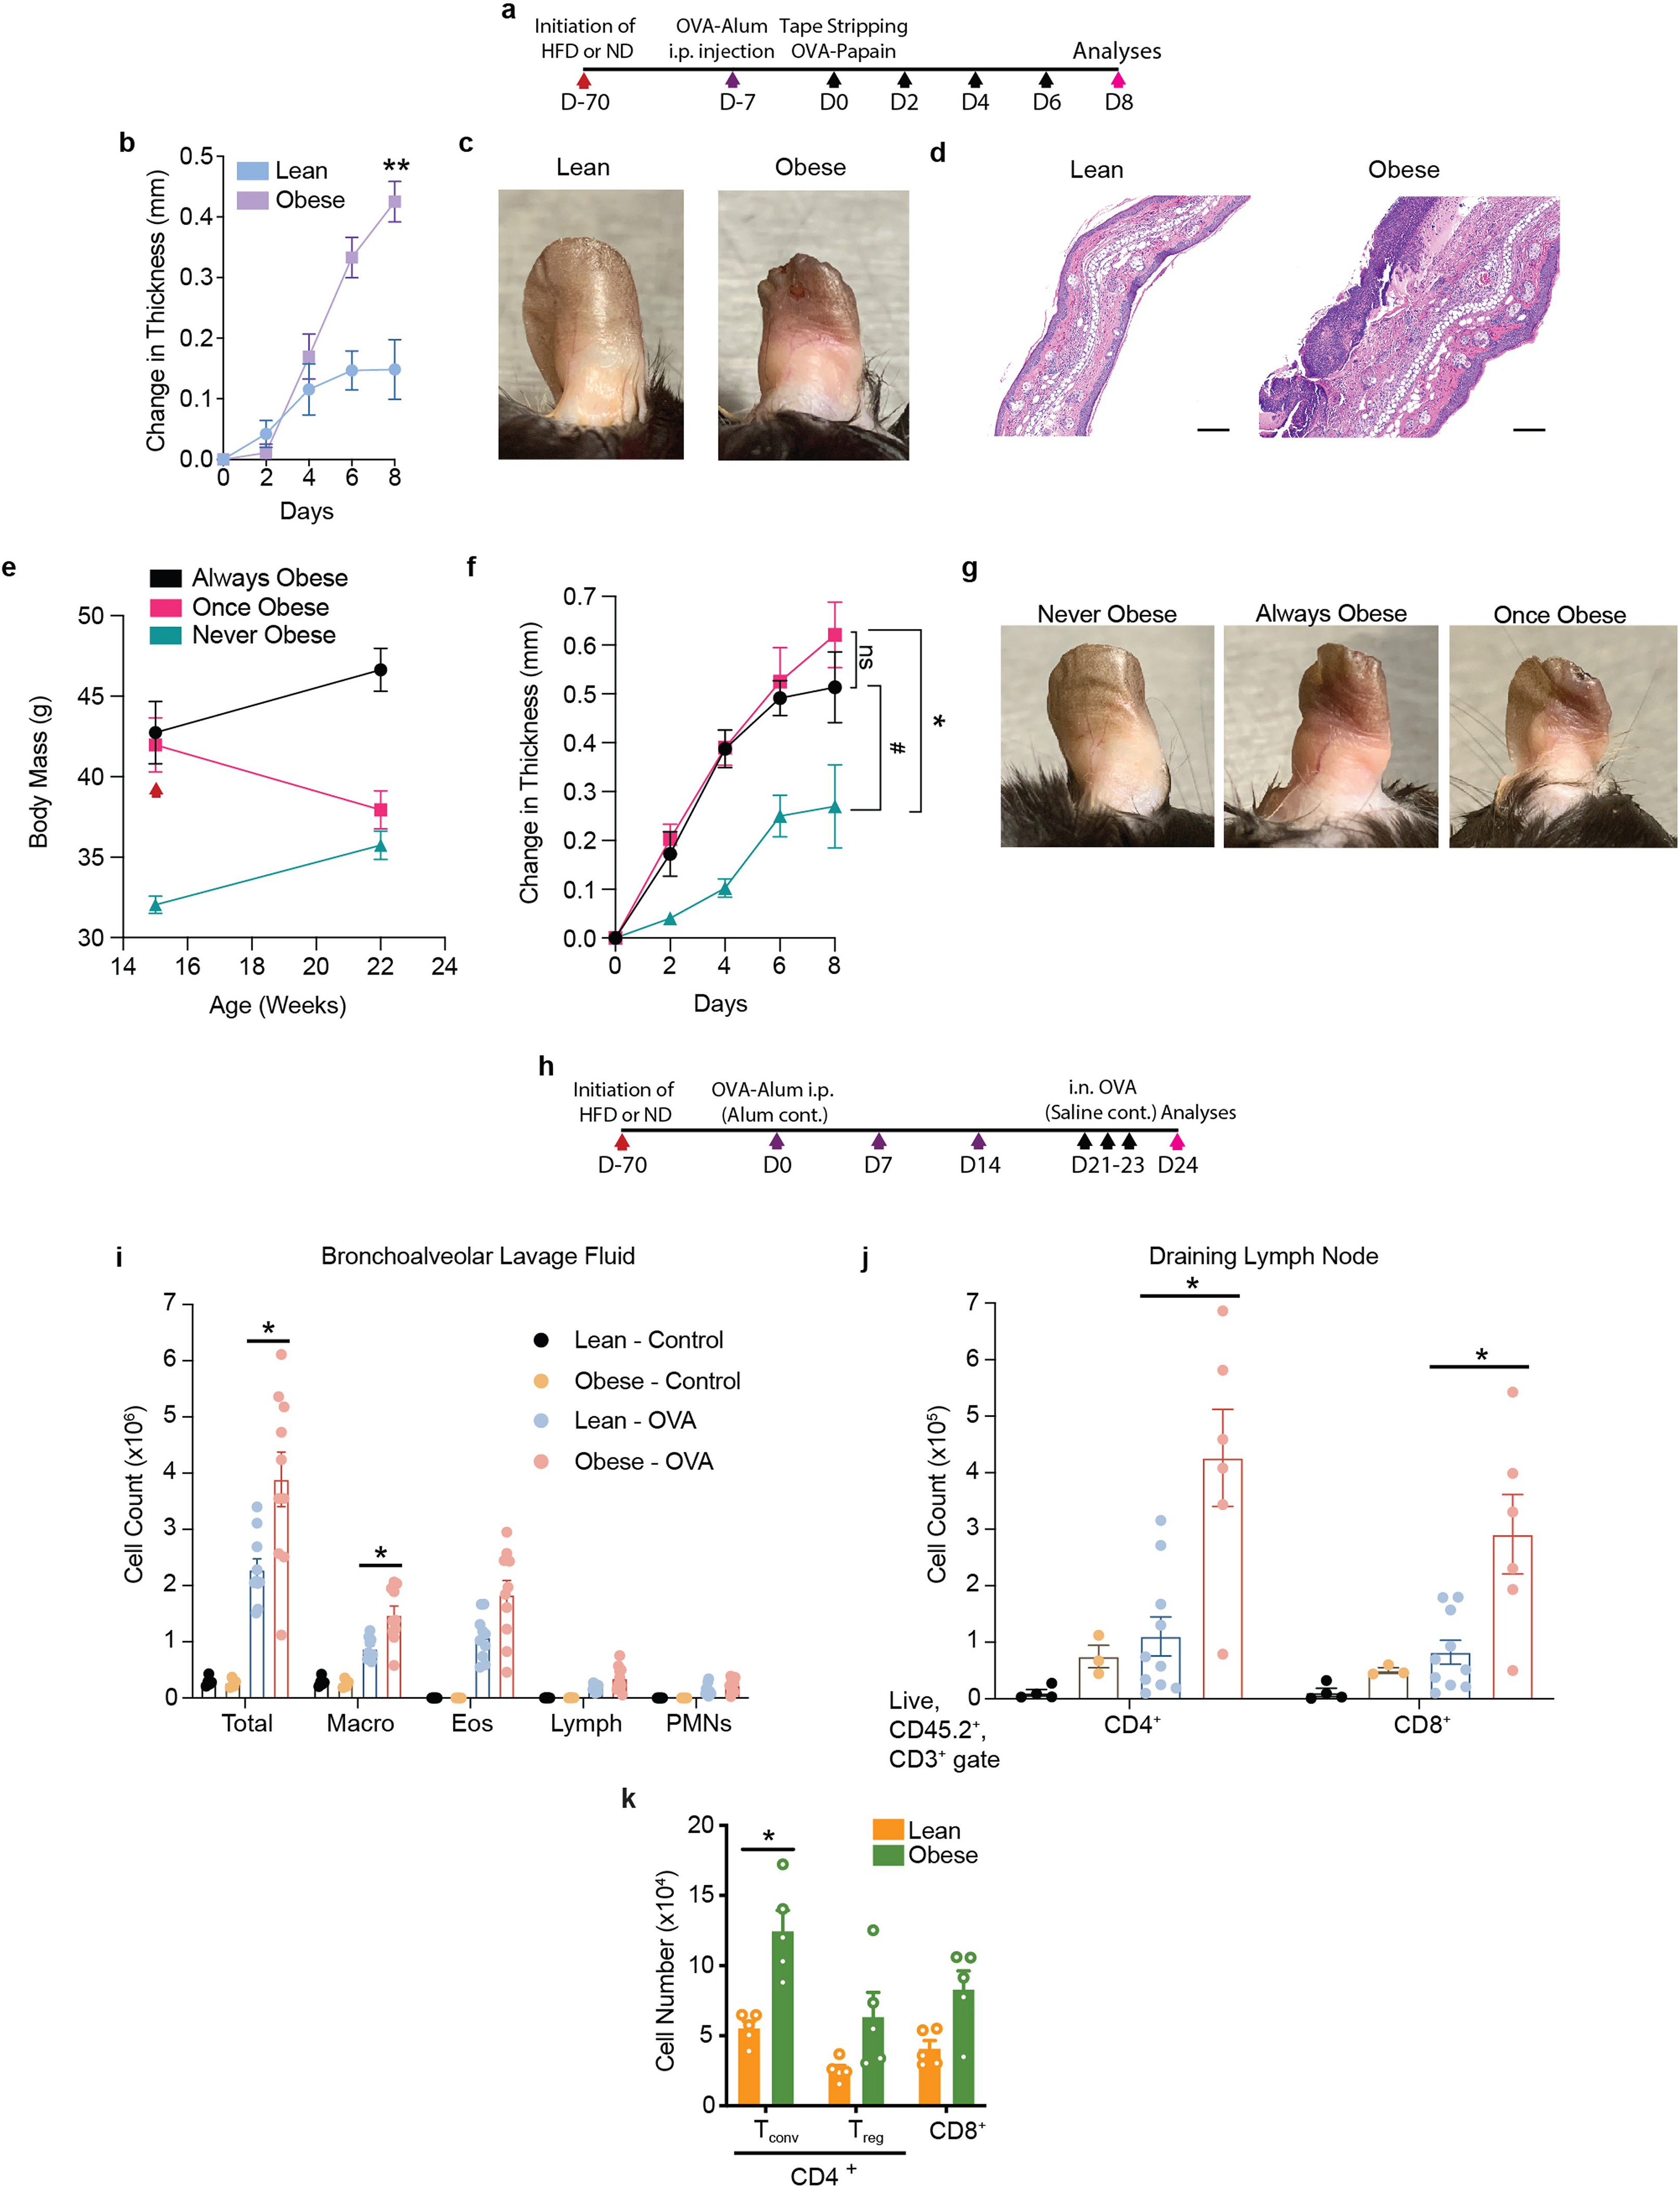
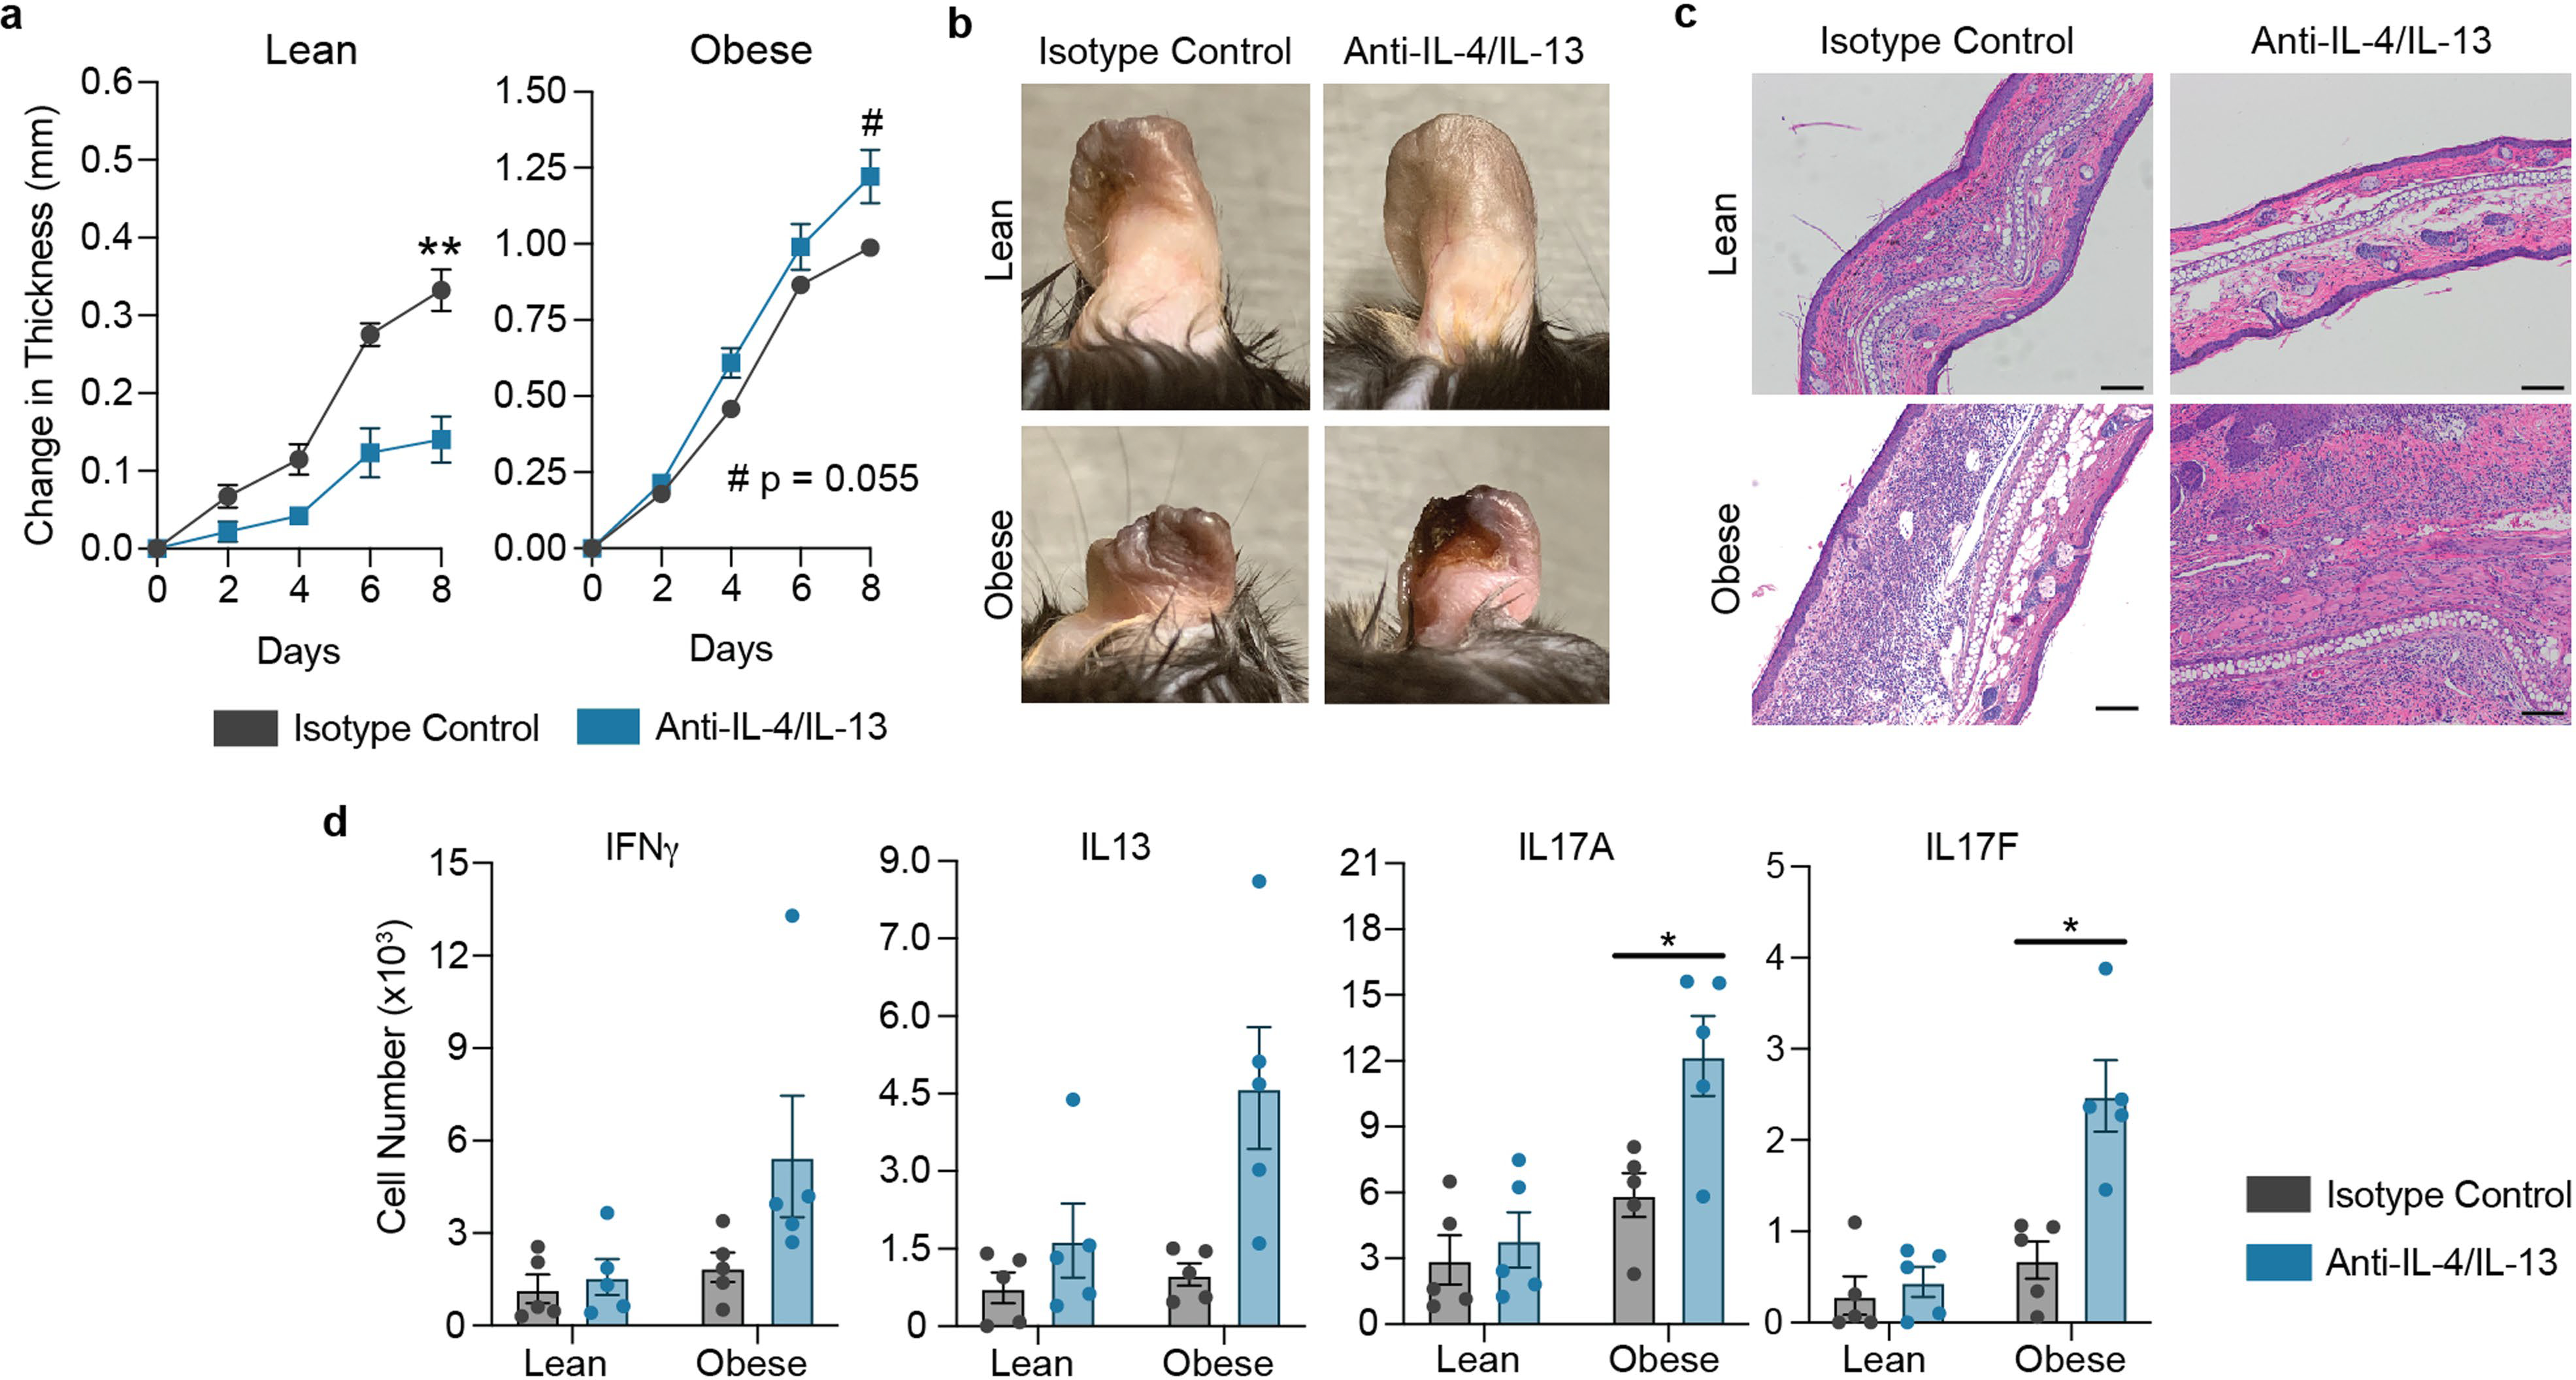
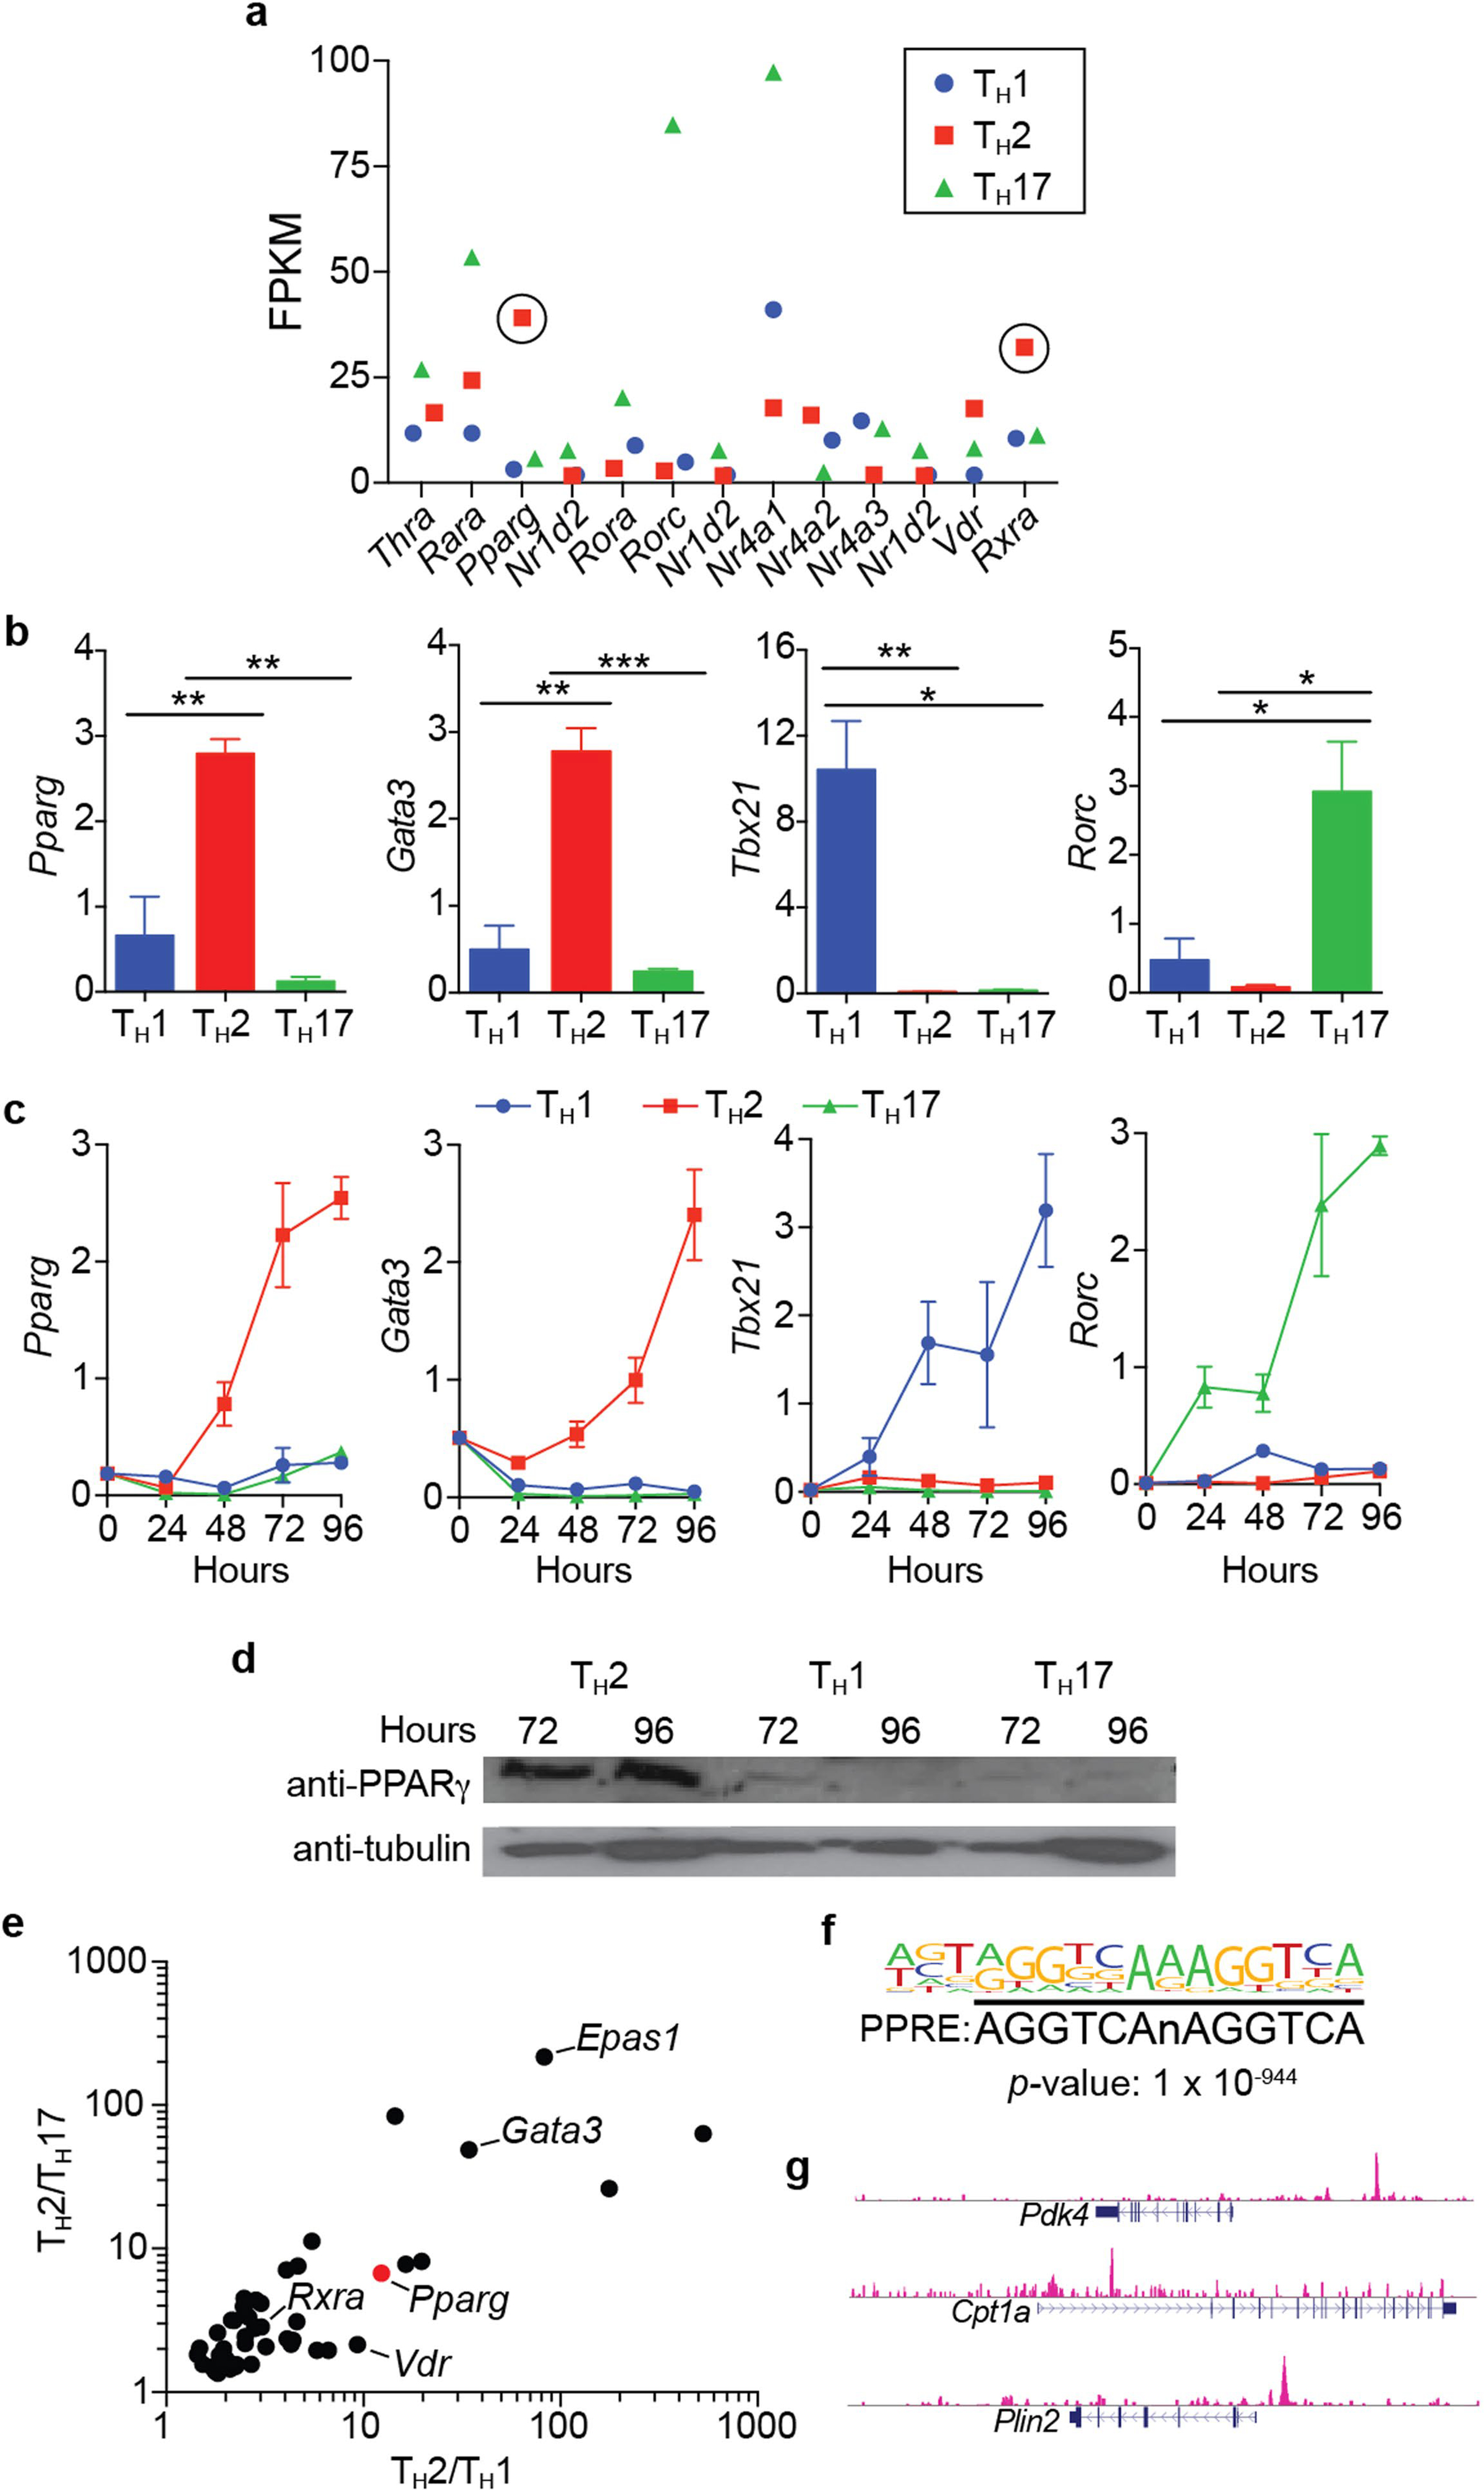
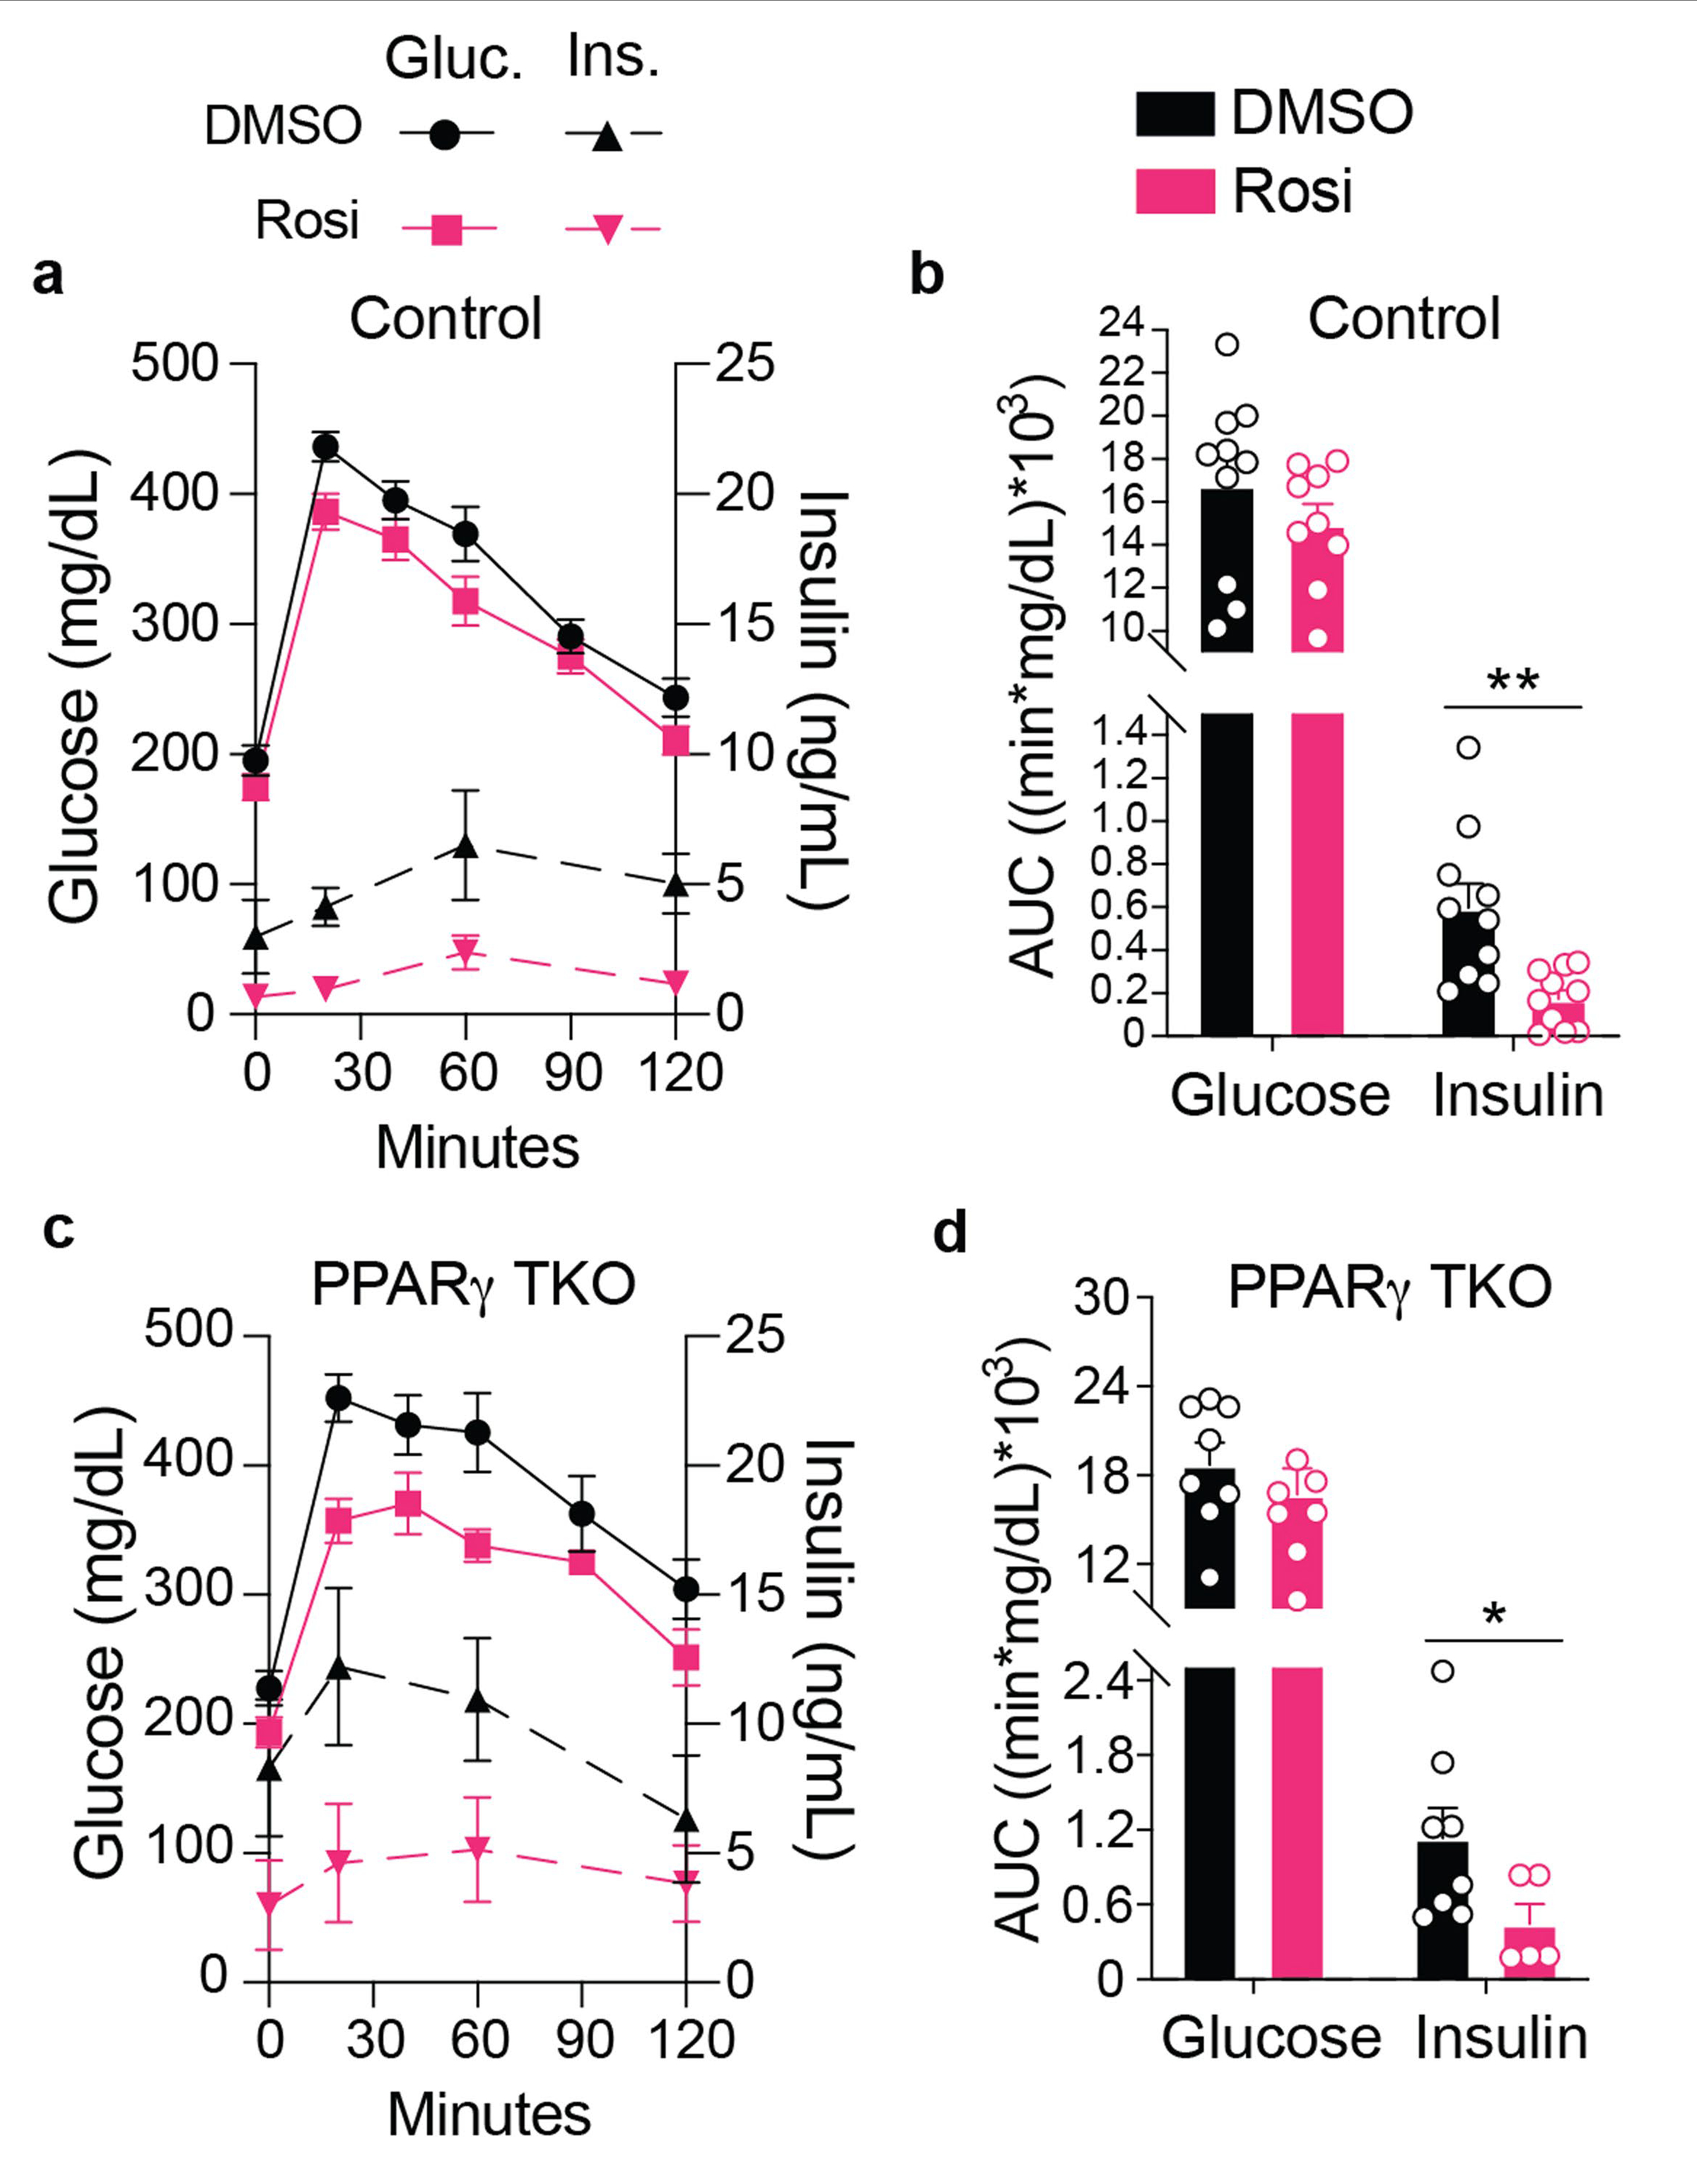
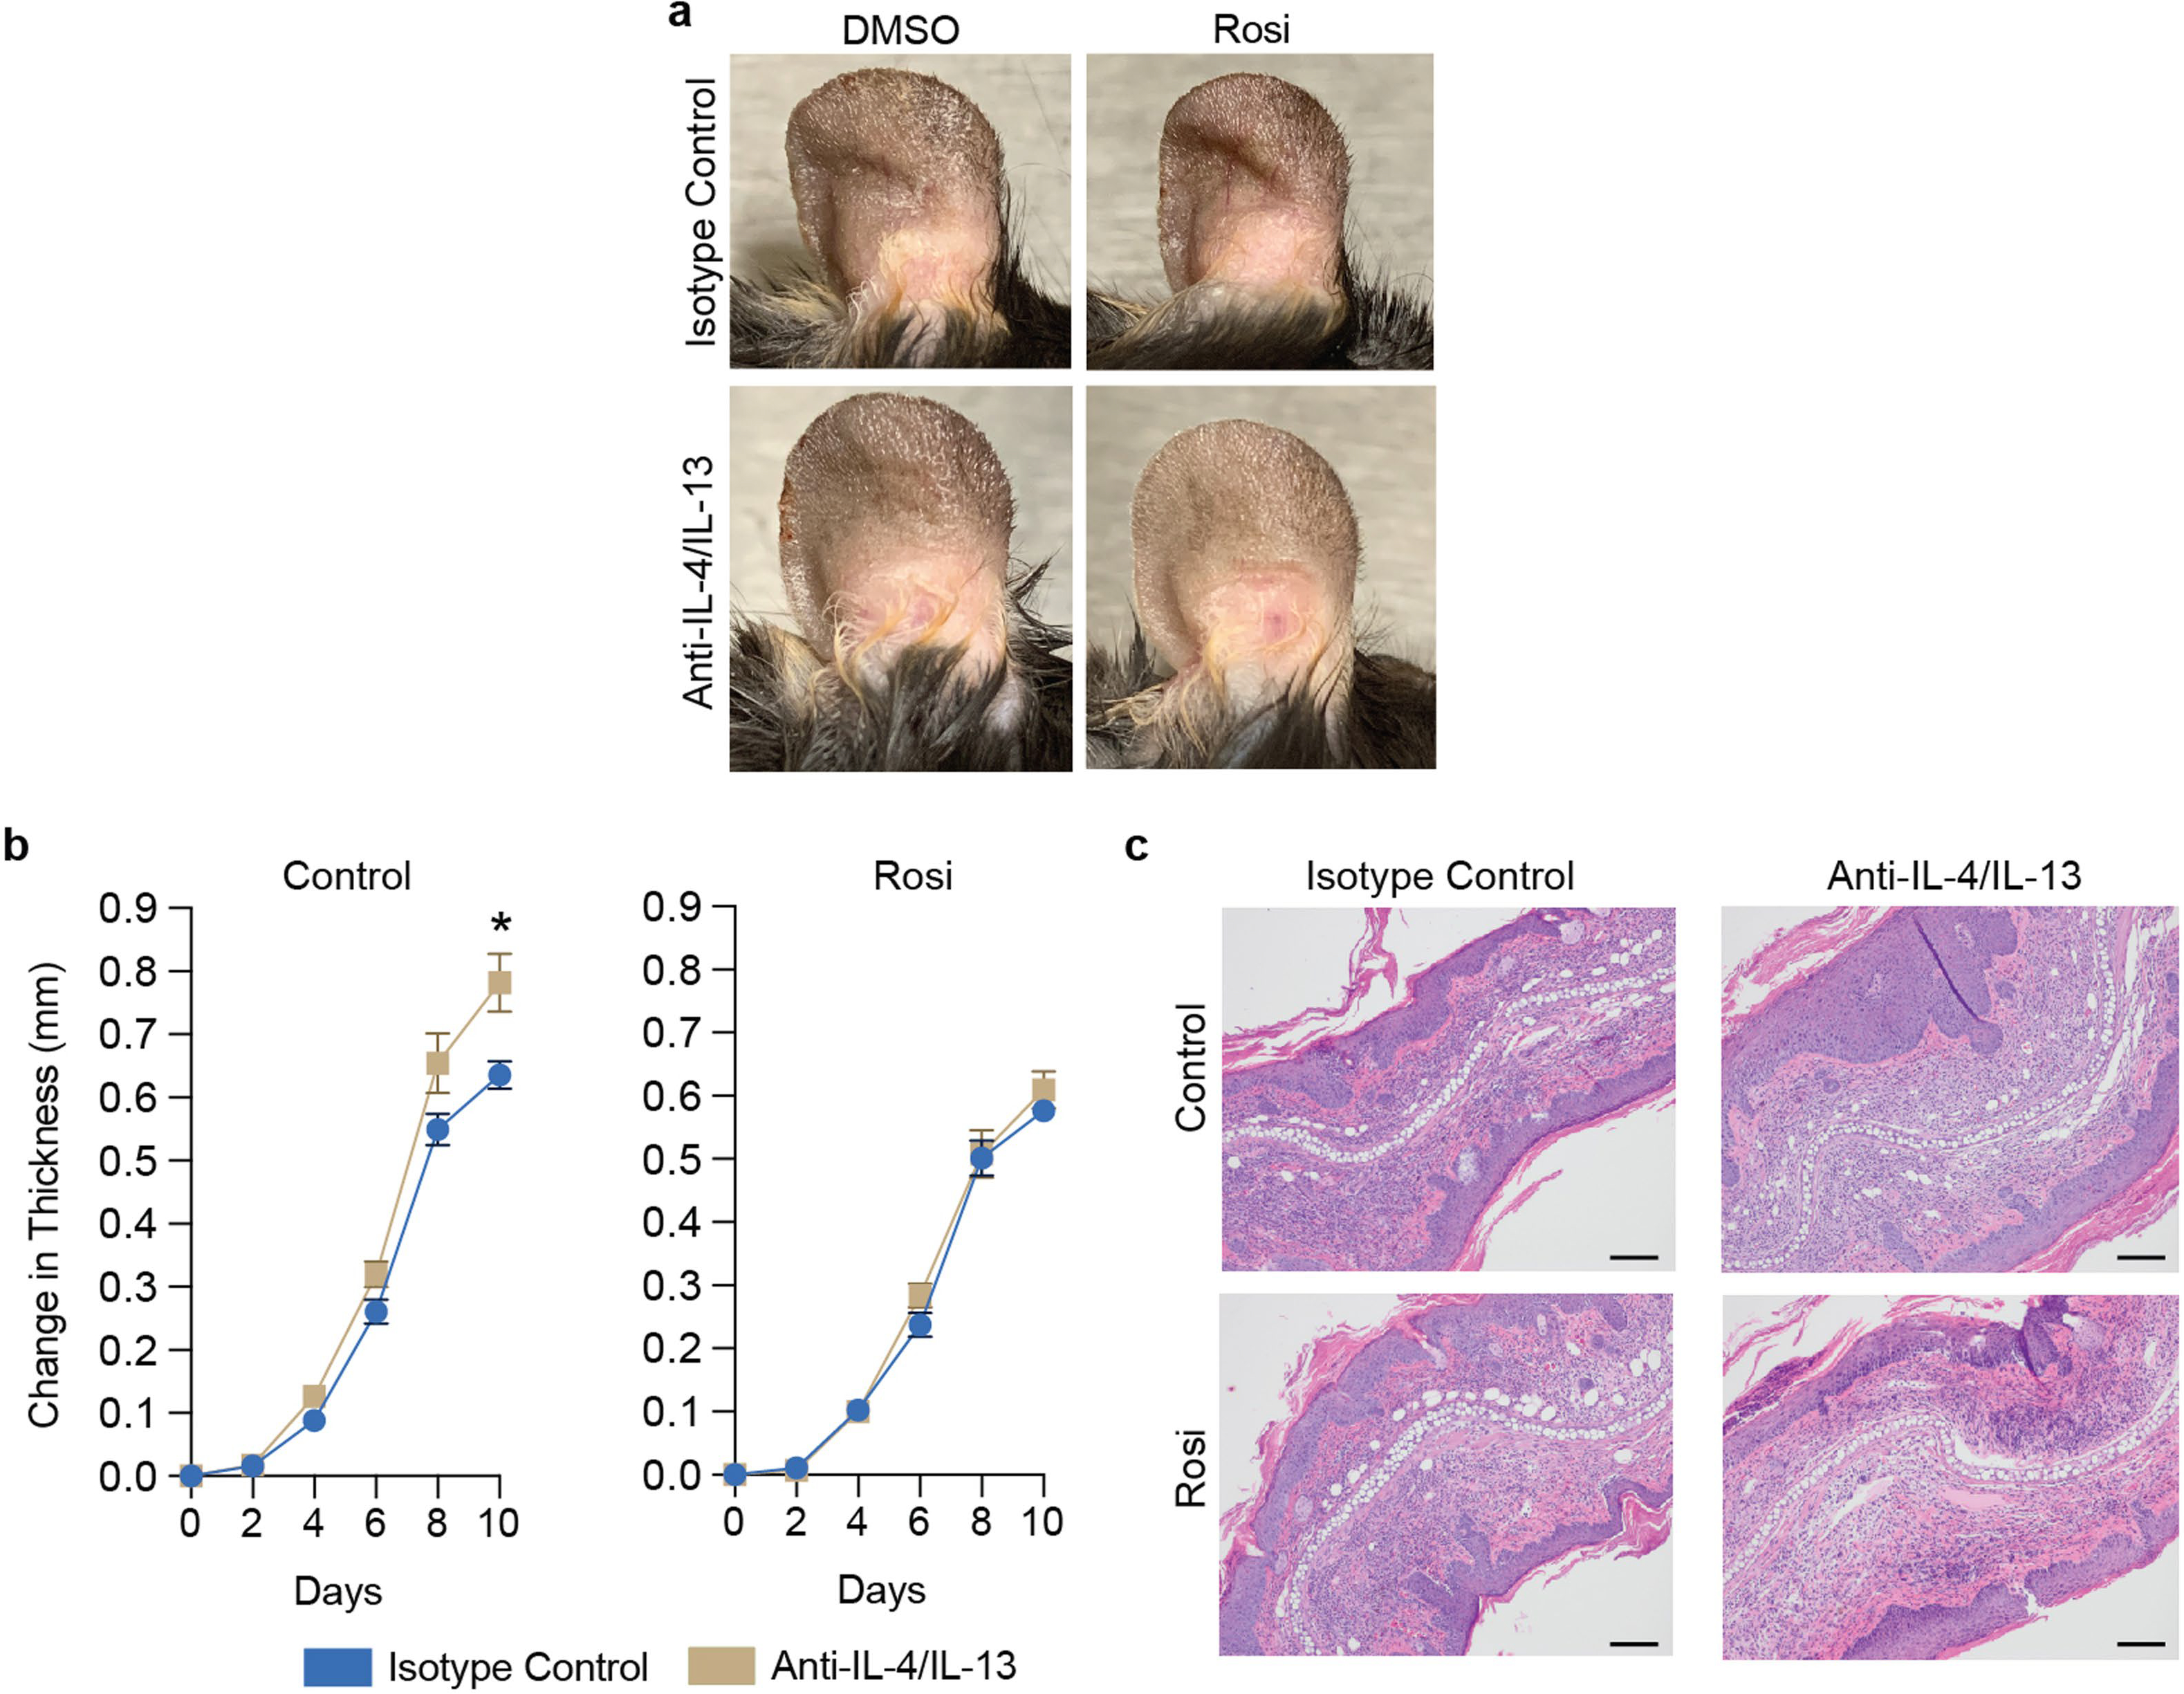
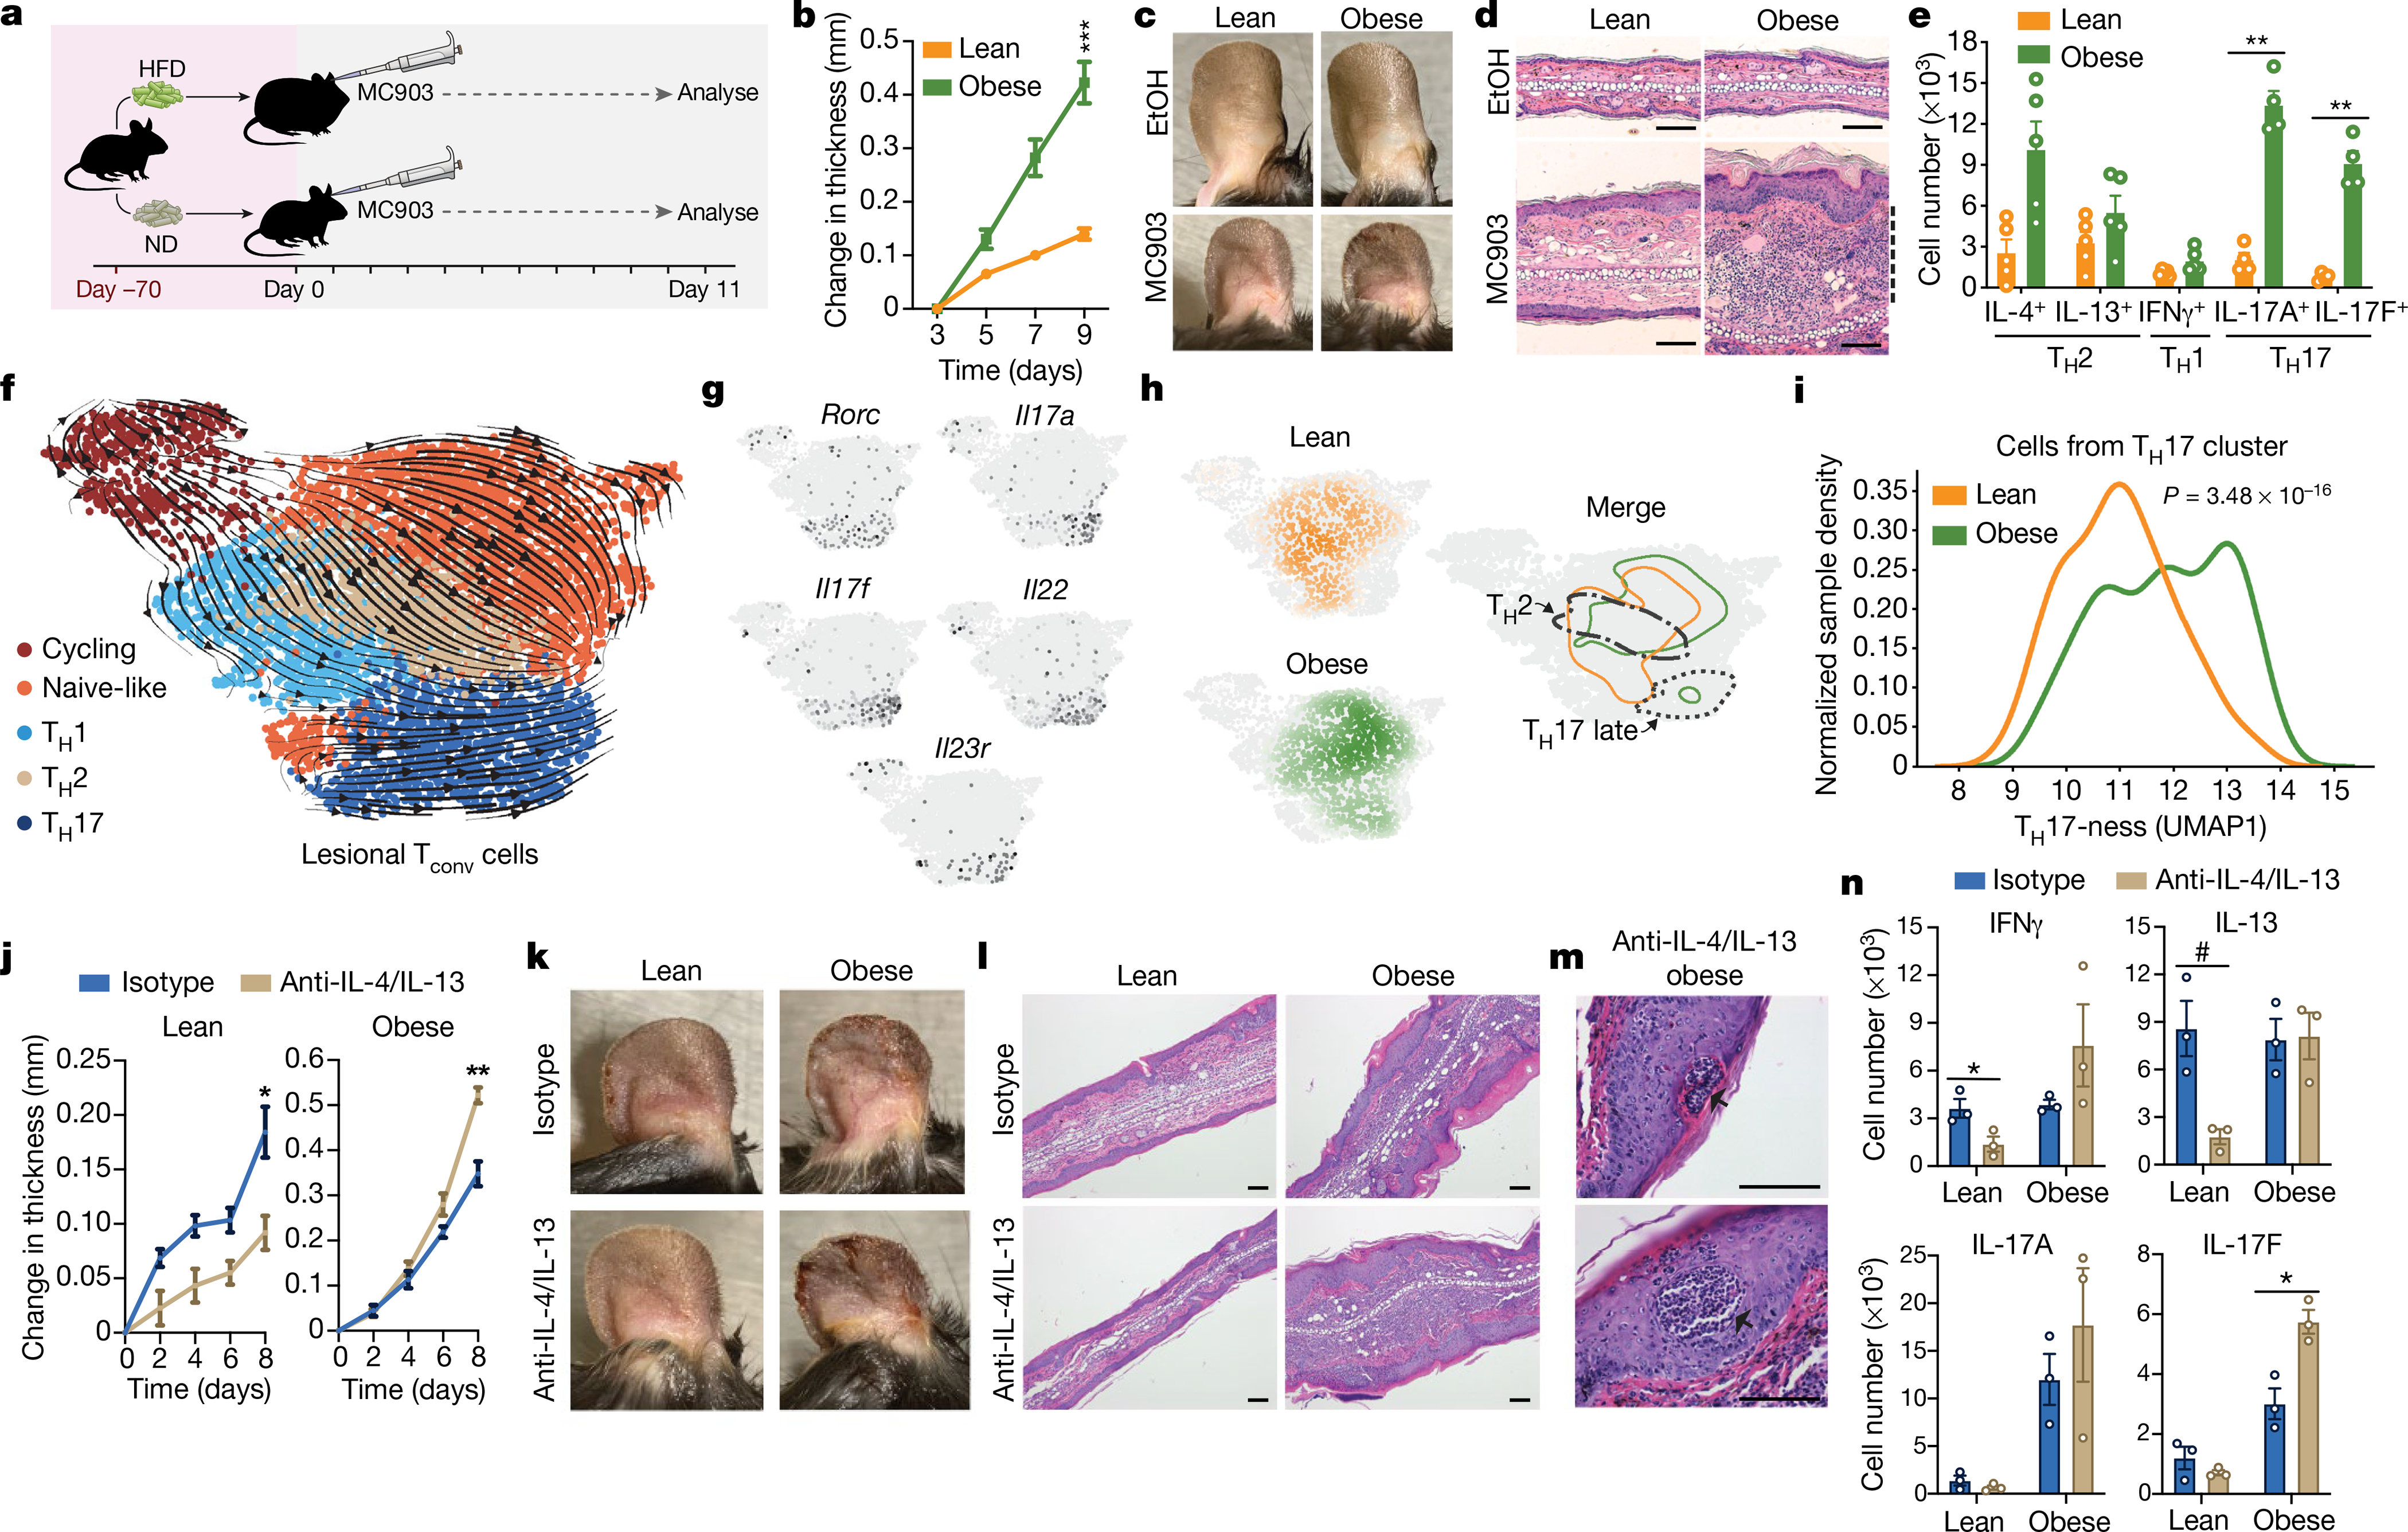
Decades of work have elucidated cytokine signalling and transcriptional pathways that control T cell differentiation and have led the way to targeted biologic therapies that are effective in a range of autoimmune, allergic and inflammatory diseases. Recent evidence indicates that obesity and metabolic disease can also influence the immune system1-7, although the mechanisms and effects on immunotherapy outcomes remain largely unknown. Here, using two models of atopic dermatitis, we show that lean and obese mice mount markedly different immune responses. Obesity converted the classical type 2 T helper (TH2)-predominant disease associated with atopic dermatitis to a more severe disease with prominent TH17 inflammation. We also observed divergent responses to biologic therapies targeting TH2 cytokines, which robustly protected lean mice but exacerbated disease in obese mice. Single-cell RNA sequencing coupled with genome-wide binding analyses revealed decreased activity of nuclear receptor peroxisome proliferator-activated receptor-γ (PPARγ) in TH2 cells from obese mice relative to lean mice. Conditional ablation of PPARγ in T cells revealed that PPARγ is required to focus the in vivo TH response towards a TH2-predominant state and prevent aberrant non-TH2 inflammation. Treatment of obese mice with a small-molecule PPARγ agonist limited development of TH17 pathology and unlocked therapeutic responsiveness to targeted anti-TH2 biologic therapies. These studies reveal the effects of obesity on immunological disease and suggest a precision medicine approach to target the immune dysregulation caused by obesity.


Figures

Extended Data Fig. 1 |
Extended Data Fig. 1 |. Diet-induced and monogenic models of obesity provoke increased disease severity upon MC903-AD challenge.
a, Scheme of MC903-induced atopic dermatitis disease model where animals are fed either high fat diet (HFD) or normal diet (ND) for two weeks before initiating MC903 treatments. Black arrows indicate MC903 or EtOH administration to ear. b, Change in ear thickness during AD development as in (a). c, Representative H&E ear histology, Day 11. Scale bars, 100 μm. Dashed line, leukocytic expansion of the dermis. d, Total Tconv, Treg, and CD8+ T cell number from whole ear, Day 11. e–h, Body mass (e), change in ear thickness during AD challenge (f), representative images at Day 10 of challenge (g), and representative H&E ear histology, Day 10 (h) of ND-fed mice, HFD-fed obese mice, or ND-fed ob/ob or db/db mice. i, j, Body mass at Day 0 (i) and change in ear thickness upon AD challenge (j) of 9 week old ob/ob mice fed ND or HFD for three weeks. k–m, Timeline of body mass (k), change in ear thickness (l), and representative images at Day 10 of challenge (m) of always obese (AO), once obese/now lean (OO), and never obese (NO) mice. Red arrow (k) indicates replacement of HFD with control lean diet for OO mice. n = 5 for all groups in (b–m) except 4 never obese (NO) mice were used in (l) and (m). Data are mean ± s.e.m. Peak values were tested with Welch’s t-test in (b, j) and ordinary one-way ANOVA with all groups tested against ND in (f). Ordinary one-way ANOVA with all groups tested against ND in (e) and with all groups tested against all groups in (l). P values were adjusted for multiple comparisons in (d) using Holm-Šídák method and Šídák’s multiple comparisons test in (e, f, l). ns – not significant, #P < 0.07, *P < 0.05, **P < 0.01, ***P < 0.001.
Extended Data Fig. 2 |
Extended Data Fig. 2 |. Increased inflammation in obesity in multiple models of allergic inflammatory disease.
a, Scheme of TOP (Tape stripping followed by Ova-Papain exposure)-induced atopic dermatitis disease model with either high fat diet (HFD) or normal diet (ND). Black arrows indicate tape stripping followed by OVA-papain administration. b, Change in ear thickness during AD development. c, Representative pictures of ears at Day 8 of challenge. d, Representative H&E ear histology, Day 8. Scale bars, 100 μm. e–g, Timeline of body mass (e), change in ear thickness (f), and representative pictures of ears (g) at Day 8 of challenge of always obese (AO), once obese/now lean (OO), and never obese (NO) mice. Red arrow (e) indicates replacement of HFD with control lean diet for OO mice. h, Scheme of OVA-Alum allergic asthma model. Purple arrows indicate OVA-Alum i.p. injection. i, Total immune cell numbers from bronchoalveolar lavage fluid upon sacrifice on Day 24. j, Total CD4+ and CD8+ T cell numbers from lung draining lymph node, Day 24. k, Total Tconv, Treg, and CD8+ T cell numbers from whole ear of lean and obese mice challenged with MC903-AD, Day 11. Asthma model was conducted once. Macro, macrophages; Eos, eosinophils; Lymph, lymphocytes; PMNs, polymorphonuclear leukocytes; n = 5 for (b–g); n = 10 for Lean-OVA and Obese-OVA, n = 5 for Lean-Control, and n = 4 for Obese-Control in (i); n = 10 for Lean-OVA, n = 6 for Obese-OVA, n = 4 for Lean-Control, and n = 3 for Obese-Control in (j). n = 5 for all groups in (k). Data are mean ± s.e.m. Peak values were tested with Welch’s t-test in (b) and ordinary one-way ANOVA with preselected followup tests as indicated in (f). P values were adjusted for multiple comparisons using Šídák’s multiple comparisons test in (f) and the Holm-Šídák method in (i–k) where only the Lean-OVA and Obese-OVA groups were compared in (i, j). #P < 0.12, *P < 0.05, **P < 0.01.
Extended Data Fig. 3 |
Extended Data Fig. 3 |. Selected flow cytometry gating strategies for evaluating cytokine-competence.
a, b, Different T cell subsets were identified through the use of distinct antibody cocktails. Here, using obese mice, we show how the skin-resident/infiltrating hematopoietic cells can be analyzed by flow cytometry to identify CD4+ T cells (a) and selected cytokine competence of those CD4+ T cells (b).
Extended Data Fig. 4 |
Extended Data Fig. 4 |. Multiple models of allergic inflammatory disease demonstrate increased TH17-driven inflammation in obesity.
a, b, Total IL4+, IL13+, IFNγ+, IL17A+, and IL17F+ cell numbers of CD4+ T cells from whole ear (a) or ear skin draining lymph node (b) at Day 8 of mice challenged with TOP-induced AD. c, Total IL4+, IL13+, IFNγ+, IL17A+, and IL17F+ cell numbers of CD4+ T cells from bronchoalveolar lavage fluid upon sacrifice on Day 24 of mice challenged with experimental allergic airway disease (ovalbumin sensitization and challenge). n = 5 for all groups in (a, b); n = 10 for Lean and n = 6 for Obese in (c). Mann-Whitney tests were conducted in (a, b) and P values were adjusted for multiple comparisons using Holm-Šídák method in (a–c). *P < 0.05, **P < 0.01.
Extended Data Fig. 5 |
Extended Data Fig. 5 |. Evidence of increased TH17 inflammation or decreased TH2-associated pathology in obese patients with allergic disease.
a, Scheme demonstrating workflow and integration of human AD patient serum proteomics with cytokine-induced gene expression studies of human keratinocytes (KCs) correlated with patient BMI. b, c, Scatterplots depicting the serum protein levels from AD patients of genes specifically induced by IL17A (b) or IL13 (c) in human KCs versus patient BMI. n = 59 moderate-to-severe AD patients for scatter plots in (b, c). r and p values for scatter plots in (b, c) were obtained using Spearman rank correlation. d, e, Sputum eosinophil percentage from human severe asthma patients across a range of BMIs, on their first clinical baseline visit as part of SARP, represented irrespective of age of onset (d) or broken down by age of onset (e). n = 272, 211, and 95 for patients with BMI <30, 30–40, and >40, respectively in (d). n = 113, 83, and 52 (pediatric-onset patients) and n = 70, 66, and 23 (adult-onset patients) with BMI <30, 30–40, and >40, respectively in (e). P value from test of linear trend (post-test after statistically significant ordinary one-way ANOVA) in (d, e).
Extended Data Fig. 6 |
Extended Data Fig. 6 |. Gene heatmaps from scRNA-Seq data used in Fig. 1 and Fig. 2.
Heatmaps of transcription factors (a), cytokines (b), and markers of activation, quiescence, and memory (c) overlain on UMAP plot from Fig. 1f to assign names to clusters. Grayscale indicates gene expression, with the highest expressing cells in black.
Extended Data Fig. 7 |
Extended Data Fig. 7 |. Blocking lymphocyte egress from secondary lymphoid organs during AD challenge reduces disease severity and TH17 inflammation in the lesions of obese mice.
a, Change in ear thickness during development of MC903-AD of lean or obese mice treated with vehicle (water) or FTY720. b, Representative pictures of ears at Day 10 of challenge. c, Total IL4+, IL13+, IFNγ+, IL17A+, and IL17F+ CD4+ T cell numbers assessed by flow cytometry from draining lymph node of lean (left) and obese (right) mice treated with vehicle or FTY720. n = 5 for all groups in (ac). Data are mean ± s.e.m. Peak values were tested with Welch’s t-test in (a). P values were adjusted for multiple comparisons using Holm-Šídák method in (c). *P < 0.05, **P < 0.01, ****P < 0.0001.
Extended Data Fig. 8 |
Extended Data Fig. 8 |. Targeted anti-IL-4/IL-13 blockade is ineffective in obese mice challenged with TOP.
a, Change in ear thickness during development of TOP-AD of lean or obese mice treated with anti-IL-4/IL-13 or IgG1 isotype control. b, Representative pictures of ears at Day 8 of challenge. c, Representative images of H&E-stained histology of ears at Day 8. Scale bars, 100 μm. d, Lesional number of CD4+ T cells with the indicated cytokine competence as measured by intracellular cytokine staining via flow cytometry from lean and obese mice treated with anti-IL-4/IL-13 or isotype control. n = 5 for all groups in (ad). Data are mean ± s.e.m. Peak values were tested with Welch’s t-test in (a). P values were adjusted for multiple comparisons using Holm-Šídák method in (d). #P < 0.06, *P < 0.05, **P < 0.01.
Extended Data Fig. 9 |
Extended Data Fig. 9 |. PPARγ is differentially expressed in in vitro differentiated TH2 cells.
a, Fragments per kilobase of transcripts per million mapped reads (FPKM) values of nuclear hormone receptor (NHR) superfamily genes differentially expressed in in vitro differentiated TH1, TH2, and TH17 cells. NHR genes that are differentially expressed in TH2 cells are encircled (cells pooled from 4 mice before inducing differentiation in triplicate, same data set used in (e)). b, c, Relative expression (using Hprt expression as housekeeping gene) of indicated genes in in vitro differentiated TH1, TH2, and TH17 cells (cells pooled from 4 mice before inducing differentiation in triplicate). b, Gene expression determined at Hour 120 post induction of differentiation. c, Time course of gene expression from Hours 0–96 post induction of differentiation. d, Western blot of PPARγ and tubulin at Hours 72 and 96 in in vitro differentiated TH1, TH2, and TH17 cells (cells pooled from 3 mice before inducing differentiation). e, FPKM values of genes that are differentially expressed in TH2 cells and involved in transcriptional regulation. Position of Pparg is marked with a red dot. f, Top scoring DNA motif of PPARγ ChIP-Seq peaks in in vitro differentiated TH2 cells via de novo analysis (cells pooled from 4 mice). g, Visualization of PPARγ ChIP-Seq experiment utilizing UCSC genome browser across following genomic loci: Pdk4, Cpt1a, Plin2. Data are mean ± s.e.m. *P < 0.05, **P < 0.01, ***P < 0.001, Student’s t-test.
Extended Data Fig. 10 |
Extended Data Fig. 10 |. PPARγ TKO mice display neither overt systemic inflammation nor altered T cell development, and PPARγ Treg cKO (Foxp3Cre Ppargfl/fl) mice do not display an overt difference in AD severity relative to controls.
ae, Comparison between PPARγ TKO and Control (Cd4Cre Pparg+/+) mice. a, Picture of control and PPARγ TKO spleens and lymph nodes. b, Spleen mass. c, d, Treg (c) and activated Tconv (d) cell frequency in spleen and LN. e, Developing T cell subsets in thymus. f–j, Comparison between PPARγ Treg cKO and Control (Foxp3Cre Pparg+/+) mice. f, Change in ear thickness during development of atopic dermatitis. g, Representative images of H&E-stained histology of ears at Day 10. Scale bars, 100μm. Dashed line, leukocytic expansion of the dermis. h, Absolute lesional leukocyte number assessed by flow cytometry at Day 13. i, Lesional activated Tconv cells as a percentage of Tconv cells assessed by flow cytometry at Day 13. j, Lesional Treg cells as a percentage of CD4+ T cells assessed by flow cytometry at Day 13. Control, Foxp3Cre Pparg+/+. LN, lymph node. For (ae), n = 3 mice per group. For (fi), n = 4 mice per group. Data are mean ± s.e.m.
Extended Data Fig. 11 |
Extended Data Fig. 11 |. PPARγ in T cells is dispensable for the insulin-sensitizing action of TZDs.
a–d, Glucose tolerance tests (GTTs) of Control (a, b) or PPARγ TKO (c, d) mice that have been treated with or without Rosi. Glucose and insulin traces (a, c) and corresponding area under the curves (AUCs) (b, d) are presented. Control, Cd4Cre; PPARγ TKO, Cd4Cre Ppargfl/fl; For (a–d) n = 10 for all Control mice with exception in (a, b) where n = 9 for the glucose measurements for mice treated with Rosi; n = 8 for PPARγ TKO mice with exception in (c, d) where n = 7 for the PPARγ TKO Rosi-treated mice that were sampled for the serum glucose measurements and n = 5 for the PPARγ TKO Rosi-treated mice that were sampled for the serum insulin measurements. Gluc., Glucose; Ins., Insulin; Rosi, Rosiglitazone. This experiment was conducted once with a weight- and age-matched cohort. Data are mean ± s.e.m. *P < 0.05, **P < 0.01.
Extended Data Fig. 12 |
Extended Data Fig. 12 |. Gene heatmaps from scRNA-Seq data used in Fig. 3.
Heatmaps of transcription factors (a), cytokines/cytokine receptors (b), and markers of activation, quiescence, and memory (c) overlain on UMAP plot from Fig. 3c to assign names to clusters. Grayscale indicates gene expression, with the highest expressing cells in black.
Extended Data Fig. 13 |
Extended Data Fig. 13 |. Pictures of the ears of obese DMSO- or Rosi-HFD fed mice challenged with AD while treated with anti-IL-4/IL-13 or IgG1 isotype control (a), and initiating Rosi treatment at AD-challenge onset prevents worsening of disease upon treatment with anti-IL-4/IL-13 in obese mice (b, c).
a, Representative pictures of ears at Day 10. b, Change in ear thickness during development of MC903-AD of obese mice treated with Rosi or DMSO with anti-IL-4/IL-13 or IgG1 isotype control. c, Representative images of H&E-stained histology of ears at Day 10. Scale bars, 100 μm. n = 5 for all groups in (a–c). Rosi-mixed HFD introduced four weeks prior to initiation of experimental AD in (a) and upon AD-challenge onset in (b, c). Data are mean ± s.e.m. Peak values were tested with Welch’s t-test in (b). *P < 0.05.
Fig. 1 |
Fig. 1 |. Obesity converts a classically TH2-driven inflammatory disease to a more severe TH17-driven disease that is worsened upon anti-TH2 antibody treatment.
a, MC903-induced AD model with either high-fat diet (HFD) or normal diet (ND). b, Change in ear thickness during development of AD. c, Representative images of ears of mice treated with ethanol (EtOH) or MC903, on day 11. d, Representative haematoxylin and eosin (H&E) ear histology on day 11. Dashed line, leukocytic expansion of dermis. Original magnification, ×200. e, Total cytokine-competent CD4+ T cell numbers from whole ear, on day 11. f, RNA velocity visualization of transcriptional trajectories in UMAP space with Leiden clustering of scRNA-seq of Tconv cells from AD-challenged ears on day 10. g, Gene-expression heat maps of Rorc, Il17a, Il17f, Il22 and Il23r, with the highest-expressing cells in black. h, Distribution of Tconv cells in UMAP space (from f) from lean and obese mice after AD challenge. Contour lines are set at identical thresholds. Borders of TH2 and TH17 late clusters are outlined. TH17 late contour outlines cells in the top 50th percentile of Il17a, Il17f, Il22 and Il23r expression. i, TH17 cluster continuous probability density curves, scaled by sample. jl, Change in ear thickness (j), with representative images from day 10 (k) and representative H&E ear histology from day 11 (l; original magnification, ×100) of lean or obese mice with induced AD treated with anti-IL-4/IL-13 or isotype control. m, Representative epidermal pustules (arrows) in obese mice with induced AD and treated with anti-IL-4/IL-13. Original magnification, ×400. n, Number of lesional CD4+ T cells with indicated cytokine competence (detected by intracellular cytokine staining and flow cytometry) from lean and obese mice treated with anti-IL-4/IL-13 or isotype control. Scale bars, 100 μm. n = 5 (be) except n = 4 for IL-17A and IL-17F CD4+ T cell measurements (e); n = 1 (pooled from 5 mice per group) for scRNA-seq in fi; n = 5 (jm) except n = 4 for lean mice with isotype control (j); n = 3 (pooled from 1–2 mice per sample) (n). Data are mean ± s.e.m. Peak values were tested with Welch’s t-test (b, j). P values adjusted for multiple comparisons using Holm-Šídák method (e); Mann–Whitney U test (i). #P < 0.06, *P < 0.05, **P < 0.01, ***P < 0.001.
Fig. 2 |
Fig. 2 |. Mice with T cell-specific PPARγ deficiency largely phenocopy obese PPARγ-sufficient mice upon experimental AD challenge.
a, Heat map of PPARγ activity (ChIP–seq cistrome expression) using UMAP visualization of scRNA-seq data of Tconv cells from Fig. 1f. b, Violin plots representing T cell-PPARγ cistrome expression across distinct Leiden clusters from lean and obese mice. c, Change in ear thickness during MC903-induced AD development of PPARγ-TKO or control mice. d, Representative images of ears of mice as in c on day 10. e, Representative H&E ear histology of mice as in c on day 10. Dashed line highlights leukocytic expansion of dermis. Original magnification, ×200. f, Total cytokine-competent CD4+ T cell numbers assessed by flow cytometry from whole ear of mice as described in c on day 11. g, Distribution of Tconv cells in UMAP space (Fig. 1f) from lean control and PPARγ-TKO mice after AD challenge. Contour lines are set at identical thresholds. Borders of TH2 and TH17 late clusters are outlined. TH17 late contour defined as in Fig 1h. h, TH17 cluster continuous probability density curves of control and PPARγ TKO, scaled by sample. ik, Change in ear thickness (i), representative images from day 10 (j), and representative H&E ear histology from day 11 (k; original magnification, ×100), of control or PPARγ-TKO mice with induced AD and treated with anti-IL-4/IL-13 or isotype control. l, Representative epidermal pustules (arrows) of PPARγ-TKO mice with induced AD and treated with anti-IL-4/IL-13. Original magnification, ×400. m, Lesional CD4+ T cell numbers with indicated cytokine competence. n, Proposed PPARγ function as focusing factor for TH2 responses in vivo. Control, Cd4cre; PPARγ TKO, Cd4crePpargfl/fl. Scale bars, 100 μm. n = 5 (ce); n = 7 (f) except n = 4 for IL-17A/F-competent T cells; n = 1 (pooled from 5 mice per group) for scRNA-seq (g, h), run with Fig. 1 samples (batch 1 in Methods, ‘scRNA-seq’); n = 6 (il) except n = 5 for PPARγ TKO + isotype control; n = 3 (each pooled from 2 mice) (m). Data are mean ± s.e.m. Only peak values were tested with Welch’s t-test in (c, i). P values adjusted for multiple comparisons using Holm-Šídák method (f). Mann–Whitney U test (h). #P < 0.07, *P < 0.05, ***P < 0.001.
Fig. 3 |
Fig. 3 |. Treatment with PPARγ agonist reduces TH17-inflammation and restores efficacy of anti-TH2 antibody treatment in obese mice challenged with AD.
a, Change in ear thickness during AD development of obese PPARγ-TKO or control mice treated with rosiglitazone (Rosi) or DMSO. b, Representative H&E ear histology on day 10 of cells treated as in a. c, RNA velocity visualization of transcriptional trajectories in UMAP space with Leiden clustering of scRNA-seq data of Tconv cells from AD-challenged ears on day 10. d, Distribution of Tconv cells in UMAP space from c isolated from obese control or PPARγ-TKO mice treated with DMSO or rosiglitazone after AD challenge. Contour lines set at identical thresholds. Borders of TH2 and TH17 clusters are outlined. e, TH17 cluster continuous probability density curves of obese control and PPARγ-TKO mice fed with DMSO or rosiglitazone-mixed HFD, scaled by sample. f, g, Violin plots representing T cell-PPARγ activity (ChIP–seq cistrome expression) in TH2 (f) and TH17 (g) cells from obese control or PPARγ-TKO mice treated with rosiglitazone or DMSO, using scRNA-seq data from c. h, i, Change in ear thickness (h) and representative H&E ear histology on day 10 (i; original magnification, ×100) of obese mice with induced AD fed DMSO- or rosiglitazone-mixed HFD, treated with anti-IL-4/IL-13 or isotype control. j, Representative epidermal pustules (arrows) of obese Bl6 mice with induced AD fed with DMSO-mixed HFD and treated with anti-IL-4/IL-13. Original magnification, ×400). k, Lesional CD4+ T cell number with indicated cytokine competence. l, Model of PPARγ agonists as immunopathological modifiers in obese mice to enable targeted therapy against a classically TH2-driven disease. Control, Cd4cre (except for scRNA-seq, when wild-type Bl6 mice co-housed with the PPARγ-TKO mice were used). Scale bars, 100 μm. Rosiglitazone-mixed HFD was introduced four weeks before initiation of experimental AD (hk). n = 5 (a, b, hj); n = 1 (pooled from 5 mice per group) for scRNA-seq (d, e); n = 3 (each pooled from 2 mice) (k). Data are mean ± s.e.m. Peak values tested with Welch’s t-test (a, h). Mann–Whitney U test (e). *P < 0.05, **P < 0.01, ***P < 0.001, ****P < 0.0001.

Comment in

References

    1. Buck MD, Sowell RT, Kaech SM & Pearce EL Metabolic instruction of immunity. Cell 169, 570–586 (2017). - PMC - PubMed
    1. Man K, Kutyavin VI & Chawla A Tissue immunometabolism: development, physiology, and pathobiology. Cell Metab. 25, 11–26 (2017). - PMC - PubMed
    1. Geltink RIK, Kyle RL & Pearce EL Unraveling the complex interplay between T cell metabolism and function. Annu. Rev. Immunol 36, 461–488 (2018). - PMC - PubMed
    1. Michelet X et al. Metabolic reprogramming of natural killer cells in obesity limits antitumor responses. Nat. Immunol 19, 1330–1640 (2018). - PubMed
    1. Nicholas DA et al. Fatty acid metabolites combine with reduced β-oxidation to activate Th17 inflammation in human type 2 diabetes. Cell Metab. 30, 447–461.e5 (2019). - PMC - PubMed