. 2022 Apr 29;145(3):925-938.
doi: 10.1093/brain/awab376.

Profiling PI3K-AKT-MTOR variants in focal brain malformations reveals new insights for diagnostic care

Affiliations

Profiling PI3K-AKT-MTOR variants in focal brain malformations reveals new insights for diagnostic care

Filomena Pirozzi et al. Brain. .

Erratum in

Abstract

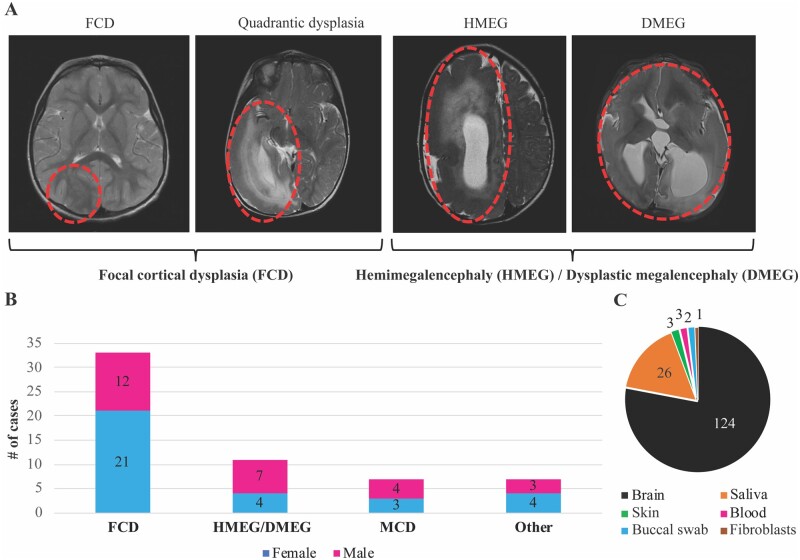
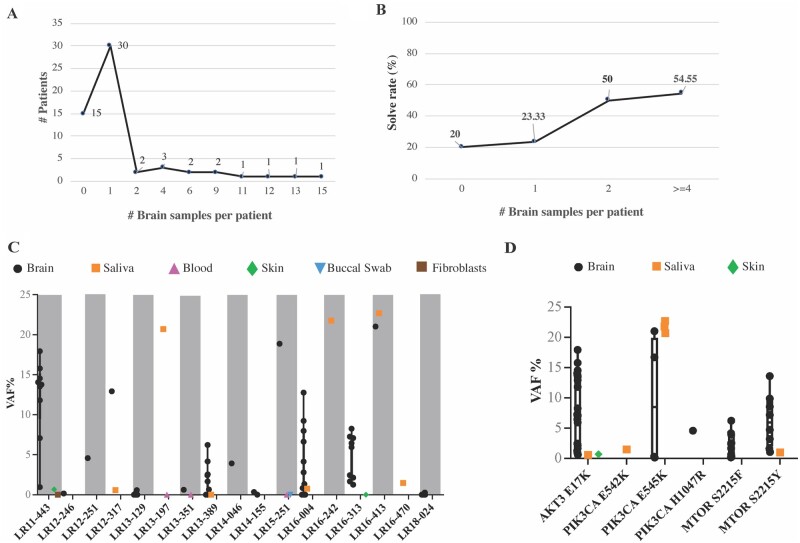
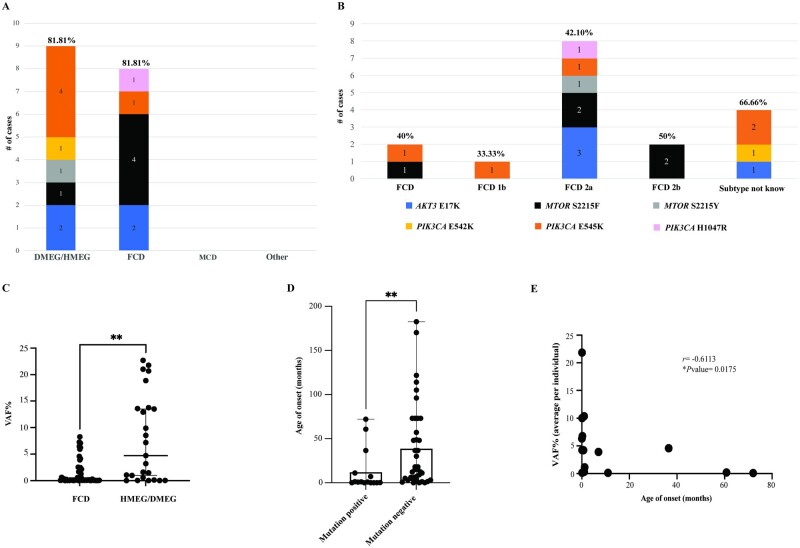
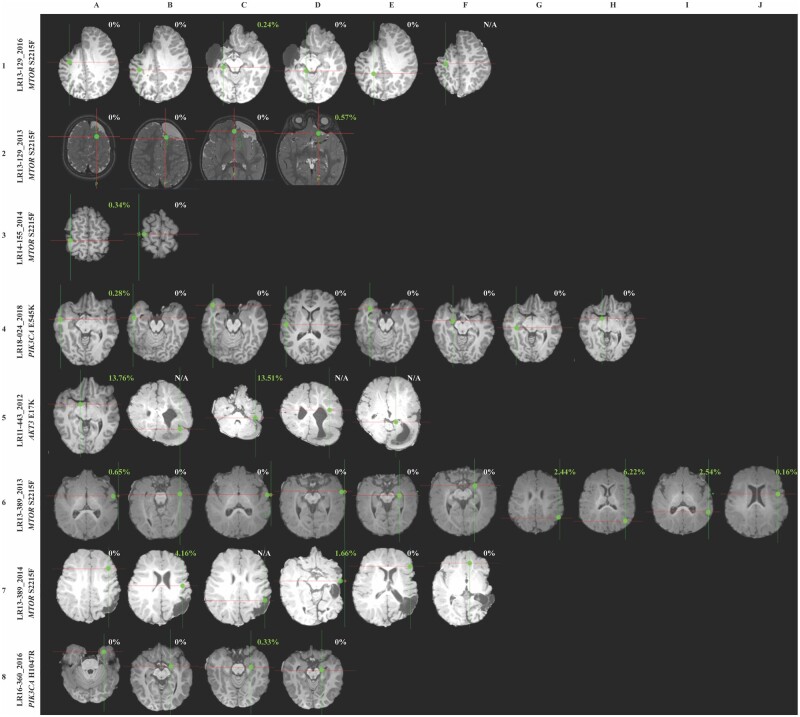
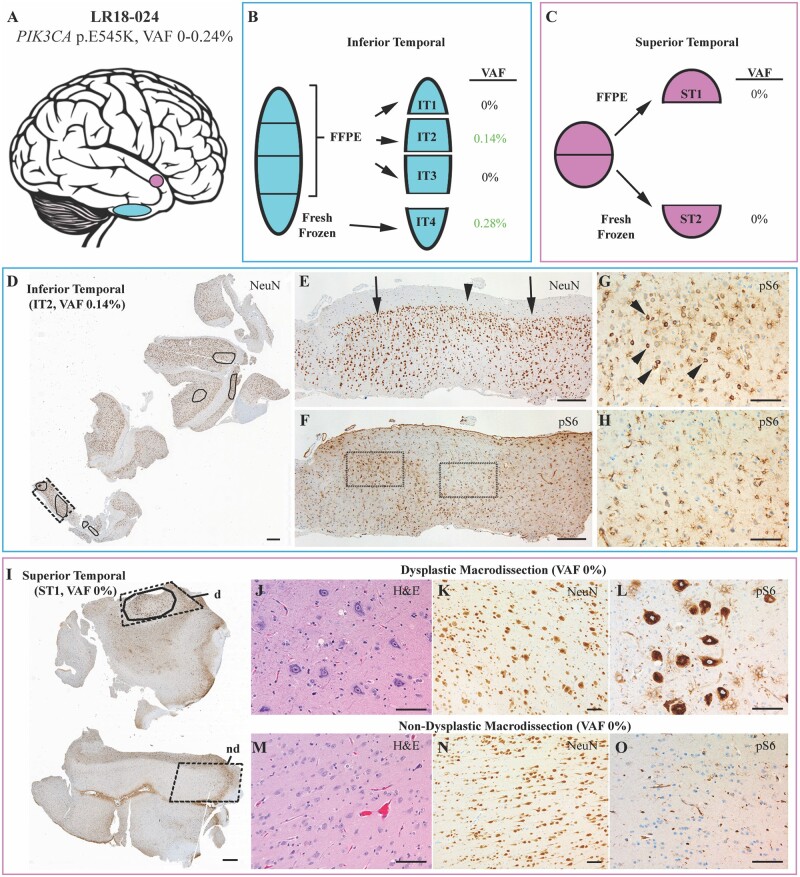
Focal malformations of cortical development including focal cortical dysplasia, hemimegalencephaly and megalencephaly, are a spectrum of neurodevelopmental disorders associated with brain overgrowth, cellular and architectural dysplasia, intractable epilepsy, autism and intellectual disability. Importantly, focal cortical dysplasia is the most common cause of focal intractable paediatric epilepsy. Gain and loss of function variants in the PI3K-AKT-MTOR pathway have been identified in this spectrum, with variable levels of mosaicism and tissue distribution. In this study, we performed deep molecular profiling of common PI3K-AKT-MTOR pathway variants in surgically resected tissues using droplet digital polymerase chain reaction (ddPCR), combined with analysis of key phenotype data. A total of 159 samples, including 124 brain tissue samples, were collected from 58 children with focal malformations of cortical development. We designed an ultra-sensitive and highly targeted molecular diagnostic panel using ddPCR for six mutational hotspots in three PI3K-AKT-MTOR pathway genes, namely PIK3CA (p.E542K, p.E545K, p.H1047R), AKT3 (p.E17K) and MTOR (p.S2215F, p.S2215Y). We quantified the level of mosaicism across all samples and correlated genotypes with key clinical, neuroimaging and histopathological data. Pathogenic variants were identified in 17 individuals, with an overall molecular solve rate of 29.31%. Variant allele fractions ranged from 0.14 to 22.67% across all mutation-positive samples. Our data show that pathogenic MTOR variants are mostly associated with focal cortical dysplasia, whereas pathogenic PIK3CA variants are more frequent in hemimegalencephaly. Further, the presence of one of these hotspot mutations correlated with earlier onset of epilepsy. However, levels of mosaicism did not correlate with the severity of the cortical malformation by neuroimaging or histopathology. Importantly, we could not identify these mutational hotspots in other types of surgically resected epileptic lesions (e.g. polymicrogyria or mesial temporal sclerosis) suggesting that PI3K-AKT-MTOR mutations are specifically causal in the focal cortical dysplasia-hemimegalencephaly spectrum. Finally, our data suggest that ultra-sensitive molecular profiling of the most common PI3K-AKT-MTOR mutations by targeted sequencing droplet digital polymerase chain reaction is an effective molecular approach for these disorders with a good diagnostic yield when paired with neuroimaging and histopathology.

Keywords: ddPCR; epilepsy; focal cortical dysplasia; hemimegalencephaly; mosaicism.


Figures

Figure 1
Figure 1
Overview of the cohort and samples. (A) Representative brain MRIs of patients with focal cortical dysplasia (FCD), hemimegalencephaly (HMEG) and dysplastic megalencephaly (DMEG). Representative affected brain areas are highlighted by red ovals. Patients diagnosed with FCD and quadrantic dysplasia were clustered in the FCD category, while patients diagnosed with HMEG or DMEG were clustered in the HMEG/DMEG category. (B) Bar graph representing the cohort distribution stratified by the four clinical diagnostic categories (FCD, HMEG/DMEG, and malformations of cortical development, MCD, as well as other diagnoses) and sex. The ‘other’ diagnoses include gliosis (n = 3), hypoxic-ischaemic encephalopathy (HIE, n = 1), meningoangiomatosis (n = 1), mesial temporal sclerosis (MTS, n = 1) and stroke (n = 1). (C) Pie chart representing types and numbers of samples collected from the 58 individuals in this series. The vast majority of samples were brain (n = 124, fresh frozen or FFPE).
Figure 2
Figure 2
Molecular results. (A) Number of brain samples per patient in our cohort. Most of the patients had at least one brain sample (n = 30). (B) The molecular yield (or solve rate) stratified by number of brain samples. The solve rate was calculated as number of positive cases with a given number of brain samples over the total number of cases with the same number of brain samples, and expressed as a percentage. As expected, our solve rate was increased with increasing numbers of brain samples, indicating that the number and type of samples per patient is crucial to identify a causal mosaic mutation. (C) VAF% for the 17 mutation-positive patients. The y-axis represents the VAF%, while patients are listed on the x-axis. All samples belonging to the 17 patients are represented, including negative ones (crossing the zero on the y-axis). Grey shaded boxes are used to represent every other patient to delineate samples belonging to each individual. Different tissues are represented as indicated in the graph legend. Only brain and saliva samples were mutation-positive, whereas blood, buccal swab and skin fibroblast-derived samples were negative. (D) Positive samples stratified by the PI3K-AKT-MTOR hotspot mutation to visualize the range of VAF for each mutation across individuals. Notably, the PIK3CA, p.E545K, variant had the widest VAF% range and was the only hotspot to be present at higher VAF% in saliva rather than brain samples.
Figure 3
Figure 3
Genotype–phenotype correlations of PI3K-AKT-MTOR hotspot mutations. (A) Hotspot mutations detected in our cohort are stratified according to the four diagnostic categories and represented as stacked bar graphs. Notably, only FCD and HMEG/DMEG cases were positive for the six positive hotspots tested, while none of the MCD or ‘other’ diagnoses were positive for these variants. The frequency of PIK3CA mutations was higher in DMEG/HMEG with a solve rate of 81.81%. In contrast, FCD had higher frequency of MTOR mutations (9/11 cases) with an overall solve rate of 24.24%. (B) The same data from graph A was stratified by the neuropathology classification/diagnosis and represented via stacked bar graph (number of cases in our cohort n = 58). Solve rate for each category is shown as a percentage and calculated as number of positive cases/number of total cases within the same neuropathology subtype. FCD type 2a had the highest overall molecular yield in our series. (C) VAF% range in the cohort stratified on the basis of the neuroimaging diagnosis. The FCD cohort presents a VAF range significantly lower than the HMEG/DMEG cohort. Mann–Whitney test, two tailed, P < 0.0001, Mann–Whitney U = 411.5. (D) Bar graph showing the age of onset of seizures in the hotspot mutation-positive (n = 15) versus hotspot mutation-negative (n = 39) cohorts. Each dot represents one individual, the top of the bar indicating the mean age of onset (12.79 months in mutation-positive, 39.46 months in mutation-negative) and error bars represent the full range. Kolmogorov–Smirnov test revealed a significant difference with **P = 0.0037. (E) Correlation analysis of seizure age of onset and VAF% in hotspot mutation-positive patients (n = 15). Spearman correlation analysis demonstrated a significant negative correlation with an r = −0.6113 and *P = 0.0175.
Figure 4
Figure 4
Neuroimaging findings and correlations with genotype. Representative brain MRIs showing brain biopsy or tissue resection locations alongside identified VAF of PI3K-AKT-MTOR hotspot mutations. For each image, cross-hairs reflect the site from which a tissue sample was obtained for molecular analysis, with letters at the top reflecting the multiple samples taken. At each location, ddPCR results are shown for the respective region. Green dots represent the exact location of resection, and ddPCR results are indicated as VAF% for positive samples. The year in which the surgery was performed is indicated after the underscore, as some patients underwent multiple brain surgeries (LR13-129, LR13-389). The reported VAF% did not directly correlate with the severity and distribution of visible cortical lesions.
Figure 5
Figure 5
Histopathological findings and correlations with genotype in tissue samples from patient LR18-024. (A) Separate resected pieces of brain tissue (shown schematically) were received from the inferior (blue) and superior (pink) temporal lobe. (B) The inferior temporal piece was divided into four portions: three were formalin-fixed and embedded in paraffin (FFPE, IT-1, -2, -3) and one (IT4) was fresh frozen, as shown in the scheme. VAF% results obtained via ddPCR for the four portions are shown next to each subresection. (C) The superior temporal piece was divided in two halves: one half submitted as FFPE (ST1) and one half as fresh frozen (ST2). (D) A NeuN immunostained section at low magnification shows the entire block face from IT-2 with areas of cortical dysplasia (outlined). (E) Higher magnification of the region indicated by dashed rectangle in D, which shows abnormal clustering of neurons in two areas of histological dysplasia (arrows) with intervening histologically normal cortex (arrowhead). (F) pS6 immunolabelling of a tissue section adjacent to (E), including dysplastic (G) and non-dysplastic (H) foci. pS6-immunoreactive neurons (arrowheads in F) are present in the dysplastic focus, whereas only glia cells show immunoreactivity in the non-dysplastic zone (G). (I) A pS6 immunostained section showing the entire block face from the superior temporal piece (ST1) with the dysplastic focus encircled. The dashed outlines indicate areas that were macrodissected from the block to enrich for histologically dysplastic (d) and non-dysplastic (nd) cortex. Images from the macrodissected regions highlight the cellular enlargement, disorganization, and strong pS6 immunoreactivity that differentiate the dysplastic (JL) and non-dysplastic (MO) cortex. Scale bars = 1 mm in D and H; 300 μm in E and F; and 100 μm in G, H and JO.

Similar articles

Cited by

References

    1. Oegema R, Barakat TS, Wilke M, et al. International consensus recommendations on the diagnostic work-up for malformations of cortical development. Nat Rev Neurol. 2020;16(11):618–635. - PMC - PubMed
    1. Mirzaa GM, Campbell CD, Solovieff N, et al. Association of MTOR mutations with developmental brain disorders, including megalencephaly, focal cortical dysplasia, and pigmentary mosaicism. JAMA Neurol. 2016;73(7):836–845. - PMC - PubMed
    1. Guerrini R, Barba C. Focal cortical dysplasia: An update on diagnosis and treatment. Expert Rev Neurother. 2021;21(11):1213–1224. - PubMed
    1. Iffland PH2nd, Crino PB. Focal cortical dysplasia: Gene mutations, cell signaling, and therapeutic implications. Annu Rev Pathol. 2017;12:547–571. - PubMed
    1. Fauser S, Sisodiya SM, Martinian L, et al. Multi-focal occurrence of cortical dysplasia in epilepsy patients. Brain. 2009;132(Pt 8):2079–2090. - PubMed

Publication types

MeSH terms

Substances