RNA is required for the integrity of multiple nuclear and cytoplasmic membrane-less RNP granules
- PMID: 35355287
- PMCID: PMC9058542
- DOI: 10.15252/embj.2021110137
RNA is required for the integrity of multiple nuclear and cytoplasmic membrane-less RNP granules
Abstract
Numerous membrane-less organelles, composed of a combination of RNA and proteins, are observed in the nucleus and cytoplasm of eukaryotic cells. These RNP granules include stress granules (SGs), processing bodies (PBs), Cajal bodies, and nuclear speckles. An unresolved question is how frequently RNA molecules are required for the integrity of RNP granules in either the nucleus or cytosol. To address this issue, we degraded intracellular RNA in either the cytosol or the nucleus by the activation of RNase L and examined the impact of RNA loss on several RNP granules. We find the majority of RNP granules, including SGs, Cajal bodies, nuclear speckles, and the nucleolus, are altered by the degradation of their RNA components. In contrast, PBs and super-enhancer complexes were largely not affected by RNA degradation in their respective compartments. RNA degradation overall led to the apparent dissolution of some membrane-less organelles, whereas others reorganized into structures with altered morphology. These findings highlight a critical and widespread role of RNA in the organization of several RNP granules.
Keywords: RNA granules; RNP granules; RNase L; condensates; membrane-less organelles.
© 2022 The Authors. Published under the terms of the CC BY 4.0 license.
Figures

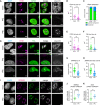
GAPDH smFISH and IF analysis using anti‐G3BP antibody (G3BP) and anti‐Dcp1b antibody (DCP1) in A549 cells (RL‐WT) or A549 RL‐KO cells either mock transfected (mock) or transfected with poly(I:C) (PIC) for 5 h. Scale bar 10 microns.
Graph of the fraction of G3BP foci with different volumes in PIC‐treated RL‐WT and RL‐KO cells.
Number of DCP1 foci per cell in PIC‐treated RL‐WT and RL‐KO cells relative to the number in mock‐treated cells. Wilcoxon Signed Rank test, ns, non‐significant.
Average volume of individual Dcp1 foci in mock‐ and PIC‐treated RL‐WT and RL‐KO cells. One‐way ANOVA with Sidak’s multiple comparisons test, ns, non‐significant.

Full‐length Dcp1 RNase L (DRL) fusion proteins are expressed. Western analysis using anti‐RNase L antibody of whole cell lysates from A549 (RL‐WT) cells, A549 RNase L knock out cells (RL‐KO), and RL‐KO cells transduced with lentiviral vectors containing either wild‐type RNase L fused to DCP1a (RL‐KO DRL‐WT) or catalytic mutant RNase L‐R667A fused to DCP1a (RL‐KO DRL‐CM). Arrows on left indicate migration of the endogenous RNase L (RL) and the DCP1 RNase L fusion proteins (DRL).
DRL fusion proteins co‐localize with P‐bodies. IF analysis using anti‐DCP1b antibody to detect P‐bodies (DCP1) or anti‐Flag antibody to detect Flag‐tagged DCP1a‐RNase L fusion proteins. Scale bar 10 microns.
DRL‐WT fusion protein is active. GAPDH smFISH and IF analysis using anti‐G3BP antibody (G3BP) and anti‐Dcp1b antibody (DCP1) in A549 RL‐KO cells with DRL‐WT or DRL‐CM fusion proteins either mock transfected (mock) or transfected with poly(I:C) (PIC) for 5 h. Scale bar 10 microns.
Number of DCP1 foci per cell in mock‐ and PIC‐treated RL‐WT and RL‐KO cells expressing DRL‐WT relative to the number in mock‐treated cells. Wilcoxon Signed Rank test, ns, non‐significant
Average volume of individual DCP1 foci in mock‐ and PIC‐treated cells. One‐way ANOVA with Sidak’s multiple comparisons test.

- A
GAPDH smFISH and IF analysis of microtubules (anti‐alpha tubulin antibody) or intermediate filaments (anti‐pan keratin antibody) in A549 cells mock treated or treated with poly(I:C) for 5 h.
- B
Graph of average volume of tubulin structures in mock‐ and PIC‐treated cells with reduced GAPDH RNA.
- C
Graph of average volume of keratin structures in mock‐ and PIC‐treated cells with reduced GAPDH RNA.
- D, E
A549 cells expressing nuclear‐localized wild‐type RNase L mock or poly(I:C) treated for 5 h. (D) Oligo(dT) FISH and IF analysis of nuclear lamin (anti‐lamin A antibody). (E) Oligo(dT) FISH and IF analysis of PML bodies (anti‐PML antibody).
- F
Graph of the number of PML foci in mock‐ and PIC‐treated cells with reduced oligo(dT) signal.
- G
Graph of average volume of PML foci in mock‐ and PIC‐treated cells with reduced oligo(dT) signal.

Western analysis of nuclear (N) or cytoplasmic (C) fractions from whole cell lysates (W) from A549 cells (RL WT), RNase L knock out A549 cells (RL KO), or A549 cells with either wild‐type RNase L (NLS‐RL‐WT) or RNase L‐R667A (NLS‐RL‐CM) fused to a nuclear localization signal sequence. Short and long exposure with anti‐RL antibody. GAPDH protein used as cytoplasmic marker. Histone H3 protein used as nuclear marker.
Graph depicting the fraction of RNase L found in the nucleus or cytoplasm. Mean and SEM of two experiments with individual experiment values plotted.
FISH with probes to GAPDH mRNA or oligo(dT) to detect poly(A)+ RNA in A549 cells without or with either NLS‐RL‐WT or NLS‐RL‐CM either mock transfected or transfected with poly(I:C) for 4 h. Scale bar 5 micron.
Graph depicting median and the value of the intensity of oligo(dT) fluorescence in individual nuclei divided by nuclear volume in the indicated cell types either mock transfected or transfected with poly(I:C) for 4 h. At least 43 nuclei analyzed per condition. Kruskal–Wallis test and Dunn’s multiple comparisons test. ****P‐value ≤ 0.0001, ***P‐value 0.0001, ns not significant.

FISH analysis to detect poly(A)+ RNA and nucleolar‐localized snoRD3A RNA. IF analysis to detect nucleolar granular component protein nucleophosmin (NPM1).
Graph of the mean and value of the average volume of individual snoRD3A foci in nuclei. 17 nuclei mock‐treated cells, 31 nuclei PIC‐treated cells.
Fraction of nuclei with NPM1 protein enriched in ring structures classified as granular component assemblies or dispersed in nucleoplasm. 17 nuclei mock‐treated cells, 31 nuclei PIC‐treated cells.
IF analysis to detect dense fibrillar component protein, ribosome processing factor 1 (RPF1).
Graph of the mean and value of the average volume of individual snoRD3A foci in nuclei. 43 nuclei mock‐treated cells, 69 nuclei PIC‐treated cells.
Graph of the mean and value of the average volume of RPF1 foci in 43 mock‐treated cells and 69 nuclei PIC‐treated cells.
FISH analysis to detect poly(A)+ RNA and nuclear speckle‐localized MALAT1 RNA and IF analysis with anti‐sc35 antibody to detect nuclear speckle protein SRRM2.
Graph of the mean and value of the intensity of MALAT1 signal divided by the nuclear volume of individual nuclei. 51 nuclei mock‐treated cells, 56 nuclei PIC‐treated cells.
Graph of the median and value of the volume of individual SRRM2 foci in nuclei. Mock 1526 SRRM2 foci in 51 nuclei. PIC 136 SRRM2 foci in 20 nuclei that contain ≤ 10 SRRM2 foci.
FISH analysis to detect poly(A)+ RNA and IF analysis to detect Cajal body protein coilin.
Graph depicting the fraction of nuclei in mock‐ and PIC‐treated cells with decreased oligo(dT) with different distributions of coilin protein. 90 nuclei in mock‐treated cells, 192 nuclei in PIC‐treated cells.

ETS1 and oligo(dT) FISH and IF analysis of NPM1 protein.
Graph of the mean and individual values for the average volume of ETS1 FISH signal in nuclei. ***P‐value = 0.0009. Mock 21 nuclei. PIC 28 nuclei.
Fraction of nuclei with NPM1 protein enriched in ring structures of any size classified as granular component assemblies or dispersed in nucleoplasm. Mock 21 nuclei. PIC 24 nuclei in which ETS1 signal was lower than the median ave vol in mock‐treated cells.
ETS1 and oligo(dT) FISH and IF analysis of FBL protein.
Graph of the mean and individual values for the average volume of ETS1 FISH signal in nuclei. Mock 33 nuclei. PIC 29 nuclei. **P‐value = 0.0025.
Graph of the mean and individual values for the average volume of fibrillarin (FBL) foci in nuclei. Mock 33 nuclei. PIC 23 nuclei in which ETS1 signal was lower than the median ave vol in mock‐treated cells. ***P‐value = 0.0008.
Graph of the mean and individual value for the number of SRRM2 foci per nucleus. ****P‐value ≤ 0.0001 Mock 51 nuclei. PIC 56 nuclei.
Graph of the mean and individual value for the total volume of SRRM2 foci divided by the nuclear volume of individual nuclei. ****P‐value ≤ 0.0001 Mock 51 nuclei. PIC 56 nuclei.
Oligo(dT) FISH and IF analysis of two nuclear speckle proteins, SRRM2 and SON.
Graph of the median and individual value of the ratio of SRRM2 fluorescence intensity in foci compared to in the nucleoplasm. ****P‐value ≤ 0.0001 Mock 17 foci in 5 nuclei. PIC 14 foci in 5 nuclei.
Graph of the median and individual value of the ratio of SON fluorescence intensity in foci compared to in the nucleoplasm. *P‐value = 0.034 Mock 19 foci in 5 nuclei. PIC 14 foci in 5 nuclei.

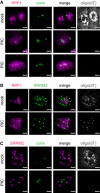
FISH analysis to detect nucleolar‐localized snoRD3A RNA and poly(A)+ RNA. IF analysis of nucleolar protein RPF1.
Oligo(dT) FISH and IF analysis of nuclear speckle protein SRRM2 with sc35 antibody.
Oligo(dT) FISH and IF analysis of Cajal body protein coilin.
Oligo(dT) FISH and IF analysis of Cajal body protein coilin and SMN1.

Oligo(dT) FISH and IF analysis of nucleolar protein RPF1 and Cajal body protein coilin.
Oligo(dT) FISH and IF analysis of nucleolar protein RPF1 and nuclear speckle protein SRRM2.
Oligo(dT) FISH and IF analysis of Cajal body protein coilin and nuclear speckle protein SRRM2.

FISH analysis to detect poly(A)+ RNA and IF analysis against FUS protein. Images are a single 0.2 micron Z section.
Graph depicting the fraction of nuclei with FUS dispersed in the nucleoplasm or in foci in cells with reduced nuclear oligo(dT) signal. All the nuclei (total) in which nuclear RNA was degraded (N = 64) or the same nuclei classified as to whether or not they contained residual poly(A) foci. Nuclei with poly(A) foci (N = 14). Nuclei without poly(A) foci (N = 50).
FISH analysis to detect poly(A)+ RNA and IF analysis against mediator complex protein, MED1, to detect super‐enhancer condensates.
Number of MED1 foci in mock‐ and PIC‐treated NLS‐RL‐WT cells.
Average volume of individual MED1 foci in mock‐ and PIC‐treated NLS‐RL‐WT cells.
FISH analysis to detect poly(A)+ RNA and IF analysis against BRD4, to detect super‐enhancer condensates.
Number of BRD4 foci in mock‐ and PIC‐treated NLS‐RL‐WT cells.
Average volume of individual BRD4 foci in mock‐ and PIC‐treated NLS‐RL‐WT cells.

IF analysis of super‐enhancer condensate protein MED1 in A549 cells expressing nuclear‐localized wild‐type RNase L mock transfected or treated with poly(I:C) with DMSO or 1 μg/ml Actinomycin D (ActD) for 5 h. IF against G3BP used to monitor cells responding to poly(I:C), FISH analysis for poly(A)+ RNA used to monitor nuclear RNA degradation and transcription inhibition. Scale bar 5 microns.
Number of MED1 foci per cell in mock‐, PIC‐, ActD‐, or PIC and ActD‐treated cells.
Average volume of individual MED1 foci per cell in mock‐, PIC‐, ActD‐, or PIC and ActD‐treated cells.

Direct RNA‐RNA interactions.
RNA as a scaffold for protein interactions.
RNA acts as allosteric promoter of protein‐protein interactions.
References
-
- Arias Escayola D, Neugebauer KM (2018) Dynamics and function of nuclear bodies during embryogenesis. Biochemistry 57: 2462–2469 - PubMed
-
- Begovich K, Wilhelm JE (2020) An in vitro assembly system identifies roles for RNA nucleation and ATP in yeast stress granule formation. Mol Cell 79: 991–1007.e4 - PubMed
-
- Benavente R (1991) Postmitotic nuclear reorganization events analyzed in living cells. Chromosoma 100: 215–220 - PubMed
Publication types
MeSH terms
Substances
Grants and funding
LinkOut - more resources
Full Text Sources

