. 2022 May;21(5):e13600.
doi: 10.1111/acel.13600. Epub 2022 Mar 31.

Alzheimer-like tau accumulation in dentate gyrus mossy cells induces spatial cognitive deficits by disrupting multiple memory-related signaling and inhibiting local neural circuit

Affiliations

Alzheimer-like tau accumulation in dentate gyrus mossy cells induces spatial cognitive deficits by disrupting multiple memory-related signaling and inhibiting local neural circuit

Shihong Li et al. Aging Cell. 2022 May.

Abstract

Abnormal tau accumulation and spatial memory loss constitute characteristic pathology and symptoms of Alzheimer disease (AD). Yet, the intrinsic connections and the mechanism between them are not fully understood. In the current study, we observed a prominent accumulation of the AD-like hyperphosphorylated and truncated tau (hTau N368) proteins in hippocampal dentate gyrus (DG) mossy cells of 3xTg-AD mice. Further investigation demonstrated that the ventral DG (vDG) mossy cell-specific overexpressing hTau for 3 months induced spatial cognitive deficits, while expressing hTau N368 for only 1 month caused remarkable spatial cognitive impairment with more prominent tau pathologies. By in vivo electrophysiological and optic fiber recording, we observed that the vDG mossy cell-specific overexpression of hTau N368 disrupted theta oscillations with local neural network inactivation in the dorsal DG subset, suggesting impairment of the ventral to dorsal neural circuit. The mossy cell-specific transcriptomic data revealed that multiple AD-associated signaling pathways were disrupted by hTau N368, including reduction of synapse-associated proteins, inhibition of AKT and activation of glycogen synthase kinase-3β. Importantly, chemogenetic activating mossy cells efficiently attenuated the hTau N368-induced spatial cognitive deficits. Together, our findings indicate that the mossy cell pathological tau accumulation could induce the AD-like spatial memory deficit by inhibiting the local neural network activity, which not only reveals new pathogenesis underlying the mossy cell-related spatial memory loss but also provides a mouse model of Mossy cell-specific hTau accumulation for drug development in AD and the related tauopathies.

Keywords: Alzheimer's disease; hTau N368; hippocampus; mossy cell; spatial memory.


Conflict of interest statement

The authors declare no competing interests.

Figures
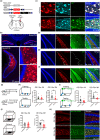
FIGURE 1
FIGURE 1
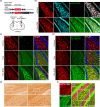
Mossy cell‐specific overexpressing hTau induces cognitive deficits with truncated hTau N368 accumulation‐dependent manner. (a) Strategies used for mossy cell‐specific overexpressing hTau in C57BL/6 mice: recombinant adeno‐associated virus (rAAV)/retro‐Cre was stereotaxically infused into one side and rAAV‐hTauCre was simultaneously infused at the opposite side of the ventral hippocampal dentate gyrus (DG) subsets. (b–f) Representative images shown mCherry expression pattern (b) and confirmed mossy cell‐specific overexpression of hTau in ventral DG measured by co‐labeling of HT7 (specifically reacts with hTau) and calretinin (mossy cell marker) (c). The mCherry was not co‐labeled with PV (arrows in panel d), SST (arrows in panel e), and GAD67 (arrows in panel f). Scale bars were indicated in each image. (g–i) Mossy cell overexpressing hTau for 3 months but not for 1 month in C57BL/6 mice decreased discrimination index. In this paradigm, mice were infused with empty vector (mCherry) or hTau for 1 or 3 months and then were tested to discriminate the novel object (object B) from familiar object (object A) (h), or the object (object Y) moved to a novel place (i). Unpaired t tests, **p < 0.01, n = 10–12 mice in each group. (j) Mossy cell overexpressing hTau for 3 months but not for 1 month impaired contexture memory shown by the decreased freezing during contextual fear conditioning retrieval tests. In this paradigm, the mice were allowed to explore for 3 min in a conditioning chamber, then exposed to three times foot shocks (0.65 mA, 2 s each, and 1 min rest in between), and were removed from the chamber 10 s later. After 24 h, the mice were put into the same training chamber without shocks, and the total freezing time in 3 min was measured. Unpaired t tests, **p < 0.01, n = 10–12 mice in each group. (k) Mossy cell overexpressing hTau for 3 months induced accumulation of the truncated pathological hTau N368 detected by anti‐Tau N368. Scale bar, 20 μm. Data were represented as mean ± SEM
FIGURE 2
FIGURE 2
Mossy cell‐specific overexpressing hTau N368 for 1 month causes Alzheimer disease (AD)‐like pathological tau accumulation. (a) Strategies used for mossy cell‐specific overexpressing hTau N368 in C57BL/6 mice. The recombinant adeno‐associated virus (rAAV)/retro‐Cre was stereotaxically infused at one side and rAAV‐hTau N368Cre was simultaneously infused at the contralateral side of the hippocampal dentate gyrus subsets. (b) Representative images confirming mossy cell overexpression of hTau N368 measured by co‐labelling of mCherry, anti‐Tau N368, and calretinin. (c, d) Representative co‐immunofluorescence images showing that mossy cell‐overexpressing hTau N368 induced more prominent accumulation of the AD‐like hyperphosphorylated (AT8) and oligomerized (T22) hTau than overexpressing full‐length hTau. (e, f) Representative images showing prominent accumulation of the AD‐like pathologically truncated Tau N368 in hilus of 10‐month 3xTg‐AD mice (e), and most Tau N368‐positive cells in hilus were identified as mossy cells, as indicated by co‐labeling of anti‐Tau N368 with calretinin (f). Scale bars were as indicated in each image
FIGURE 3
FIGURE 3
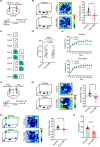
Both unilateral and bilateral mossy cell‐specific overexpressing hTau N368 for only 1 month induce cognitive impairments. (a, b) Mossy cell overexpressing hTau N368 in C57BL/6 mice for 1 month decreased discrimination index measured by object recognition test. The schematics showing experimental procedure (a), the behavioral paradigm in which the mice were tested to discriminate the novel object (object B) from the familiar object (object A) (b, left), the representative heatmaps showing the traveled traces of the mice during the test phase (b, middle) and the quantitative analysis (b, right). Unpaired t test, **p < 0.01, n = 12 mice. (c–e) Mossy cell overexpressing hTau N368 in C57BL/6 mice for 1 month decreased the ability in pattern separation. (c) Schematics showing procedures of contextual acquisition and pattern separation. In this paradigm, each mouse was trained to acquire fear memory by foot shock delivered in context A at days 1 to 3, and then tested to discriminate a similar context (context B) from A at day 4. In the subsequent days, the mice were trained and tested to discriminate a pair of similar contexts. (d) At day 4, both control and hTau N368‐overexpressing mice could not distinguish the two similar contexts. Paired t test, *p < 0.05, n = 14 mice. (e) At days 5 to 16, both control and the hTau N368‐overexpressing mice could learn to discriminate the context B from A, but the control group learned much faster than the hTau N368‐overexpressing group. Repeated‐measure ANOVA followed by Tukey's multiple comparisons tests, or paired t test. *p < 0.05, **p < 0.01, ***p < 0.001, n = 14 mice. (f–i) Mossy cell overexpressing hTau N368 in Calb2‐Cre mice for 1 month decreased discrimination and fear memory of the mice. (f) Strategy for virus infusion in Calb2‐Cre mice: rAAV‐hTau N368Cre was infused stereotaxically into both sides of the hippocampal DG and the expression of hTau N368 was confirmed by immunofluorescence staining after 1 month (see Figure S4), and then the behavioral tests were performed. (g, h) Mossy cell overexpressing hTau N368 for 1 month decreased discrimination index of the mice in the object recognition (g) and object location (h) tests. In this paradigm, mice were tested to discriminate the novel object (object B) from familiar object (object A) (g), or the object (object Y) moved to a novel place (h). Representative heatmaps showing the travel traces of the mice during the test phase. Unpaired t test, *p < 0.05, **p < 0.01, n = 8–10 mice. (i) Mossy cell overexpressing hTau N368 for 1 month impaired contextual fear memory shown by the decreased freezing time during fear conditioning retrieval tests. Unpaired t test, **p < 0.01. n = 8–10 mice. Data were represented as mean ± SEM
FIGURE 4
FIGURE 4
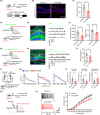
Mossy cell‐specific overexpressing hTau N368 inhibits local excitatory neuronal activity with suppressed local neural network activity. (a–c) Mossy cell‐specific overexpressing hTau N368 in Calb2‐Cre mice for 1 month inhibited neural activity shown by the significantly decreased numbers of c‐Fos+cells in granule cell layer (GCL) measured at 90 min after contextual fear conditioning test. The schematics of the experimental procedure (a), representative co‐immunofluorescence images (b) and the quantitative analysis (c). Unpaired t tests, n = 5 mice in each group, **p < 0.01. Scale bar, 50 μm. (d–f) Mossy cell overexpressing hTau N368 in Calb2‐Cre mice decreased calcium response in DG excitatory neurons evidenced by the decreased number of calcium response (f, left) and the area under ΔF/F curves (AUC) (f, right). The AAV‐carried hTau N368 and GCaMP6f were respectively infused into the ventral and dorsal DG subsets of Calb2‐Cre mice for 1 month, then the optic fibers were implanted and in vivo optic fiber recording was carried after 1 week. The schematics (d), representative image and ΔF/F signals presented by using 5% ΔF/F as threshold (e) and quantitative analysis (f). Scale bar, 20 μm. Unpaired t tests, n = 6 mice in each group, *p < 0.05, **p < 0.01. (g–i) Mossy cell‐specific overexpressing hTau N368 suppressed glutamate response in dDG evidenced by the decreased ΔF/F signals of iGluSnFR(A184S). The AAV‐carried hTau N368 and iGluSnFR(A184S) were respectively infused into the ventral and dorsal DG subsets of Calb2‐Cre mice for 1 month, then the optic fibers were implanted and the in vivo optic fiber recording was carried after 1 week. The schematic of the experimental procedure (g), the representative image and ΔF/F signal presented by using 5% ΔF/F as threshold (h) and the quantitative analysis (i). Scale bar, 20 μm. Unpaired t tests, n = 6 mice in each group, *p < 0.05. (j–l) Mossy cell overexpressing hTau N368 in C57BL/6 mice impaired local field potential (LFP) with reduced power spectral density (PSD) in dDG subset measured by in vivo electrophysiology. The schematic of the experimental procedure (j), PSD of LFP from 0.5 to 300 Hz (k), LFP band‐power in the low theta (3–5 Hz), high theta (7–10 Hz), and high gamma (80–120 Hz) (l). n = 8 mice, unpaired t tests, *p < 0.05. (m, n) Mossy cell‐specific overexpressing hTau N368 suppressed dDG granule cells excitability measured by whole patch clamp recording. The schematics (m), representative traces (n, left) and summary graphs (n, right) of intrinsic excitability of dDG granule cells measured as number of action potential (AP) in response to stepwise depolarizing currents (duration 500 ms) in DG slices. mCherry, n = 26 cells/5 mice; hTau N368, n = 23 cells/5 mice. Two‐way ANOVA, *p < 0.05, **p < 0.01, ***p < 0.001. Data were represented as mean ± SEM
FIGURE 5
FIGURE 5
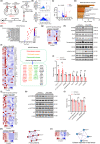
Mossy cell‐specific overexpressing hTau N368 decrease multiple synapse‐associated proteins with remarkably disrupted Jak‐STAT and PI3K‐AKT signaling pathway. (a) Schematics show sample preparation for transcriptomic analysis. The mossy cell‐specific overexpressing hTau N368 in Calb2‐Cre mice was carried out as described in Figure S4. After 1 month, the DG subset was dissected and the hTau N368‐overexpressing mossy cells were sorted by fluorescence activated cell sorting (FACs) for transcriptomic analysis. (b) The mCherry‐positive cells were sorted by FACs, to evaluate the specificity of AAV‐delivered mCherry‐fused hTau N368 and mCherry expression in mossy cells. The boxed area (b, bottom panel) represents cells gated as significantly fluorescent compared with non‐fluorescent control (b, top panel). (c) A total of 917 in 16,923 genes were statistically significant up‐ or downregulated in mossy cells after hTau N368 overexpression measured by RNA‐seq analysis. n = 5 mice in each group. (d) Top Gene Ontology terms for differentially expressed genes (DEGs) in (c). (e) Enriched KEGG pathway of DEGs in (c). (f) Heatmap showing gene expression of DEGs in glutamatergic synapse, cholinergic synapse, dopaminergic synapse, and calcium signaling pathway. (g–i) Mossy cell overexpressing hTau N368 upregulated STAT1 with downregulated synapse‐associated proteins in dentate gyrus. Data were normalized to β‐actin and the mean value of mChery group for each protein. Unpaired t tests, n = 6 mice, *p < 0.05, **p < 0.01, ***p < 0.001. (j–l) Mossy cell overexpressing hTau N368 inhibited p‐AKT(S473) with reduced pGSK‐3β(S9) (indicating GSK3β activation). Data were normalized to β‐actin and the mean value of mChery group for each protein. Unpaired t tests, n = 6 mice, *p < 0.05, **p < 0.01, ***p < 0.001. (m, n) Heatmap showing gene expression of DEGs in F‐box proteins and cellular response to heat stress. Data were represented as mean ± SEM
FIGURE 6
FIGURE 6
Chemogenetic activating mossy cells rescues hTau N368‐induced cognitive impairments in mice. (a–d) Mossy cell‐specific overexpressing hTau N368 in Calb2‐Cre mice for 1 month significantly decreased discrimination index and decreased freezing time measured respectively by novel object recognition test (b), object location test (c), and contexture fear conditioning (d), whereas chemogenetically activating mossy cells by intraperitoneal (ip) injecting CNO attenuated hTau N368‐induced cognitive deficits. Two‐way ANOVA followed by Tukey's multiple comparisons test, n = 8–10 mice, *p < 0.05, **p < 0.01, ***p < 0.001. Data were represented as mean ± SEM

Similar articles

Cited by

References

    1. Amaral, D. G. , Scharfman, H. E. , & Lavenex, P. (2007). The dentate gyrus: Fundamental neuroanatomical organization (dentate gyrus for dummies). Progress in Brain Research, 163, 3–22. 10.1016/S0079-6123(07)63001-5 - DOI - PMC - PubMed
    1. Bieri, K. W. , Bobbitt, K. N. , & Colgin, L. L. (2014). Slow and fast gamma rhythms coordinate different spatial coding modes in hippocampal place cells. Neuron, 82(3), 670–681. 10.1016/j.neuron.2014.03.013 - DOI - PMC - PubMed
    1. Blasco‐Ibanez, J. M. , & Freund, T. F. (1997). Distribution, ultrastructure, and connectivity of calretinin‐immunoreactive mossy cells of the mouse dentate gyrus. Hippocampus, 7(3), 307–320. 10.1002/(SICI)1098-1063(1997)7:3<307:AID-HIPO6>3.0.CO;2-H - DOI - PubMed
    1. Botterill, J. J. , Gerencer, K. J. , Vinod, K. Y. , Alcantara‐Gonzalez, D. , & Scharfman, H. E. (2021). Dorsal and ventral mossy cells differ in their axonal projections throughout the dentate gyrus of the mouse hippocampus. Hippocampus, 31(5), 522–539. 10.1002/hipo.23314 - DOI - PMC - PubMed
    1. Botterill, J. J. , Lu, Y.‐L. , LaFrancois, J. J. , Bernstein, H. L. , Alcantara‐Gonzalez, D. , Jain, S. , Leary, P. , & Scharfman, H. E. (2019). An excitatory and epileptogenic effect of dentate gyrus mossy cells in a mouse model of epilepsy. Cell Reports, 29(9), 2875–2889.e2876. 10.1016/j.celrep.2019.10.100 - DOI - PMC - PubMed

Publication types