. 2022 Mar 14;25(4):104074.
doi: 10.1016/j.isci.2022.104074. eCollection 2022 Apr 15.

Chromosomal instability drives convergent and divergent evolution toward advantageous inherited traits in mammalian CHO bioproduction lineages

Affiliations

Chromosomal instability drives convergent and divergent evolution toward advantageous inherited traits in mammalian CHO bioproduction lineages

Steve Huhn et al. iScience. .

Abstract

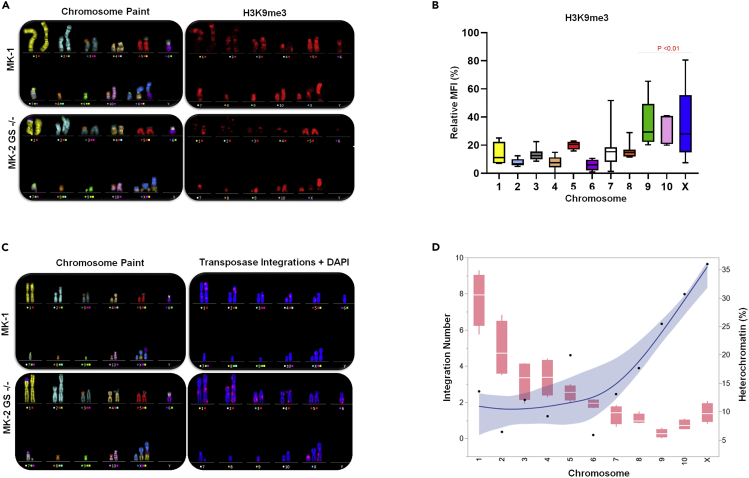
Genetic instability of Chinese hamster ovary (CHO) cells is implicated in production inconsistency through poorly defined mechanisms. Using a multi-omics approach, we analyzed the variations of CHO lineages derived from CHO-K1 cells. We identify an equilibrium between random genetic variation of the CHO genome and heritable traits driven by culture conditions, selection criteria, and genetic linkage. These inherited changes are associated with the selection pressures related to serum removal, suspension culture transition, protein expression, and secretion. We observed that a haploid reduction of a Chromosome 2 region after serum-free, suspension adaptation, was consistently inherited, suggesting common adaptation mechanisms. Genetic variations also included ∼200 insertions/deletions, ∼1000 single-nucleotide polymorphisms, and ∼300-2000 copy number variations, which were exacerbated after gene editing. In addition, heterochromatic chromosomes were preferentially lost as cells continuously evolved. Together, these observations demonstrate a highly plastic signature for adapted CHO cells and paves the way towards future host cell engineering.

Keywords: Biotechnology; Evolutionary mechanisms; Genetics; Omics.


Conflict of interest statement

S. Huhn, A. Kumar, B. Jiang, R. Liu, H. Lin, G. Nyberg, and Z. Du are employees of Merck Sharp & Dohme Corp., a subsidiary of Merck & Co., Inc., Kenilworth, NJ, USA and potentially own stock and/or hold stock options in Merck & Co., Inc., Kenilworth, NJ, USA. Merck & Co., Inc provided support in the form of salaries for all authors but did not have any additional role in the study design, data collection and analysis, decision to publish, or preparation of the manuscript. The specific roles of these authors are articulated in the “author contributions” section.

Figures

None
Graphical abstract
Figure 1
Figure 1
History and adaptation of CHO-K1 cultures into serum-independent suspension cells (A) CHO cells represent many subspecies from independent laboratories. A family tree depicting the source material for independent CHO lineages in depicted, with the MK-1 and MK-2 hosts and derivative GS knockout hosts shown in dark green. (B) CHO-K1 LC78 Cells were adapted into chemically defined media by independent methods to generate two unique host cells. MK-2 cells were generated by titrating amounts of serum over time in chemically defined media (CD-CHO/MEM-alpha mix. Alternatively, MK-1 cells were produced by slowly titrating soy-hydrolysate proficient (PF-CHO). Once stable pools were established, and the doubling time normalized, single cell clones were generated using FACs. These clones were then scaled, banks were prepared, and clones were transfected with recombinant antibody. Following a fed-batch production assay, the top producers, deemed “MK-1” and “MK-2,” were identified, and these host cells were thawed. These hosts were then transfected with ZFN mRNA and used to generate GS−/− pools. These GS −/− pools were then cloned and ranked for protein expression as above to yield MK-1 GS−/− or MK-2 GS −/− host lines. See also Figure S1. (C) Representative cell doubling times during the adaptation process of MK-1 are graphed in the bottom panel. (D) Cells were visualized at 100× magnification using an inverted light microscope. These cells were passaged in shake flasks and the doubling time (E) and mean diameter (F) of each lineage were recorded over 10–15 passages (data is represented as boxplots for >30 cells where the centroid represents the median and whiskers represent the min and max, or dot plots where each dot represents one cell.) Scale bars represent 10 microns in length. Red asterisks represent significance (p < 0.05) versus all other data points using Student’s t test with unequal variance.
Figure 2
Figure 2
Characterization of host cell lineages by cytology (A) Metaphase spreads were prepared from each cell line and the frequency distribution of metaphase chromosomes per cell was then counted and plotted in histogram form. Data from >30 cells is represented as mean ± SD. (B) Representative chromosome painting results from the five cell lines are depicted. Images representing the most common karyotype of >20 images and two experiments (right panel). The average distribution of individual chromosomes pixels that occupied a cell’s karyotype (genome) was averaged across >20 metaphases. This value was then represented as Log2 fold changes versus CHO-K1 LC78 distribution of chromosome paints. The red asterisk represents values significantly changed using Student’s t test with unequal variance (p < 0.05) versus the corresponding CHO-K1 LC78 chromosome (bottom panel).
Figure 3
Figure 3
Characterization of host cell translocation events (A) Schematic depicting how translocation events were quantified in CHO hosts. Recombination frequency involving donor or recipient chromosome exchanges (see materials and methods) were scored and averaged across >30 metaphase spreads in CHO-K1 LC78 (B) and individual developed new lineages (C). See also Figure S2.
Figure 4
Figure 4
Association of heterochromatic regions with the CHO genome (A) Formalin-fixed metaphase spreads were probed with whole-chromosome paints and H3K9me3. (B) The mean intensity of H3K9me3 marker was quantified and represented in boxplot form. Each plot represents the average intensity of all chromosome components identified, including rearrangements, across 5–10 cells. Data are represented as boxplots where the centroid represents the median and whiskers represent the min and max. Chrs underneath the red bar (Chrs 9,10, and X) indicate statistical significance (p < 0.05 using a Student’s t test with unequal variance) versus those without a bar (Chrs 1–8). (C) Host cells were transfected with recombinant DNA and transposase mRNA. Following selection and stable cell establishment, the recombinant pools were fixed and probed for recombinant DNA and chromosome paints. (D)The number of integrations was counted in >20 cells and binned based on their chromosome identity and plotted as box-plots (left-y axis, see description of box-plots above) These data were overlayed with the content of H3K9me3 staining (blue trendline, right-y axis).
Figure 5
Figure 5
Genome-wide copy-number changes in adapted CHO cell cultures Copy-number variation against CHO-K1 LC78 progenitors was detected using whole genome sequencing and CNVKit. (A) Heatmap of the observed copy-number across cell lines (top); dendrogram of the cell lines generated using the log2 ratio of the copy-number against CHO-K1 LC78 (bottom). (B) CNV Kit results were mapped to individual chromosomes. Amplified regions are depicted in red, deleted regions in blue. The percentage of genes changes out of all genes on the indicated chromosome is represented as a histogram. The genes completely deleted in each host are indicated in the table below the graph. The symbol adjacent to each gene is depicted in the histogram, to designate where each deleted gene maps (Zmzi1=,Axl=, Tcf4=, Ceacam9=). (C and D) Schematic diagram showing CNV in a segment (0–60 MBp) of the chromosome 2 in MK-1 and MK-2 (left panel). The amplified and deleted regions are colored in red and blue, respectively. Genes are indicated with tick marks across the segment (left panel). Genetic polymorphisms in these coding regions is analyzed is Figure S4. Subset of genes were then verified for copy-number quantification in CHO-K1 LC78 and MK-2 by qPCR and plotted in bar plot. The results represent three biological experiments, averaged with error bars as ± SD (right panel). Red asterisk indicates a significant difference (p < 0.05) using Student’s t test between CHO-K1 LC78 and MK-2. (D) Venn diagram of amplified and deleted genes in each adapted host versus CHO-K1 LC78. Blue text indicates the number of genes with reduced copy number, and red text represents the number of genes amplified. (E) Bar graph of the number of genes that fall into the indicated ontology categories. Only genes with statistically significantly changed CNVs were used for plotting. See also Figure S3 for cell phenotype relating to genetic changes.
Figure 6
Figure 6
Comparison of transcriptome level changes The significant differential expression changes are represented as Log2 fold change versus the CHO-K1 LC78 lineage. RNASeq counts were normalized, and the gene expression Log2 fold changes versus CHO-K1 LC78 in the four cell lines were visualized as (A) heatmap of genes significantly differentially expressed versus CHO-K1 LC78. The log2 fold change of RNA expression was plotted in the heatmap. Genes were clustered, and dendrogram was drawn with Euclidean distance and complete linkage algorithm. (B) Venn diagram of significantly differentially expressed genes. The number of genes increased and decreased versus CHO-K1 LC78 is colored in red and blue, respectively. (C) Scatterplot of RNA log2 fold change versus DNA copy number. Genes from host lineages were bucketed into four categories: genes significantly changed on both a transcriptomic and genomic level (blue dots), significantly changed in RNA expression only (yellow dots), significantly changed in DNA copy only (red dots) or no changes (grey dots). The gray dashed vertical line indicates a copy number of 2. (D) Heatmap of RNA expression in key epigenetic regulators (top panel). Log2 fold change versus CHO-K1 LC78 was used for plotting the genes in the heatmap with red color indicating increased and blue for decreased RNA expression. Schematic diagram depicting how these regulators affect heterochromatin (bottom panel). DNA and chromatin are colored gray. Blue circles marked Ac represent histone acetylation, and red circles marked Me represent H3K9 methylation. Colored ovals represent different epigenetic regulators. (E) Gene set enrichment analysis of differentially expressed genes versus CHO-K1 LC78 that are common (top panel) to all hosts or unique to MK-1 GS−/− (bottom panel). X-axis represents the -log 10 p-value of the enrichment, and the significantly enriched biological process and pathways are indicated on the y-axis. See also Figure S3 for cell phenotype relating to genetic changes.
Figure 7
Figure 7
Diversity of UPR and DNA damage response in different host lineages (A) Heatmap showing differences in RNA expression and CNV for genes involved in different function of UPR including chaperone-mediated protein folding, ERAD, and glycosylation. Note that the MK-1 GS−/− cell line exhibited significantly upregulated expression at both DNA and RNA levels across all subsystems. (B) Gene set enrichment analysis of representative gene set for UPR showing enriched UPR in MK-1 GS−/− compared with MK-2 GS−/− cell line. UPR pathway schematic showing upregulation of genes involved in protein folding, lipid biogenesis, ERAD, and glycosylation in MK-1 GS−/− cell line (thermometer-1) compared with MK-2 GS−/− (thermometer-2). (C) Heatmap showing differences in gene expression and CNV for genes involved in DNA repair. Genes are categorized by the distinct repair pathway. Note that MK-1 GS−/− cell line exhibited increased homologous recombination (HR) but not other pathways such as base excision repair (BER), nucleotide excision repair (NER), mismatch repair (MMR), or nonhomologous end joining (NHEJ). (D) Gene set enrichment analysis of representative gene set for homologous recombination (HR) genes in MK-1 GS−/− compared with MK-2 GS−/− cell line. A schematic depicting the HR pathway in MK-1 GS−/− cell line (thermometer-1) compared with MK-2 GS−/− (thermometer-2). Red and blue thermometers represent upregulation and downregulation of mRNA level, respectively. All CNV and RNA differential expression were compared with CHO-K1 LC78. See also Figure S3 for cell phenotype relating to genetic changes.

Similar articles

Cited by

References

    1. Auer N., Hrdina A., Hiremath C., Vcelar S., Baumann M., Borth N., Jadhav V. ChromaWizard: an open source image analysis software for multicolor fluorescence in situ hybridization analysis. Cytometry A. 2018;93:749–754. - PMC - PubMed
    1. Barr A.R., Cooper S., Heldt F.S., Butera F., Stoy H., Mansfeld J., Novák B., Bakal C. DNA damage during S-phase mediates the proliferation-quiescence decision in the subsequent G1 via p21 expression. Nat. Commun. 2017;8:14728. - PMC - PubMed
    1. Borth N., Hu W.S. Enhancing CHO by systems biotechnology. Biotechnol. J. 2018;13:e1800077. - PubMed
    1. Brinkrolf K., Rupp O., Laux H., Kollin F., Ernst W., Linke B., Kofler R., Romand S., Hesse F., Budach W.E., et al. Chinese hamster genome sequenced from sorted chromosomes. Nat. Biotechnol. 2013;31:694–695. - PubMed
    1. Brody Y., Kimmerling R.J., Maruvka Y.E., Benjamin D., Elacqua J.J., Haradhvala N.J., Kim J., Mouw K.W., Frangaj K., Koren A., et al. Quantification of somatic mutation flow across individual cell division events by lineage sequencing. Genome Res. 2018;28:1901–1918. - PMC - PubMed

LinkOut - more resources