. 2022 Mar 14;25(4):104068.
doi: 10.1016/j.isci.2022.104068. eCollection 2022 Apr 15.

Seeing a Bayesian ghost: Sensorimotor activation leads to an illusory social perception

Affiliations

Seeing a Bayesian ghost: Sensorimotor activation leads to an illusory social perception

Elisabeth V C Friedrich et al. iScience. .

Abstract

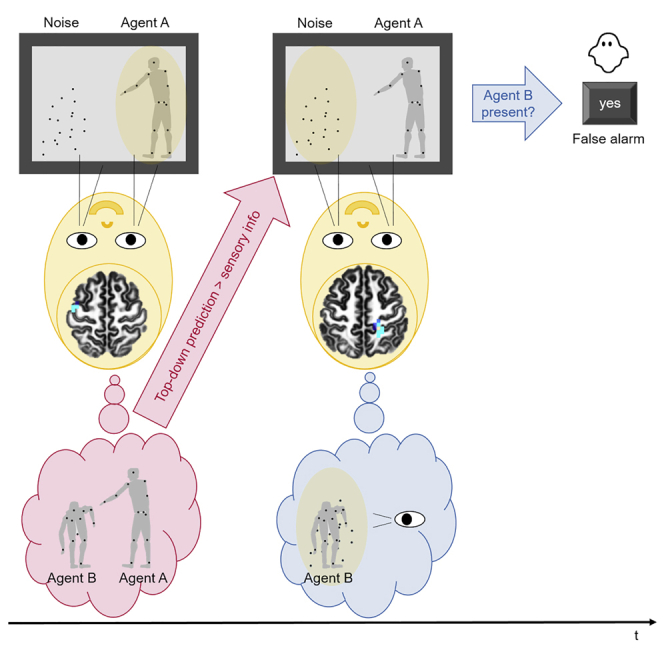
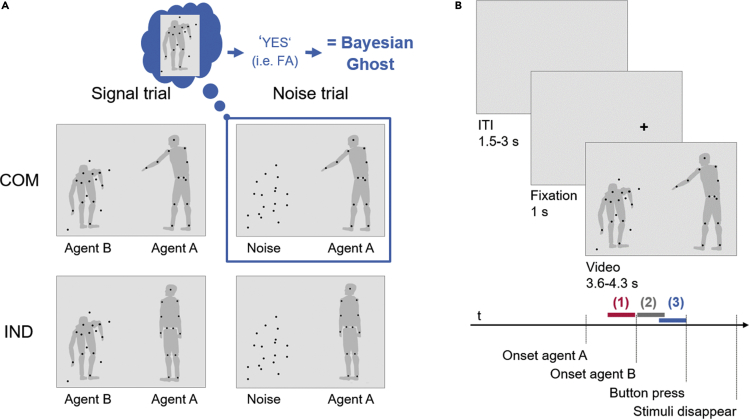
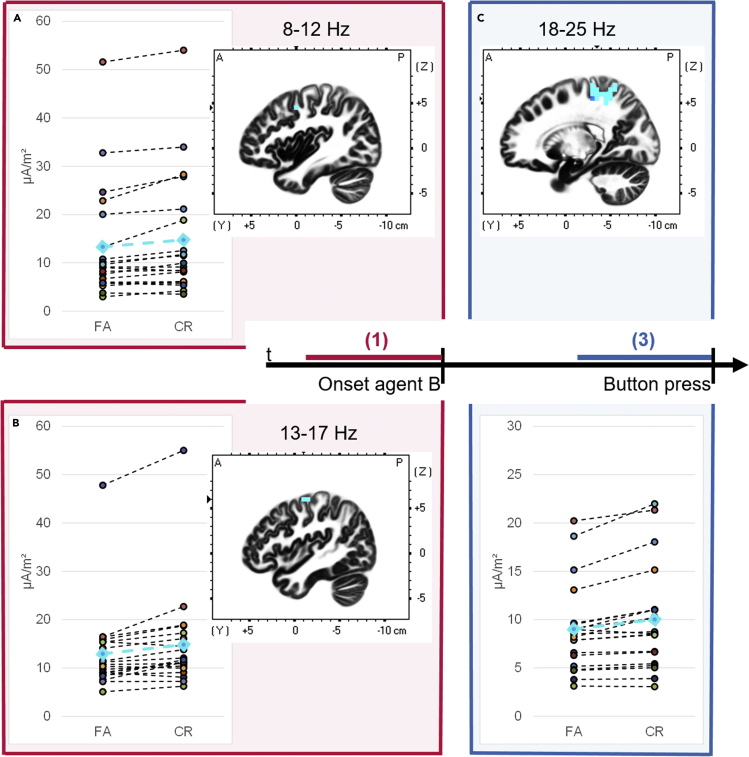
Based on our prior experiences we form social expectations and anticipate another person's response. Under certain conditions, these expectations can be so strong that they lead to illusory perception of another person who is actually not there (i.e., seeing a Bayesian ghost). We used EEG to investigate the neural correlates of such illusory social perception. Our results showed that activation of the premotor cortex predicted the occurrence of the Bayesian ghost, whereas its actual appearance was later accompanied by activation in sensorimotor and adjacent parietal regions. These findings confirm that our perception of others is so strongly affected by prior expectations, in such a way they can prompt illusory social perceptions associated with activity change in brain regions relevant for action perception. They also contribute to a better understanding of social interaction in healthy individuals as well as persons with mental illnesses, which can be characterized by illusory perception and social interaction difficulties.

Keywords: Cognitive neuroscience; Sensory neuroscience; Techniques in neuroscience.


Conflict of interest statement

The authors declare no competing interests.

Figures

None
Graphical abstract
Figure 1
Figure 1
Experimental design (adapted from Zillekens et al. (2019)) (A) Experimental conditions. In the communicative condition (COM; top row), agent A performs a communicative action. In the left panel, agent B is present and reacts in accordance to it (signal trial). In the right panel, agent B is replaced by randomly moving dots (noise trial). In the individual condition (IND; bottom row), agent A performs an individual action. Agent B is again either present (left panel) or replaced by noise (right panel). The gray silhouettes serve illustrative purposes and were not visible for participants. The occurrence of a Bayesian ghost (indicated in blue) is defined by a false alarm (FA) in the communicative noise trial (i.e., the participant indicated that agent B was present when in fact noise dots were presented). The number of false alarms is illustrated in Figure S1. (B) Structure of experimental trials. Jittered inter-trial-intervals (ITI) preceded a fixation cross appearing at the subsequent position of agent A. Following this, the video of the two point-light agents started. The video duration as well as agent B’s onset varied depending on the specific actions performed. The analyzed time segments are illustrated in color: (1) 1-s before agent B’s onset (red): Participants passively observed agent A, who either performed an individual or communicative gesture; (2) 1-s after agent B’s onset (gray): Participants passively watched the responding agent B or noise dots; and (3) 1-s before the response (blue): Participants decided whether the masked agent B was present or absent and indicated their choice with a button press.
Figure 2
Figure 2
Increased sensorimotor activation in false alarm than correct rejection trials in the communicative condition For each of the three significant results (A–C), the significant voxels over participants are indicated in turquoise in the sagittal view of the brain (for other views, please see Figures S2–S4). For the most significant voxel, the power values for every participant as well as for the mean (turquoise points and line) are illustrated in the line chart for the false alarm (FA) and correct rejection (CR) trials. In the time segment (1) before agent B’s onset (in red), a power decrease in false alarm — compared to correct rejection trials — was found in (A) the alpha frequency band (8–12 Hz) in the left frontal lobe, Brodmann Area 6, premotor cortex (peak significance at MNI coordinates: −40/0/45; p < 0.05) and in (B) the lower beta band (13–17 Hz) in the left frontal lobe, Brodmann Area 6, premotor cortex (peak significance at MNI coordinates: −45/−10/60; p < 0.05) with significant activation spreading to voxels in the adjacent primary motor cortex, Brodmann Area 4. (C) In the time segment (3) before the response (in blue), a power decrease in false alarm — compared to correct rejection trials — reached significance in the upper beta band (18–25 Hz) in the right postcentral gyrus, Brodmann Area 3, primary somatosensory cortex (peak significance at MNI coordinates: 20/−35/55; p < 0.05). Significant voxels were also present in the Brodmann Area 2 of the primary somatosensory cortex. In addition, the significant difference spread to the adjacent right precentral gyrus, Brodmann Area 4, primary motor cortex, and to the other following right parietal regions: Brodmann Area 5 (paracentral gyrus, postcentral gyrus), Brodmann Area 7 (postcentral gyrus, superior parietal lobule, precuneus), and Brodmann Area 40 (p < 0.05). For an illustration of the control contrasts false alarm versus correct rejection trials in the individual condition and false alarm versus hit trials in the communicative condition, please refer to the Figures S5–S7.

References

    1. Ansuini C., Cavallo A., Koul A., Jacono M., Yang Y., Becchio C. Predicting object size from hand kinematics: a temporal perspective. PLoS One. 2015;10:e0120432. doi: 10.1371/journal.pone.0120432. - DOI - PMC - PubMed
    1. Arnstein D., Cui F., Keysers C., Maurits N.M., Gazzola V. μ-Suppression during action observation and execution correlates with BOLD in dorsal Premotor, inferior parietal, and SI cortices. J. Neurosci. 2011;31:14243–14249. doi: 10.1523/JNEUROSCI.0963-11.2011. - DOI - PMC - PubMed
    1. Baron-Cohen S., Wheelwright S., Skinner R., Martin J., Clubley E. The Autism Spectrum Quotient : evidence from Asperger syndrome/high functioning autism, males and females, scientists and mathematicians. J. Autism Dev. Disord. 2001;31:5–17. doi: 10.1023/A:1005653411471. - DOI - PubMed
    1. Benwell C.S.Y., Coldea A., Harvey M., Thut G. Low pre-stimulus EEG alpha power amplifies visual awareness but not visual sensitivity. Eur. J. Neurosci. 2021;00:1–16. doi: 10.1111/ejn.15166. - DOI - PubMed
    1. Bimbi M., Festante F., Coudé G., Vanderwert R.E., Fox N.A., Ferrari P.F. Simultaneous scalp recorded EEG and local field potentials from monkey ventral premotor cortex during action observation and execution reveals the contribution of mirror and motor neurons to the mu-rhythm. Neuroimage. 2018;175:22–31. doi: 10.1016/j.neuroimage.2018.03.037. - DOI - PMC - PubMed

LinkOut - more resources