. 2022 Mar 10:13:816598.
doi: 10.3389/fendo.2022.816598. eCollection 2022.

Identification of MAGEC2/CT10 as a High Calcium-Inducible Gene in Triple-Negative Breast Cancer

Affiliations

Identification of MAGEC2/CT10 as a High Calcium-Inducible Gene in Triple-Negative Breast Cancer

Heather K Beasley et al. Front Endocrinol (Lausanne). .

Abstract

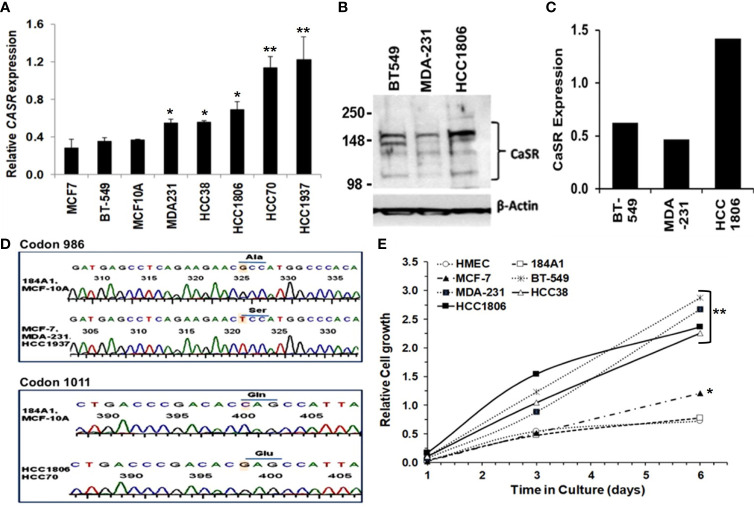
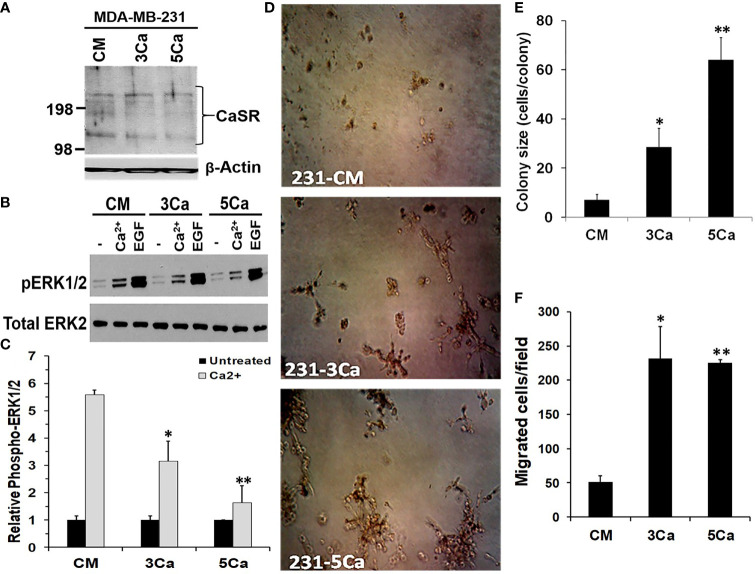
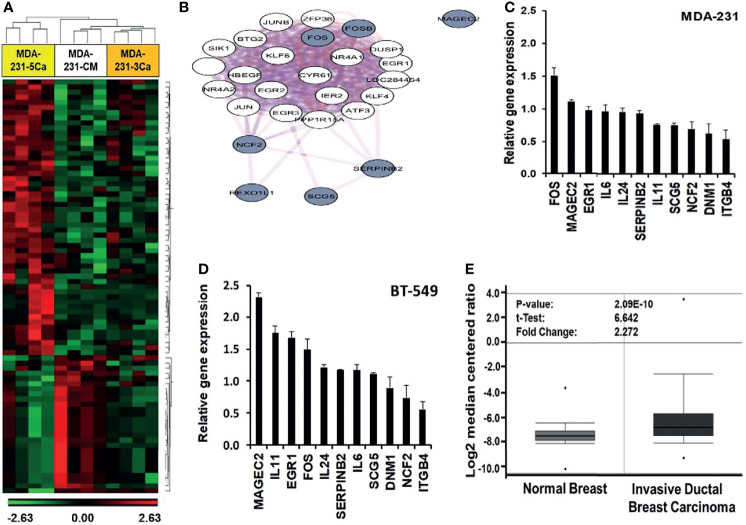
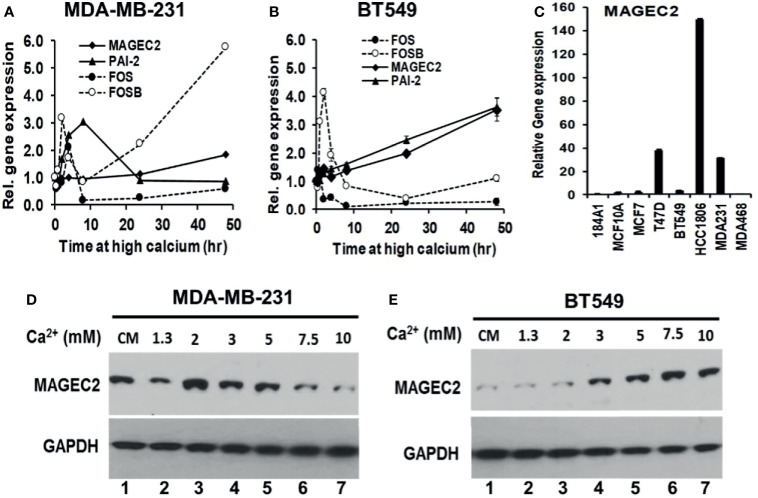
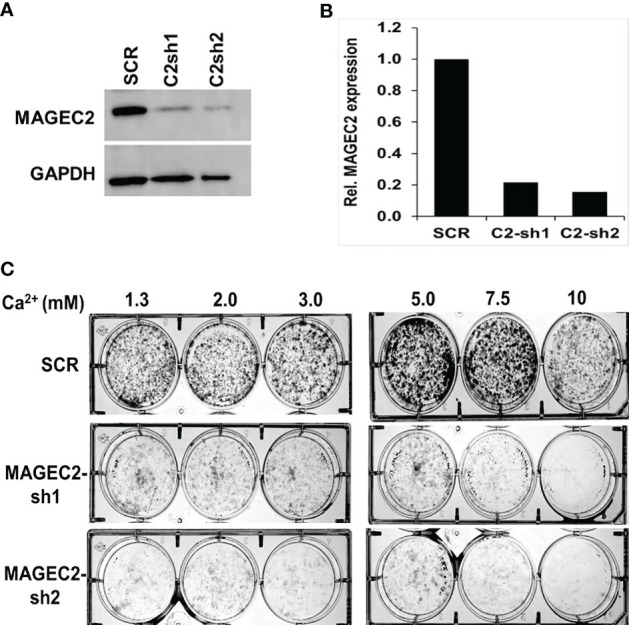
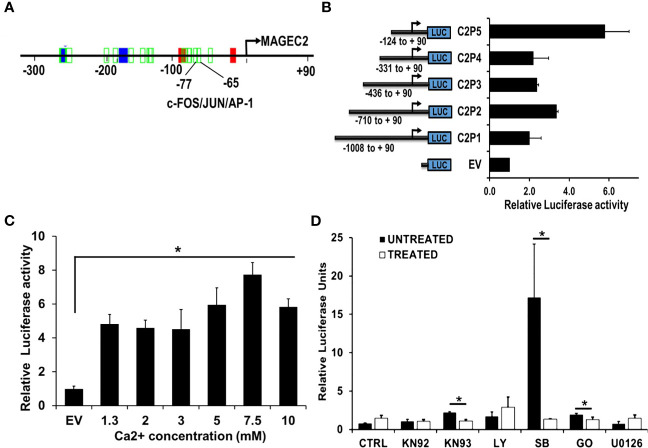
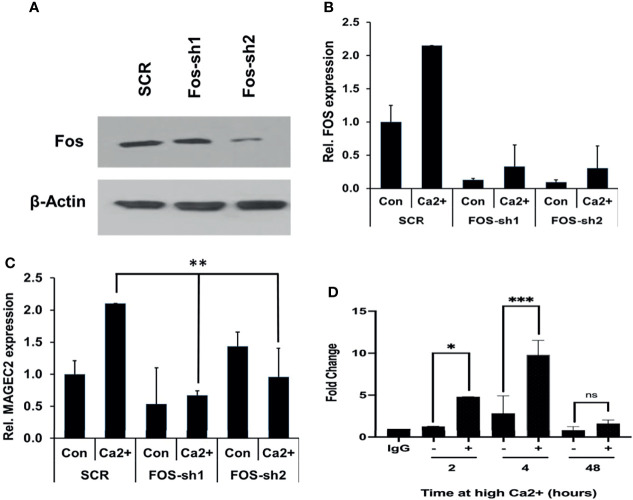
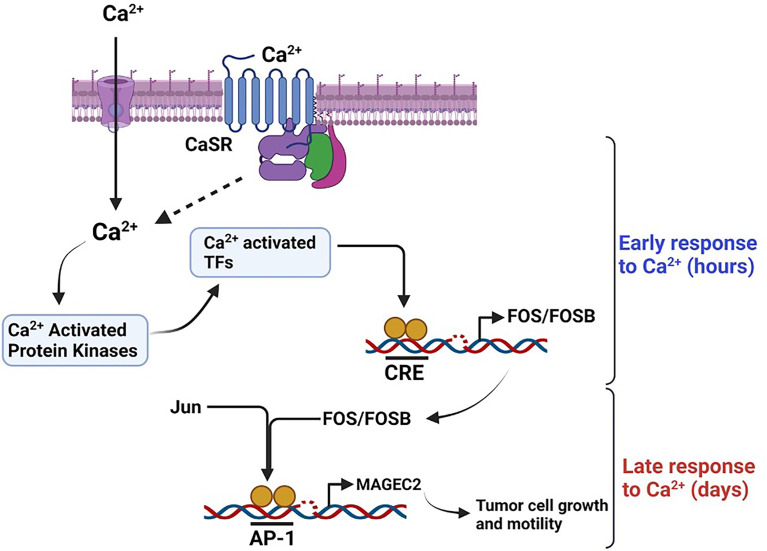
The expression of the melanoma/cancer-testis antigen MAGEC2/CT10 is restricted to germline cells, but like most cancer-testis antigens, it is frequently upregulated in advanced breast tumors and other malignant tumors. However, the physiological cues that trigger the expression of this gene during malignancy remain unknown. Given that malignant breast cancer is often associated with skeletal metastasis and co-morbidities such as cancer-induced hypercalcemia, we evaluated the effect of high Ca2+ on the calcium-sensing receptor (CaSR) and potential mechanisms underlying the survival of triple-negative breast cancer (TNBC) cells at high Ca2+. We show that chronic exposure of TNBC cells to high Ca2+ decreased the sensitivity of CaSR to Ca2+ but stimulated tumor cell growth and migration. Furthermore, high extracellular Ca2+ also stimulated the expression of early response genes such as FOS/FOSB and a unique set of genes associated with malignant tumors, including MAGEC2. We further show that the MAGEC2 proximal promoter is Ca2+ inducible and that FOS/FOSB binds to this promoter in a Ca2+- dependent manner. Finally, downregulation of MAGEC2 strongly inhibited the growth of TNBC cells in vitro. These data suggest for the first time that MAGEC2 is a high Ca2+ inducible gene and that aberrant expression of MAGEC2 in malignant TNBC tissues is at least in part mediated by an increase in circulating Ca2+via the AP-1 transcription factor.

Keywords: AP-1; MAGEC2; TNBC; breast cancer; calcium signaling; calcium-sensing receptor; cell motility; cell proliferation.


Conflict of interest statement

The authors declare that the research was conducted in the absence of any commercial or financial relationships that could be construed as a potential conflict of interest.

Figures

Figure 1
Figure 1
Significance of CaSR variants in the growth and sensitivity of breast cancer cells to high Ca2+. (A) Expression of CASR in breast epithelial and breast cancer cell lines was assessed by reverse transcriptase and real-time PCR (RT-PCR). (B, C) Basal expression of CaSR in the indicated breast cancer cells was assessed by western blotting (B) and quantified by using the NIH ImageJ software (C). (D) Genotyping of exon 7 mutations in breast epithelial and breast cancer cells by DNA sequencing of a 524 bp fragment. Shown are chromatograms depicting changes of the nucleotide sequence at codons 986 (Ala to Ser) and 1011 (Gln to Glu). (E) Effect of high Ca2+ on the growth of breast epithelial and breast cancer cells in vitro. Cell proliferation/viability was assessed by using the PrestoBlue cell viability reagent. * denotes p < 0.05, ** denotes p < 0.01.
Figure 2
Figure 2
High calcium adaptation of breast cancer cells is associated with reduced sensitivity of CaSR to extracellular Ca2+ but promotes cell growth and motility. (A) MDA-MB-231 cells were cultured in complete medium supplemented with 3.0 or 5.0 mM Ca2+ for up to 6 weeks. The expression of CaSR in the Ca2+ adapted cells was assessed by western blotting; β-actin was used as the loading control. (B) The Control, 3.0 and 5.0 mM Ca2+ adapted MDA-MB-231 cells were treated with EGF (50 ng/ml) or high Ca2+ (5.0 mM) for 10 mins and the activation of ERK1/2 assessed by western blotting. (C) The protein bands representing phosphorylated ERK1/2 were quantified by using the NIH ImageJ. Bares represent active ERK1/2 relative to untreated control from independent experiments. (D, E) Control, 3.0 and 5.0 mM Ca2+ adapted MDA-MB-231 cells were seeded at 1000 cells/well in 96 well plates on growth factor reduced Matrigel and cultured in complete medium for up to 10 days. Cell colonies were captured microscopically using a digital camera (D) and colony sizes were assessed by manually counting the cells in each colony (E). (F) Migration of Ca2+ adapted cells. Control, 3.0 and 5.0 mM Ca2+ adapted MDA-MB-231 cells in serum free medium were cultured for 24 h in Boyden chamber inserts and serum free medium containing 5.0 mM Ca2+ was used as the chemoattractant. Shown are the migrated cells/field from at least three independent fields. * denotes p < 0.05, ** denotes p < 0.01.
Figure 3
Figure 3
Induction of early response and malignancy associated genes as a response of breast cancer cells to sustained high Ca2+. (A) Heatmap of Gene expression profiling of high Ca2+ treated MDA-MB-231 cells. (B) Biological network relationship of up regulated (high Ca2+ inducible) genes (hashed nodes), pink edges are physical interactions and purple edges are co-expression associations (https://genemania.org/). (C, D) Validation of high Ca2+ inducible genes by RT-PCR in MDA-MB-231 (C) and BT-549 (D) TNBC cells. (E) Expression of MAGEC2 in normal breast (n = 61) and invasive ductal breast carcinoma (n = 396) was analyzed in the TCGA Breast dataset in oncomine.
Figure 4
Figure 4
Induction of MAGEC2 expression by high extracellular calcium in TNBC cells. (A, B) Cells were cultured in complete medium with or without high Ca2+ (5.0 mM) for up to 48 h. Cells were harvested and total RNA extracted, and used for RT-PCR. Each point represents the expression of the indicated genes relative to GAPDH for MDA-MB-231 (A) and BT-549 (B) TNBC cells. (C) Total RNA was isolated from the indicated cell lines cultured in their respective complete media and the basal levels of MAGEC2 assessed by RT-PCR. (D, E) MDA-MB-231 (D) and BT-549 (E) TNBC cells were cultured in complete medium supplemented with the indicated concentrations of Ca2+, for 48 h. Cells were harvested and the expression of MAGEC2 protein was analyzed by western blotting.
Figure 5
Figure 5
Effect of MAGEC2 down regulation on the growth of TNBC cells in vitro. (A) BT-549 cells were transfected with control (SCR) or shRNA plasmids (MAGEC2-sh1 and MAGEC2-sh2) targeting MAGEC2. The expression of MAGEC2 was confirmed by western blotting. (B) The protein bands were quantified using the NIH ImageJ software. (C) Control and MAGEC2 down regulated cells were cultured in complete medium supplemented with the indicated concentrations of Ca2+ and cultured for up to 10 days. Cells were fixed and stained with crystal violet and the images were digitally captured.
Figure 6
Figure 6
The proximal MAGEC2 promoter is activated by high Ca+. (A) The AP-1 transcription factor binding site on the proximal promoter of MAGEC2 was identified by using the Promo V3 software. B) The proximal promoter fragments of MAGEC2 truncated as indicated were cloned into pGL4 basic, then used to transfect HEK293T cells. For luciferase activity, HEK293T cells transfected with the empty vector (EV) or the MAGEC2 truncated promoter fragments and Renilla luciferase expressing vector (for transfection control) were cultured in complete medium with or without high (5.0 mM) Ca2+. Luciferase expression at high Ca2+ was assessed relative to the control. (C) HEK293T cells transfected with C2P5 from (B) above were cultured in complete medium supplemented with the indicated concentrations of Ca2+ and the luciferase activity assessed as in (B) above. (D) HEK293 T cells transfected as in (B, C) above were cultured in complete medium and high Ca2+ with or without the indicated inhibitors. Luciferase activity was measured 48 h post treatment as in (B) above. Luciferase activity as normalized to the DMSO control. EV: empty vector; DMSO: Dimethylsufoxide vehicle control; UNT (untreated, drug free); KN92: inactive Ca2+/camodulin kinase inhibitor; KN93 active Ca2+/camodulin kinase inhibitor; LY: LY 294002, PI3 kinase inhibitor; SB: SB 203580 p38 MAP kinase inhibitor; GO: Gö 6976, Ca2+ dependent PKC inhibitor; U0126, MEK inhibitor. * denotes p < 0.05, ** denotes p < 0.01, *** denoted p < 0.0001. Statistical significance was determined by Student’s T-Test and two-way ANOVA, where (B, C) were quantified to have a statistical significance of </= 0.05.
Figure 7
Figure 7
High Ca2+-induced expression of MAGEC2 is attenuated following downregulation of cFOS. (A) BT-549 cells were transfected with control (SCR) or shRNA plasmids (FOS-sh1 and FOS-sh2) targeting c-FOS. The expression of c-FOS was confirmed by western blotting. (B, C) BT-549 cells transfected with control or c-FOS targeting shRNAs were cultured in complete medium without (Con) or with high Ca2+ (Ca2+) for 48 h. The cells were harvested and the expression of c-FOS (C) and MAGEC2 (D) assessed by RT-PCR. (D) Parental BT-549 cells were grown to 70-80% confluency, then treated with or without high Ca2+ for the indicated times. Cells were subsequently cross-linked and processed for ChIP assays as described in materials and methods using antibodies against c-FOS. Purified DNA fragments were analyzed by real-time PCR and presented as fold change relative to IgG control. Con, complete medium control; Ca2+, complete medium supplemented with high Ca2+. * denotes p < 0.05, ** denotes p < 0.001, *** denotes p < 0.0001, ns denotes not significant.
Figure 8
Figure 8
Schematic diagram depicting the effect of high Ca2+ on the expression of MAGEC2 in TNBC cells. High extracellular Ca2+ acting via the CaSR provokes store operated Ca2+ entry, the subsequent surge in intracellular Ca2+activates Ca2+ activated kinase such as conventional PKC isoforms which in turn activate immediate early Ca2+ activated transcription factors such as CREB/ATF4. These transcription factors lead to the expression of early response genes such as c-FOS which upon dimerization with Jun proteins bind to the AP-1 site on target genes such as MAGEC2 and provoke their transcription. Up regulation of MAGEC2 may then facilitate the adaptation of the cells to high Ca2+ and enhance their growth and metastatic properties.

Similar articles

Cited by

References

    1. Carey LA, Perou CM, Livasy CA, Dressler LG, Cowan D, Conway K, et al. . Race, Breast Cancer Subtypes, and Survival in the Carolina Breast Cancer Study. JAMA (2006) 295:2492. doi: 10.1001/jama.295.21.2492 - DOI - PubMed
    1. Siddharth S, Sharma D. Racial Disparity and Triple-Negative Breast Cancer in African-American Women: A Multifaceted Affair Between Obesity, Biology, and Socioeconomic Determinants. Cancers (2018) 10:514. doi: 10.3390/cancers10120514 - DOI - PMC - PubMed
    1. Coleman RE. Metastatic Bone Disease: Clinical Features, Pathophysiology and Treatment Strategies. Cancer Treat Rev (2001) 27:165–76. doi: 10.1053/ctrv.2000.0210 - DOI - PubMed
    1. Coleman RE. Clinical Features of Metastatic Bone Disease and Risk of Skeletal Morbidity. Clin Cancer Res (2006) 12:6243s–9s. doi: 10.1158/1078-0432.CCR-06-0931 - DOI - PubMed
    1. Coleman R, Rubens R. The Clinical Course of Bone Metastases From Breast Cancer. Br J Cancer (1987) 55:61–6. doi: 10.1038/bjc.1987.13 - DOI - PMC - PubMed