

Two-Week Central Macular Thickness Reduction Rate >37% Predicts the Long-Term Efficacy of Anti-vascular Endothelial Growth Factor Treatment for Macular Edema Secondary to Retinal Vein Occlusion
- PMID: 35355596
- PMCID: PMC8959117
- DOI: 10.3389/fmed.2022.851238
Two-Week Central Macular Thickness Reduction Rate >37% Predicts the Long-Term Efficacy of Anti-vascular Endothelial Growth Factor Treatment for Macular Edema Secondary to Retinal Vein Occlusion
Abstract
Objective: To determine if the early response assessments can predict the long-term efficacy of anti-vascular endothelial growth factor (VEGF) treatment for macular edema secondary to retinal vein occlusion (RVO-ME).
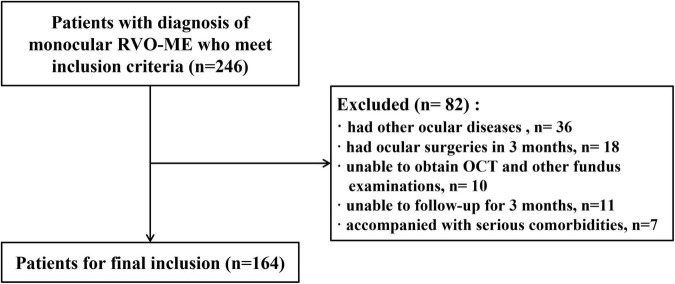
Methods: A retrospective study of patients with diagnosis of RVO-ME and intravitreal anti-VEGF treatment was conducted. Clinical characteristics including age, gender, disease subtype and disease duration were recorded at baseline. The best corrected visual acuity (BCVA and logMAR), intraocular pressure (IOP), and central macular thickness (CMT) were recorded at baseline, 2 weeks, and every month (months 1-6) after injection. Further, we compared the early response assessments between the cured group (6-month CMT ≤ 250 μm) and the uncured group (6-month CMT > 250 μm).
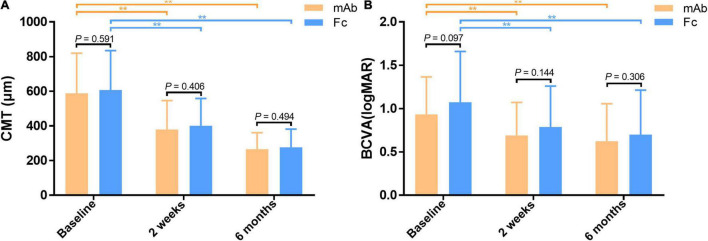
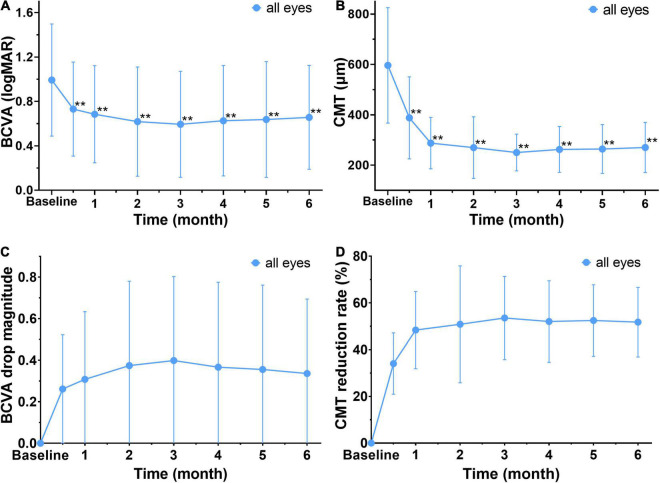
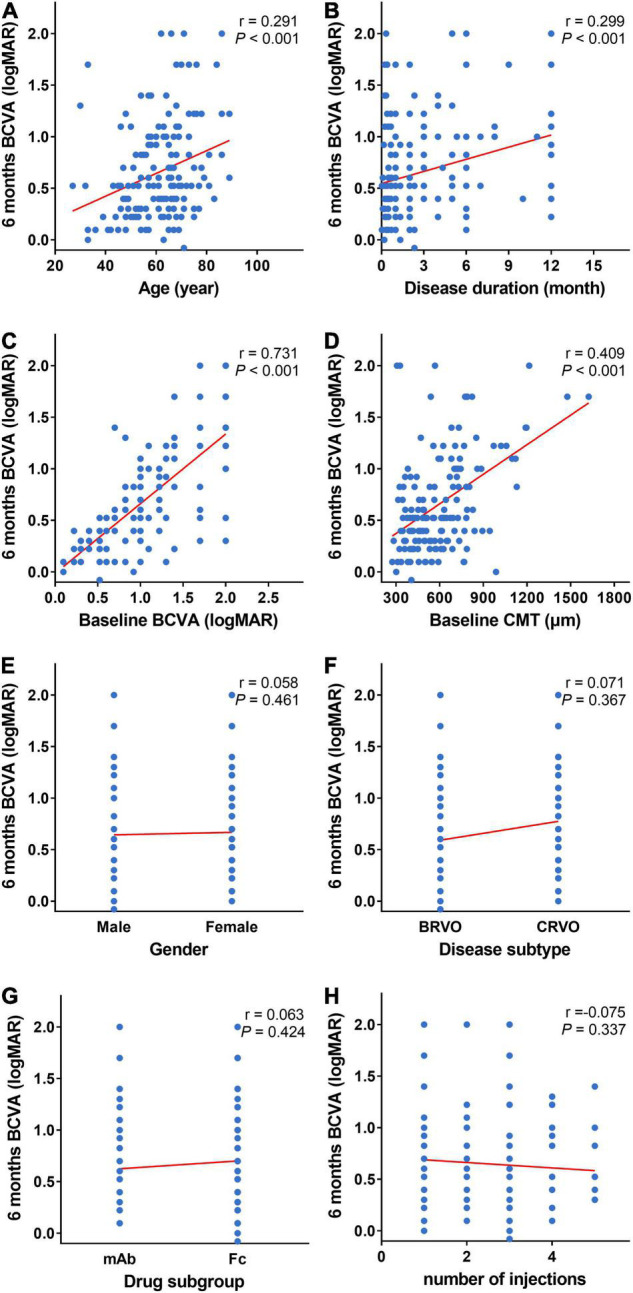
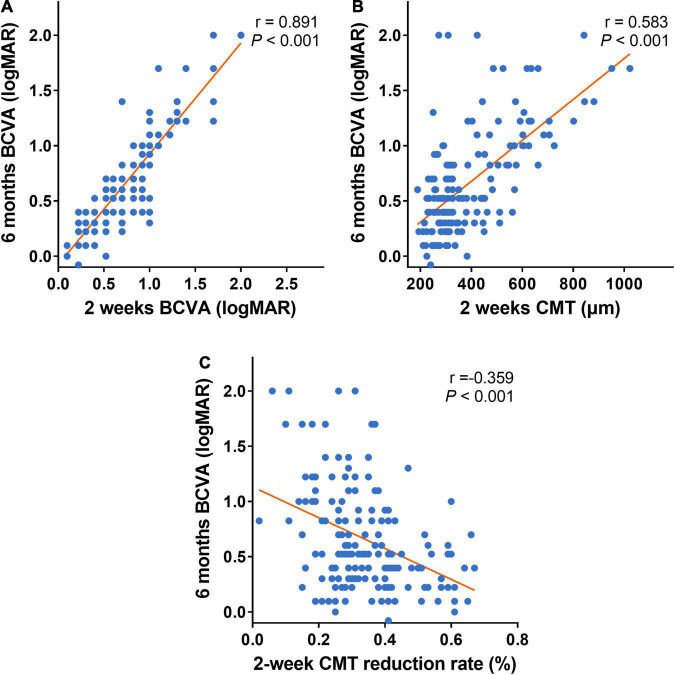
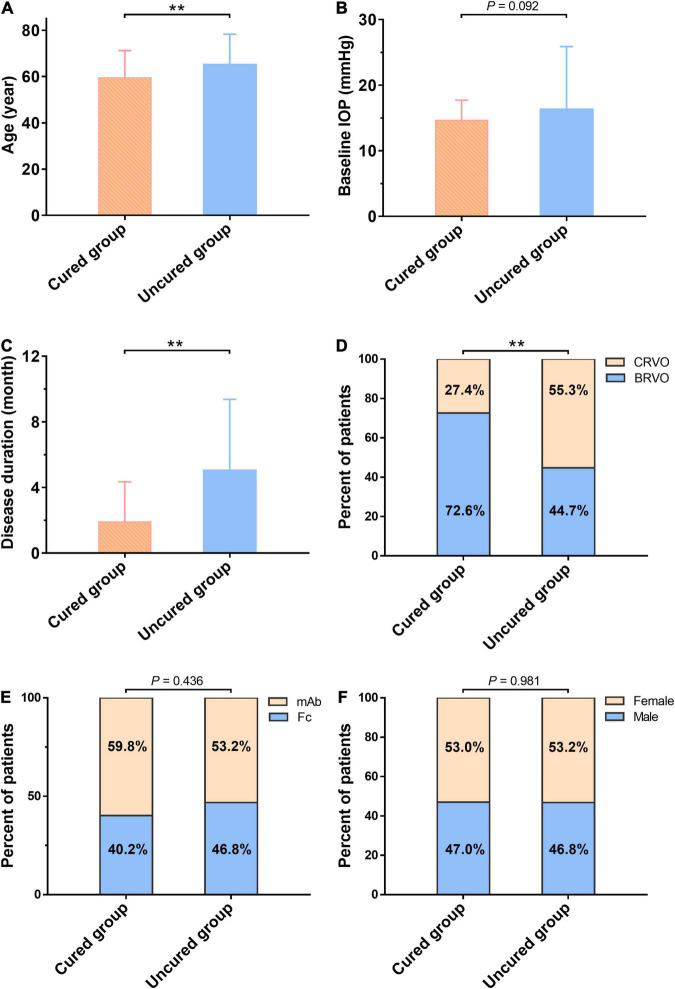
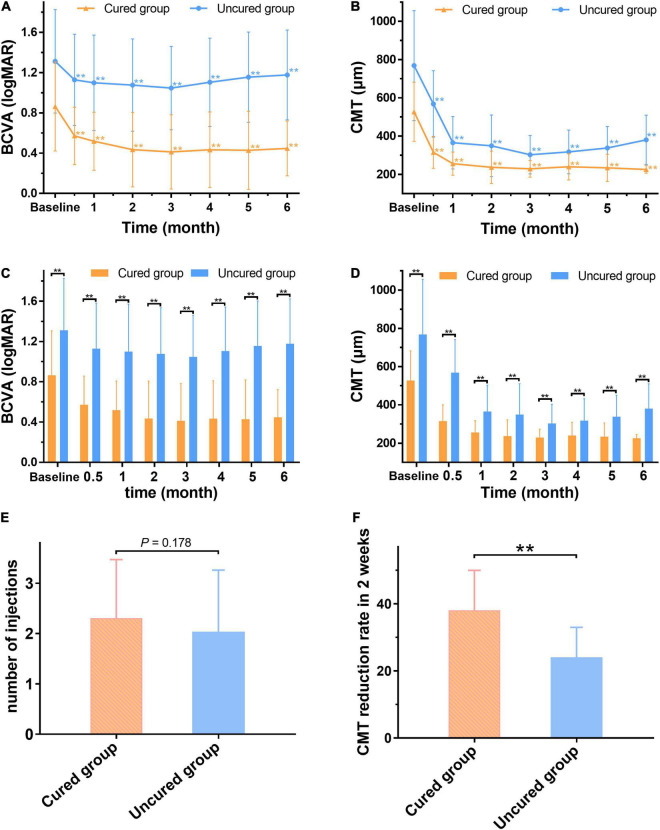
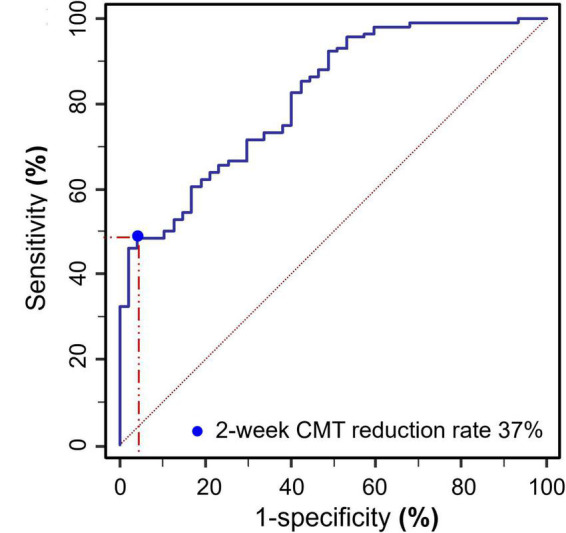
Results: A total of 164 eyes in 164 patients (77 male and 87 female) were included. At each post-injection time point, both BCVA and CMT are significantly decreased from baseline (all P < 0.001). Spearman's test showed that 2-week CMT reduction rate after the first injection was negatively correlated with BCVA at 6 months (r = -0.359, P < 0.001). Compared with the uncured group (47 cases), the cured group (117 cases) was younger (59.53 ± 11.68 vs. 65.19 ± 13.10 years old, P < 0.01), had more BRVO patients (76.1% vs. 44.7%, P < 0.01), a shorter disease duration (1.92 ± 2.43 vs. 5.05 ± 4.32 months, P < 0.01), lower baseline CMT (527.09 ± 154.95 vs. 768.96 ± 287.75 μm, P < 0.01), and lower baseline BCVA (0.86 ± 0.44 vs. 1.31 ± 0.51, P < 0.01). At each post-injection time point, the cured group had lower CMT and BCVA values when compared to the uncured group (all P < 0.01), and the 2-week CMT reduction rate was identified as the earliest response time to predict the long-term treatment efficacy. Moreover, ROC curve analysis indicated that a 2-week CMT reduction rate >37% yielded the best cut-off point for predicting the long-term cure of anti-VEGF treatment at 6 months (P < 0.001). Multivariable logistic regression confirmed that the 2-week CMT reduction rate >37% was independently associated with the 6-month cured rate (OR = 9.639, 95% Cl = 1.030-90.227, P = 0.047).
Conclusion: Age, disease duration, baseline CMT, and baseline BCVA are associated with visual outcomes at 6-month of anti-VEGF treatment for RVO-ME. The "2-week CMT reduction rate >37%" after the first injection is an independent factor to predict better long-term outcomes.
Keywords: anti-vascular endothelial growth factor (anti-VEGF); central macular thickness (CMT); early response assessments; macular edema (ME); retinal vein occlusion (RVO).
Copyright © 2022 Zhou, Ma, Zhou, Wang, Li, Luo, Cai, Li and Liu.
Conflict of interest statement
The authors declare that the research was conducted in the absence of any commercial or financial relationships that could be construed as a potential conflict of interest.
Figures
Similar articles
-
Efficacy and safety of dexamethasone intravitreal implant in patients with retinal vein occlusion resistant to anti-VEGF therapy: a 12-month prospective study.Cutan Ocul Toxicol. 2019 Dec;38(4):330-337. doi: 10.1080/15569527.2019.1614020. Epub 2019 May 27. Cutan Ocul Toxicol. 2019. PMID: 31060385 Clinical Trial.
-
Clinical Use of Dexamethasone Implants in Resistant Macular Edema Secondary to Branch Retinal Vascular Occlusion Compared with Intravitreal Anti-Vascular Endothelial Growth Factor.Beyoglu Eye J. 2019 Apr 10;4(1):11-16. doi: 10.14744/bej.2019.63835. eCollection 2019. Beyoglu Eye J. 2019. PMID: 35187425 Free PMC article.
-
Efficacy and effectiveness of anti-VEGF or steroids monotherapy versus combination treatment for macular edema secondary to retinal vein occlusion: a systematic review and meta-analysis.BMC Ophthalmol. 2022 Dec 6;22(1):472. doi: 10.1186/s12886-022-02682-7. BMC Ophthalmol. 2022. PMID: 36474156 Free PMC article.
-
Efficacy of intravitreal triamcinolone for the treatment of macular edema secondary to branch retinal vein occlusion in eyes with or without grid laser photocoagulation.Retina. 2008 Mar;28(3):465-72. doi: 10.1097/IAE.0b013e318154b9d1. Retina. 2008. PMID: 18327140
-
Outcomes of Anti-VEGF Therapy in Eyes with Diabetic Macular Edema, Vein Occlusion-Related Macular Edema, and Neovascular Age-Related Macular Degeneration: A Systematic Review.Clin Ophthalmol. 2024 Dec 17;18:3837-3851. doi: 10.2147/OPTH.S489114. eCollection 2024. Clin Ophthalmol. 2024. PMID: 39717563 Free PMC article. Review.
Cited by
-
Radiomics Analysis Based on Optical Coherence Tomography to Prognose the Efficacy of Anti-VEGF Therapy of Retinal Vein Occlusion-Related Macular Edema.Invest Ophthalmol Vis Sci. 2025 Apr 1;66(4):74. doi: 10.1167/iovs.66.4.74. Invest Ophthalmol Vis Sci. 2025. PMID: 40277425 Free PMC article.
References
-
- Trovato Battagliola E, Pacella F, Malvasi M, Scalinci SZ, Turchetti P, Pacella E, et al. Risk factors in central retinal vein occlusion: a multi-center case-control study conducted on the Italian population : demographic, environmental, systemic, and ocular factors that increase the risk for major thrombotic events in the retinal venous system. Eur J Ophthalmol. (2021). 10.1177/11206721211064469 [Epub ahead of print]. - DOI - PubMed
-
- Pacella F, Pacella E, Trovato Battagliola E, Malvasi M, Scalinci SZ, Turchetti P, et al. Efficacy and safety of intravitreal fluocinolone acetonide microimplant (ILUVIEN(§)) in patients with chronic diabetic macular edema: 1 year follow-up. Eur J Ophthalmol. (2021). 10.1177/11206721211020203 [Epub ahead of print]. - DOI - PubMed
LinkOut - more resources
Full Text Sources