

Yishen Qingli Heluo Granule in the Treatment of Chronic Kidney Disease: Network Pharmacology Analysis and Experimental Validation
- PMID: 35355655
- PMCID: PMC8959874
- DOI: 10.2147/DDDT.S348335
Yishen Qingli Heluo Granule in the Treatment of Chronic Kidney Disease: Network Pharmacology Analysis and Experimental Validation
Abstract
Background: Chronic kidney disease (CKD) is considered a global public health problem with high morbidity and mortality. Yishen Qingli Heluo granule (YQHG) is representative traditional Chinese medicine (TCM) remedy for clinical treatment of CKD. This study aims to explore the mechanism of YQHG on CKD through network pharmacology and experimental validation.
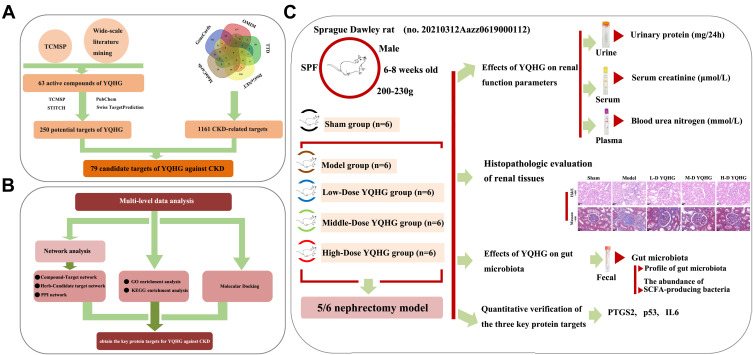
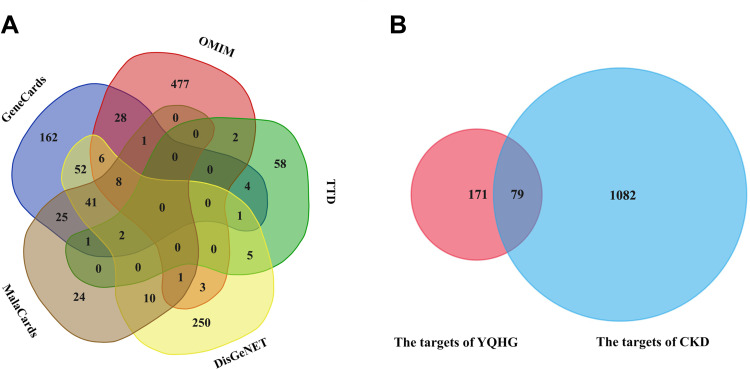
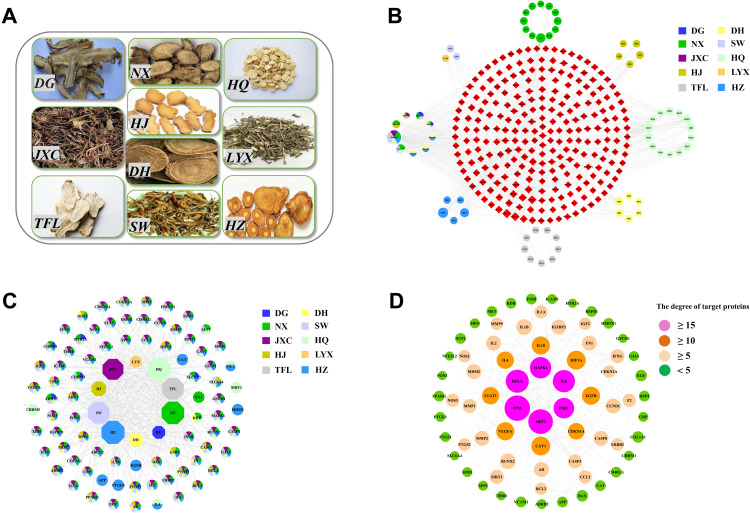
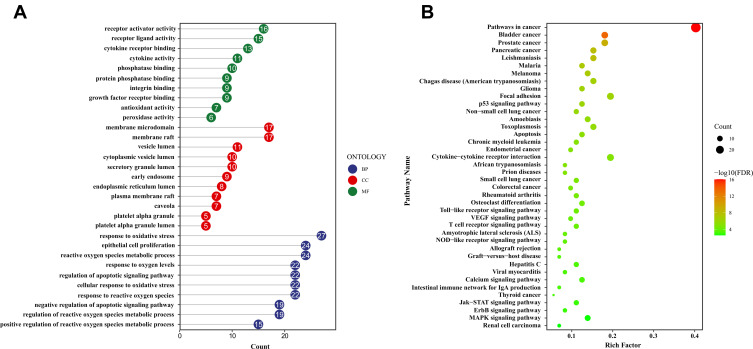
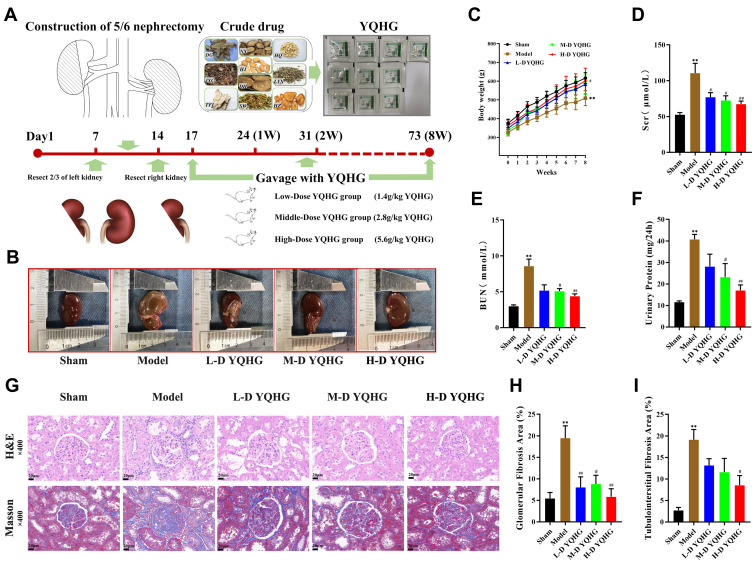
Methods: Traditional Chinese Medicine Systems Pharmacology (TCMSP) database and wide-scale literature mining were applied to screen active compounds of YQHG. Multiple bioinformatic tools and online databases were applied by us to obtain relevant targets of YQHG and CKD. The intersection targets between YQHG and CKD were considered as candidate targets. The compound-target, herb-candidate target and protein-protein interaction networks were constructed and visualized for topological analyses. GO and KEGG enrichment analyses were conducted to determine the biological processes and signaling pathways. Molecular docking was used to verify the reliability of network pharmacology. Finally, pharmacological evaluation was performed to explore the mechanism of YQHG against CKD on a 5/6 nephrectomy model.
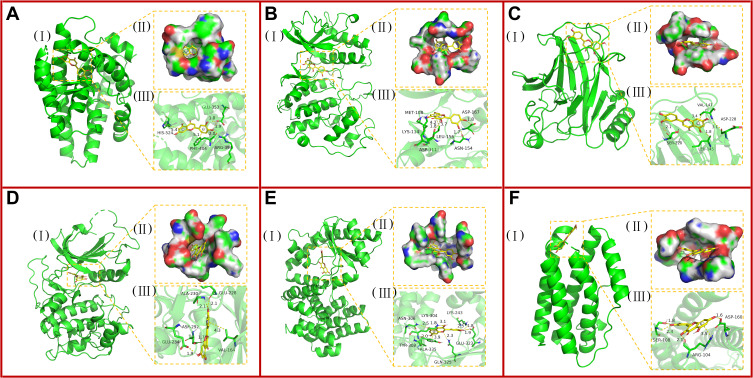
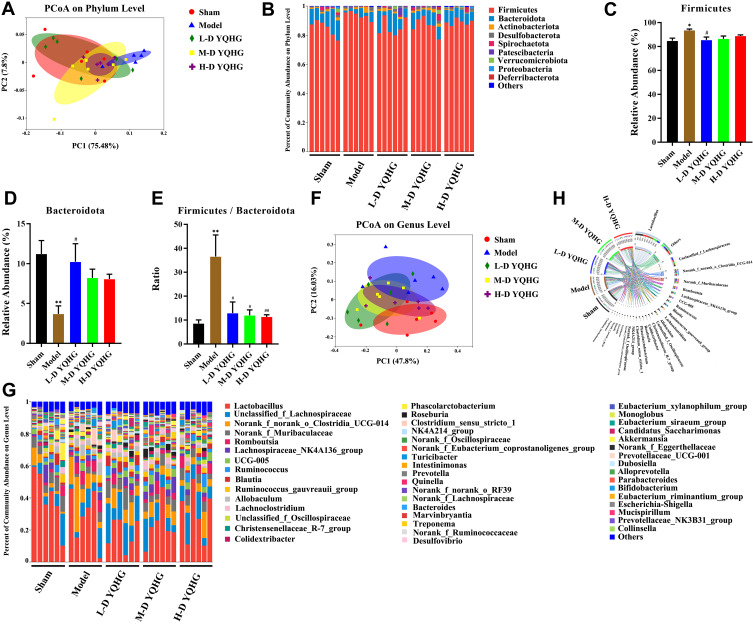
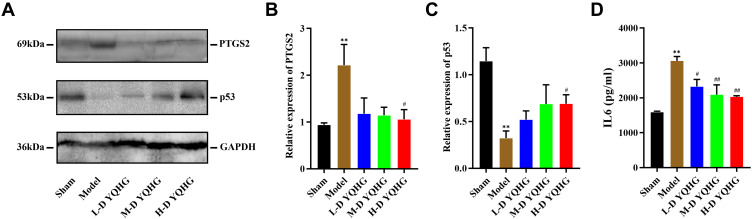
Results: Seventy-nine candidate targets, ten core biological processes and one key signaling pathway (p53) were screened. PTGS2 was identified as a key target based on H-CT network. The molecular docking showed that Quercetin, Kaempferol, Luteolin were three key compounds with the best binding activity. In addition, IL6 and Quercetin could form a stable complex with high binding affinity (-7.29 kcal/mol). In vivo experiment revealed that YQHG improved kidney function and fibrosis in 5/6 nephrectomized rats. Moreover, the decreased expression of PTGS2, IL6, and the increased expression of p53 were observed in kidney tissue. Notably, the gut microbiota of rats treated with YQHG was reshaped, which was characterized by a reduced ratio of Firmicutes/Bacteroidota.
Conclusion: Our results predicted and verified the potential targets of YQHG on CKD from a holistic perspective, and provided valuable direction for the further research of YQHG.
Keywords: 5/6 nephrectomy; Yishen Qingli Heluo granule; chronic kidney disease; gut microbiota; network pharmacology.
© 2022 Sun et al.
Conflict of interest statement
All authors declare no conflicts of interest.
Figures

Similar articles
-
Yishen Qingli Heluo Granule Ameliorates Renal Dysfunction in 5/6 Nephrectomized Rats by Targeting Gut Microbiota and Intestinal Barrier Integrity.Front Pharmacol. 2022 Jun 22;13:858881. doi: 10.3389/fphar.2022.858881. eCollection 2022. Front Pharmacol. 2022. PMID: 35814258 Free PMC article.
-
The Therapeutic Mechanisms of Shenyan Oral Liquid I Against Chronic Kidney Disease Based on Network Pharmacology and Experimental Validation.Comb Chem High Throughput Screen. 2024;27(19):2885-2898. doi: 10.2174/0113862073260994231031070916. Comb Chem High Throughput Screen. 2024. PMID: 37961861
-
Fufang Shenhua tablet inhibits renal fibrosis by inhibiting PI3K/AKT.Phytomedicine. 2023 Jul 25;116:154873. doi: 10.1016/j.phymed.2023.154873. Epub 2023 May 13. Phytomedicine. 2023. PMID: 37257328
-
Exploration of the mechanism of Zisheng Shenqi decoction against gout arthritis using network pharmacology.Comput Biol Chem. 2021 Feb;90:107358. doi: 10.1016/j.compbiolchem.2020.107358. Epub 2020 Aug 8. Comput Biol Chem. 2021. PMID: 33243703 Review.
-
Network Pharmacology and Experimental Validation to Reveal the Pharmacological Mechanisms of Chongcaoyishen Decoction Against Chronic Kidney Disease.Front Mol Biosci. 2022 Mar 31;9:847812. doi: 10.3389/fmolb.2022.847812. eCollection 2022. Front Mol Biosci. 2022. PMID: 35433831 Free PMC article. Review.
Cited by
-
Traditional Chinese Medicine: An Exogenous Regulator of Crosstalk between the Gut Microbial Ecosystem and CKD.Evid Based Complement Alternat Med. 2022 Dec 10;2022:7940684. doi: 10.1155/2022/7940684. eCollection 2022. Evid Based Complement Alternat Med. 2022. PMID: 36536867 Free PMC article. Review.
-
Molecular characterization of PANoptosis-related genes in chronic kidney disease.PLoS One. 2024 Oct 28;19(10):e0312696. doi: 10.1371/journal.pone.0312696. eCollection 2024. PLoS One. 2024. PMID: 39466748 Free PMC article.
-
Qigui-Yishen decoction delays renal fibrosis in mice with chronic kidney disease by regulating TM and PAI-1.Am J Transl Res. 2024 Jun 15;16(6):2358-2368. doi: 10.62347/GHOV4912. eCollection 2024. Am J Transl Res. 2024. PMID: 39006289 Free PMC article.
-
Impact of gut microbiota in chronic kidney disease: natural polyphenols as beneficial regulators.Ren Fail. 2025 Dec;47(1):2506810. doi: 10.1080/0886022X.2025.2506810. Epub 2025 May 29. Ren Fail. 2025. PMID: 40441674 Free PMC article. Review.
-
Association between consumption of flavonol and its subclasses and chronic kidney disease in US adults: an analysis based on National Health and Nutrition Examination Survey data from 2007-2008, 2009-2010, and 2017-2018.Front Nutr. 2024 Jun 18;11:1399251. doi: 10.3389/fnut.2024.1399251. eCollection 2024. Front Nutr. 2024. PMID: 38957868 Free PMC article.
References
-
- Bikbov B, Purcell CA, Levey AS; GBD Chronic Kidney Disease Collaboration. Global, regional, and national burden of chronic kidney disease, 1990–2017: a systematic analysis for the Global Burden of Disease Study 2017. Lancet. 2020;395(10225):709–733. doi:10.1016/S0140-6736(20)30045-3 - DOI - PMC - PubMed
MeSH terms
Substances
LinkOut - more resources
Full Text Sources
Medical
Research Materials
Miscellaneous
