Review
. 2022 Jul;9(3):032206.
doi: 10.1117/1.NPh.9.3.032206. Epub 2022 Mar 21.

Hybrid fiber optic-fMRI for multimodal cell-specific recording and manipulation of neural activity in rodents

Affiliations
Review

Hybrid fiber optic-fMRI for multimodal cell-specific recording and manipulation of neural activity in rodents

Horea-Ioan Ioanas et al. Neurophotonics. 2022 Jul.

Abstract

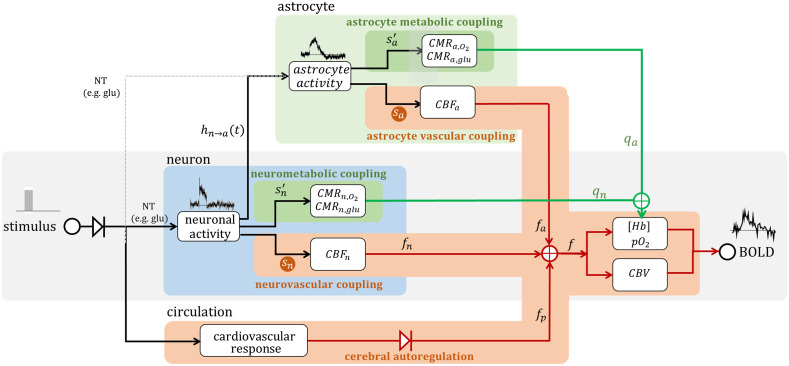
Significance: Multiscale imaging holds particular relevance to neuroscience, where it helps integrate the cellular and molecular biological scale, which is most accessible to interventions, with holistic organ-level evaluations, most relevant with respect to function. Being inextricably interdisciplinary, multiscale imaging benefits substantially from incremental technology adoption, and a detailed overview of the state-of-the-art is vital to an informed application of imaging methods. Aim: In this article, we lay out the background and methodological aspects of multimodal approaches combining functional magnetic resonance imaging (fMRI) with simultaneous optical measurement or stimulation. Approach: We focus on optical techniques as these allow, in conjunction with genetically encoded proteins (e.g. calcium indicators or optical signal transducers), unprecedented read-out and control specificity for individual cell-types during fMRI experiments, while leveraging non-interfering modalities. Results: A variety of different solutions for optical/fMRI methods has been reported ranging from bulk fluorescence recordings via fiber photometry to high resolution microscopy. In particular, the plethora of optogenetic tools has enabled the transformation of stimulus-evoked fMRI into a cell biological interrogation method. We discuss the capabilities and limitations of these genetically encoded molecular tools in the study of brain phenomena of great methodological and neuropsychiatric interest-such as neurovascular coupling (NVC) and neuronal network mapping. We provide a methodological description of this interdisciplinary field of study, and focus in particular on the limitations of the widely used blood oxygen level dependent (BOLD) signal and how multimodal readouts can shed light on the contributions arising from neurons, astrocytes, or the vasculature. Conclusion: We conclude that information from multiple signaling pathways must be incorporated in future forward models of the BOLD response to prevent erroneous conclusions when using fMRI as a surrogate measure for neural activity. Further, we highlight the potential of direct neuronal stimulation via genetically defined brain networks towards advancing neurophysiological understanding and better estimating effective connectivity.

Keywords: functional magnetic resonance imaging; multimodal; neuroimaging; neuroscience; optics; optogenetics; technology.


Figures

Fig. 1
Fig. 1
Fiber photometry is based on an advanced yet robust multicomponent system leveraging optical fiber light transmission to separate MR and optical instrumentation. A laser beam is coupled into a fiber-optic patch cable that is connected to an implant on the mouse; fluorescent emissions are guided back through the same fiber; the entire optical setup is located outside of the MR scanner room. MRI volumes, the fluorescence time course, and the stimulation protocol are then combined in offline analysis. Abbreviations: PMT, photomultiplier tube; EF, emission filter; DM, dichroic mirror; CL, coupling lens; FP, fiber port; ND, neutral density; DAQ, data acquisition device. Adapted from Ref. .
Fig. 2
Fig. 2
Graphical representation of a single-session opto-fMRI workflow, highlighting its sequential integration of optogenetics and fMRI. Panels show (a) the usage of a transgenic strain expressing Cre recombinase, (b) viral vector delivery of an optogenetic construct using the Cre/LoxP system and optical cannula implantation targeting the entire transfected system, and (c) fMRI measurement with concurrent light stimulation. Green represents cells with Cre expression (green arrows indicate structural projections), dark gray dots represent optogenetic construct expression, cyan represents light stimulation and light-evoked postsynaptic activity at the stimulation site, and pink represents MR signal. Figure adapted from Ref. , with permission.
Fig. 3
Fig. 3
Schematic of cellular interactions mediating neurovascular coupling. Excitatory input triggers synaptic release of glutamate (Glu), which activates neuronal NMDA-R as well as astrocytic ion channels and metabotropic Glu receptors (e.g., mGluR5), prompting the release of vasodilator substances such as NO, EETs, PGs. The vasoactive compounds interact with capillary pericytes (and arteriole and pial artery smooth muscle cells). Local capillary dilation may also result from direct interaction with EC and then be backpropagated to feeding arteries/arterioles via hyperpolarization and mediators such as NO.
Fig. 4
Fig. 4
Neuronal and astrocytic signals differ in time course, adding up to the cumulative BOLD response. Forepaw stimulation a mouse under ketamine/xylazine anesthesia, stimulated in 8 s blocks (gray shaded area), with an internal frequency of 3 Hz, an amplitude of 0.7 mA, and a pulse duration of 0.5 ms. (a) Normalized Ca2+ transients of neuron (blue) and astrocyte (green) population. Note poststimulus undershoot in astrocytic Ca2+ response. (b) BOLD response with black dots indicating experimental data points and thick black solid fitted curve comprising weighted contributions from neurons (blue) and astrocytes (green) contribution as derived from Ca2+ recordings convolved with the respective HRF. The HRFs were assumed as cell-type specific gamma-variate functions. Adapted from Skachokova et al. 2021 (pending publication), with permission.
Fig. 5
Fig. 5
The canonical balloon model can be augmented to comprehensively account for signal modulation sources from the NVU. Depicted is an extended balloon model integration non-neuronal contributions to the BOLD signal with the originally proposed model (gray shading). The stimulus pulse train prompts both neuronal and astrocytic activation (as illustrated by the Ca2+ transient) which lead to a respective change in CBF (fn, fa) and changes in oxygen consumption (qn, qa). These effects are lumped into cell-type specific HRF (HRFn, HRFa, see Fig. 4). In addition, stimulus-evoked changes in cardiac output (heart rate and/or blood pressure) may overrule cerebral autoregulation, prompting a nonspecific CBF response (fp), which adds to the overall BOLD response.
Fig. 6
Fig. 6
Opto-fMRI can be leveraged to image multimodal activity patterns elicited by widely projecting neuronal systems with low endogenous activity profiles. Optogenetics permits both neurotransmitter-specific selectivity, which can be used to target specific neuronal subpopulations, as well as high-amplitude signal enhancement, which can drive network population to sufficiently high levels of activity, as to be clearly modeled in time-resolved fMRI data. Depicted are (a), (b) both population-level activity maps, showing uniform and divergent valence of responses, respectively, as well as (c) a subject-level signal trace example. (a) Population-level t-statistical map of right VTA dopaminergic neuronal stimulation. Figure adapted from Ref. , with permission. (b) Population-level t-statistical map of dorsal raphe nucleus serotonergic neuronal stimulation. Figure adapted from Ref. , with permission. (c) Single-subject time course of mean signal from the dorsal raphe nucleus region of interest, during optogenetic stimulation of serotonergic neurons. The CBV signal trace is shown in blue, the response regressor (used to estimate the amplitudes mapped in (b) trace is shown in orange, and the response amplitude decay trace is shown in green. Figure adapted from reference analysis results of the SAMRI package.,
Fig. 7
Fig. 7
Opto-fMRI provides macroscopic resolution disambiguation of cell biological processes Depicted are neuronal schematics showing a somatic compartment and a synaptic compartment, as these may be seen in fMRI (distance between voxels not to scale). Depending on the statistical contrast of the stimulation as well as on the the neuronal system targeted, such different voxels may be more distant than the spatial autocorrelation range of fMRI—thus capturing potentially different responses in different cellular compartments. Such a difference may be seen in Fig. 6(b), where the red coded somatic voxel would correspond to the read heatmap voxels in the midbrain, and the blue coded voxel would correspond to the blue heatmap voxels in the cortex. The neuronal schematic showcases cell biological processes, such as neurotransmitter synthesis, anterograde synaptic transmission, autoinhibition, neurotransmitter reuptake, and degradation, laid out over cell compartments. Neurotransmitters and precursors are color-coded green and proteins involved in the aforementioned processes are coded gray. Figure adapted from Ref. , with permission.

Similar articles

Cited by

References

    1. Kwong K. K., et al. , “Dynamic magnetic resonance imaging of human brain activity during primary sensory stimulation,” Proc. Natl. Acad. Sci. U. S. A. 89(12), 5675–5679 (1992).PNASA610.1073/pnas.89.12.5675 - DOI - PMC - PubMed
    1. Ogawa S., et al. , “Oxygenation-sensitive contrast in magnetic resonance image of rodent brain at high magnetic fields,” Magn. Reson. Med. 14(1), 68–78 (1990).MRMEEN10.1002/mrm.1910140108 - DOI - PubMed
    1. Ogawa S., et al. , “Intrinsic signal changes accompanying sensory stimulation: functional brain mapping with magnetic resonance imaging,” Proc. Natl. Acad. Sci. U. S. A. 89(13), 5951–5955 (1992).PNASA610.1073/pnas.89.13.5951 - DOI - PMC - PubMed
    1. Marota J. J.A., et al. , “Investigation of the early response to rat forepaw stimulation,” Magn. Reson. Med. 41(2), 247–252 (1999).MRMEEN10.1002/(SICI)1522-2594(199902)41:2<247::AID-MRM6>3.0.CO;2-U - DOI - PubMed
    1. Lieke E. E., et al. , “Optical imaging of cortical activity: real-time imaging using extrinsic dye-signals and high resolution imaging based on slow intrinsic-signals,” Annu. Rev. Physiol. 51(1), 543–559 (1989).ARPHAD10.1146/annurev.ph.51.030189.002551 - DOI - PubMed