

The key role of the latent N-H group in Milstein's catalyst for ester hydrogenation
- PMID: 35355805
- PMCID: PMC8901127
- DOI: 10.1039/d1sc00703c
The key role of the latent N-H group in Milstein's catalyst for ester hydrogenation
Abstract
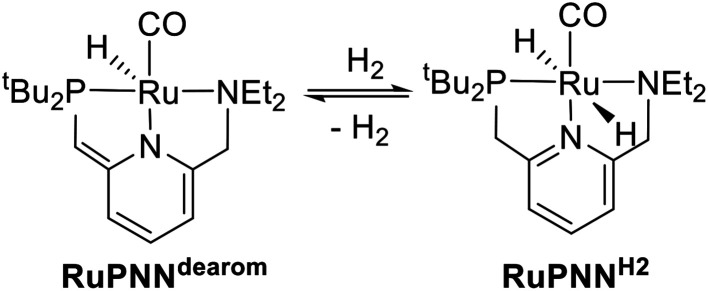
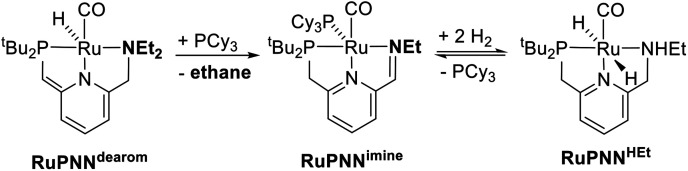
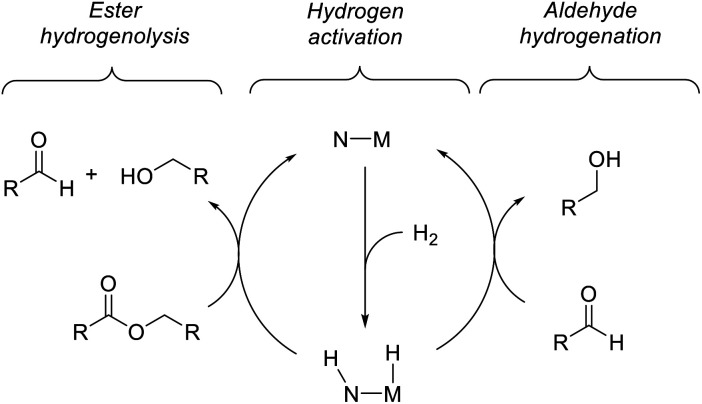
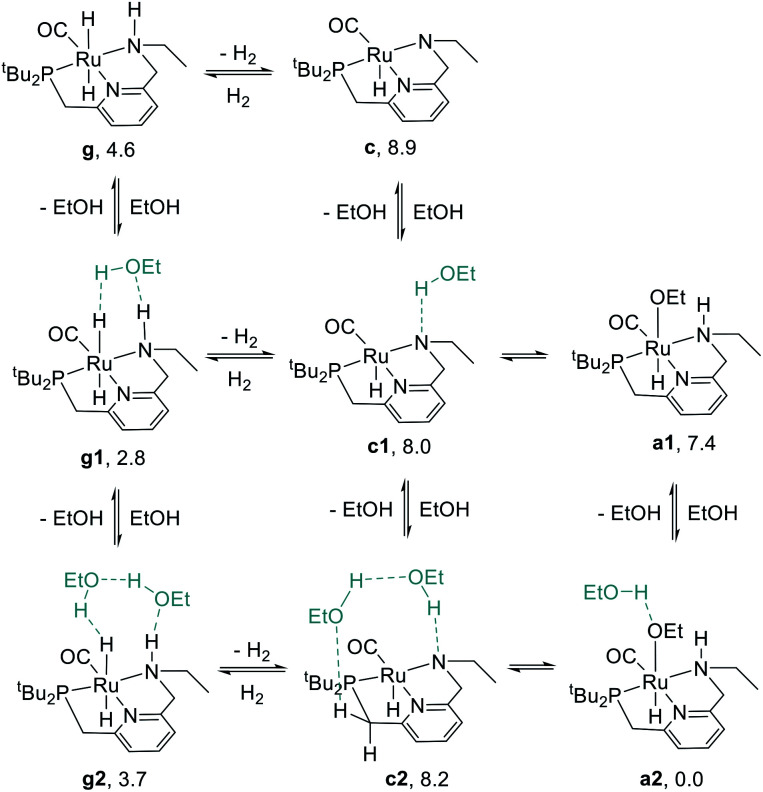
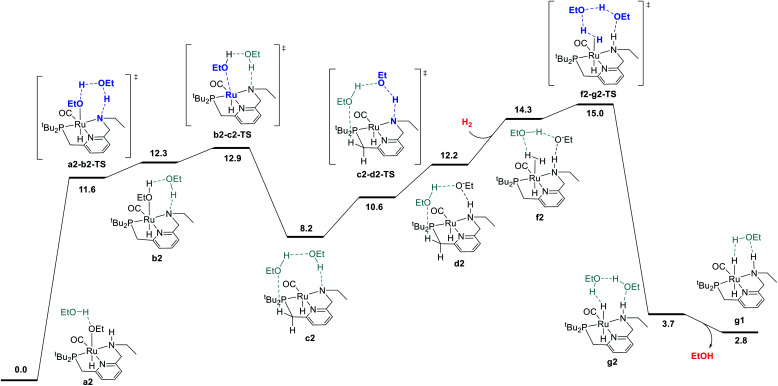
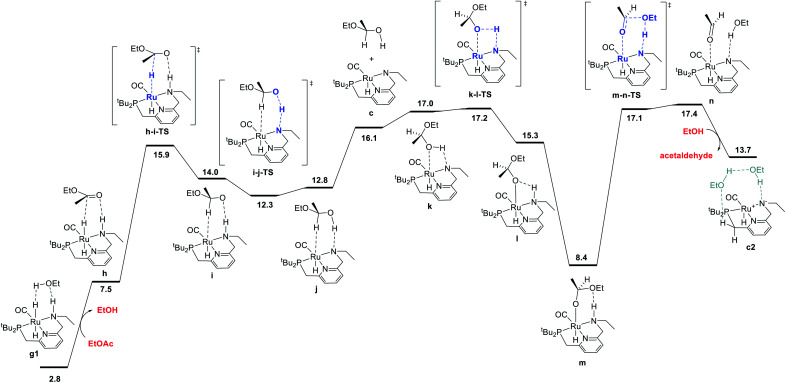
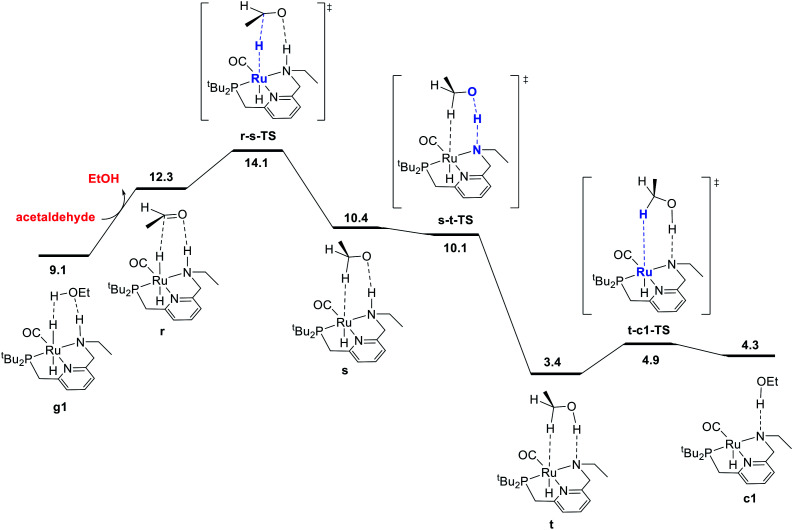
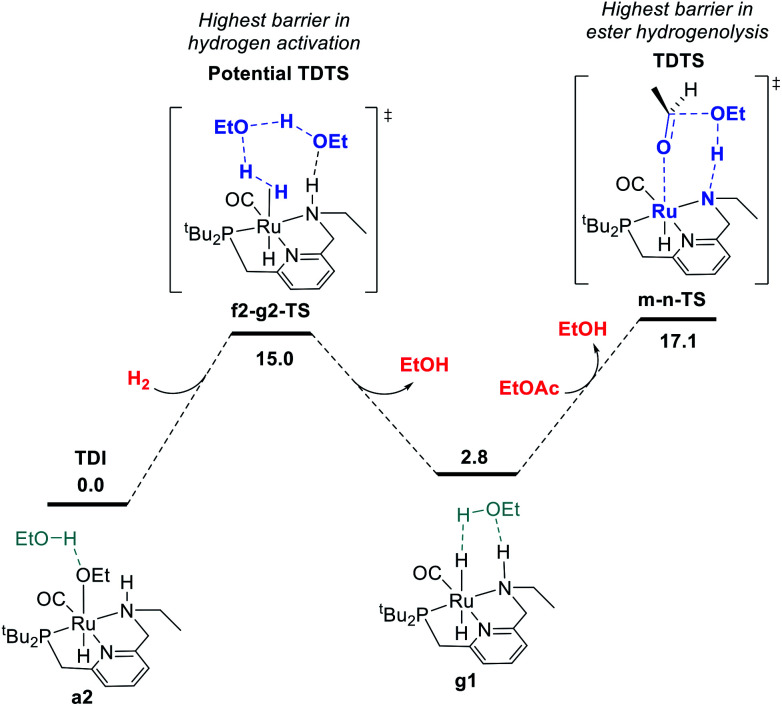
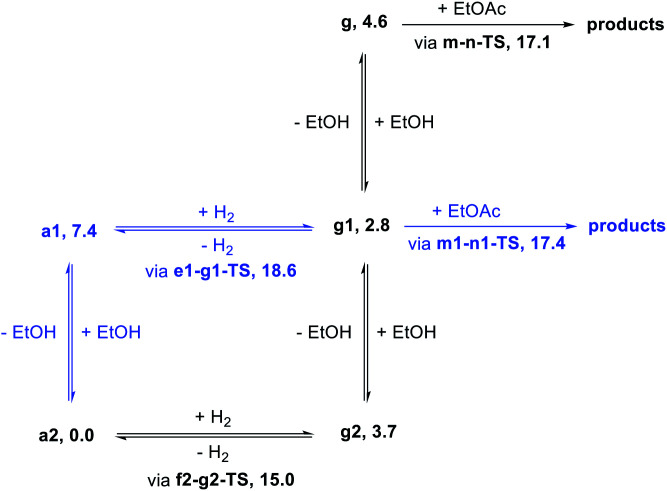
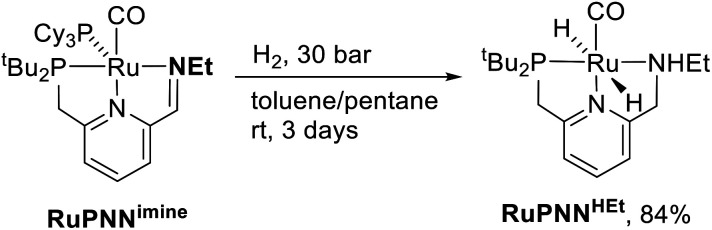
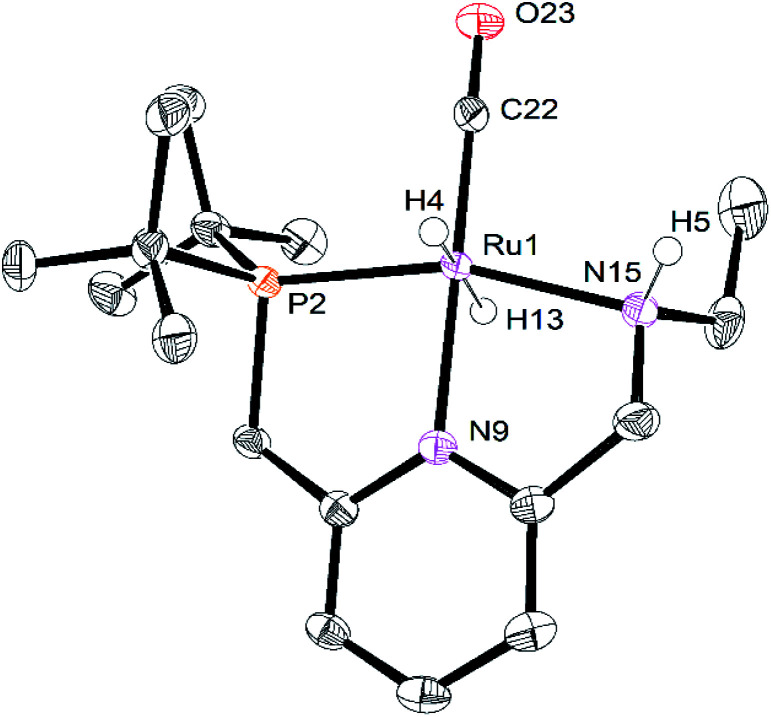
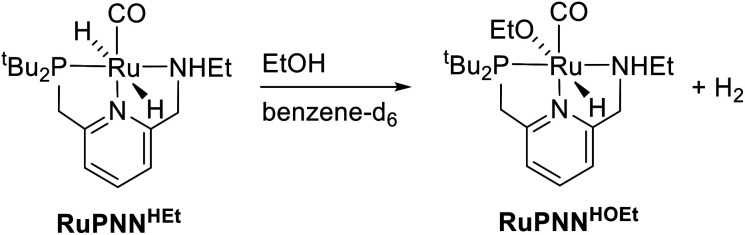
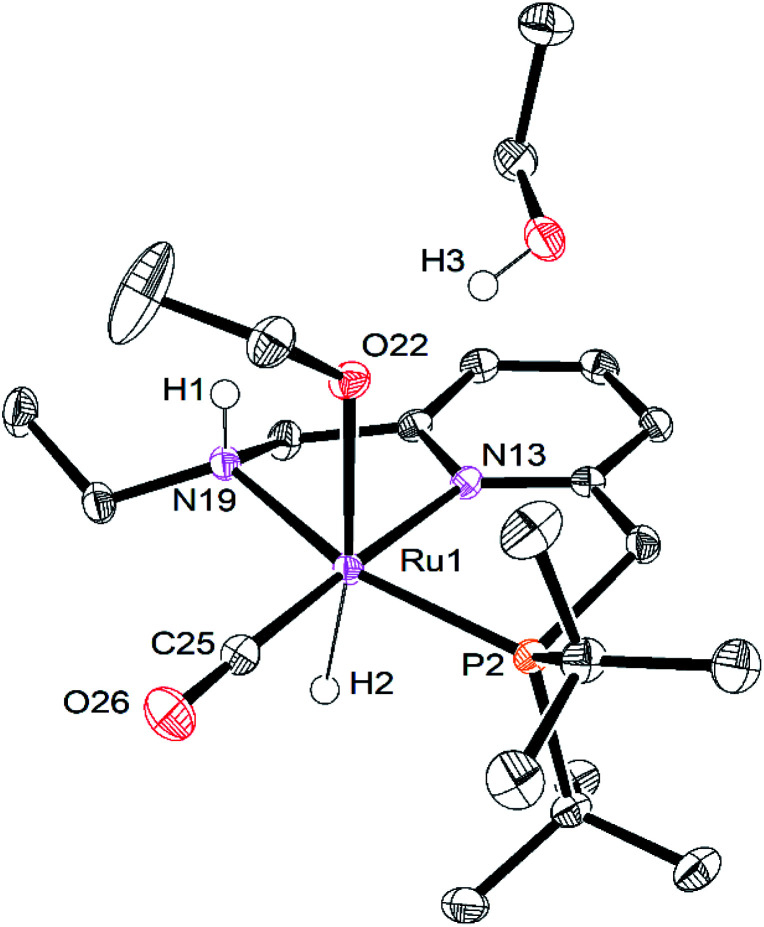
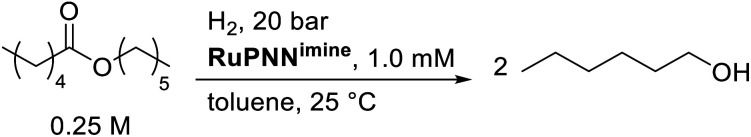
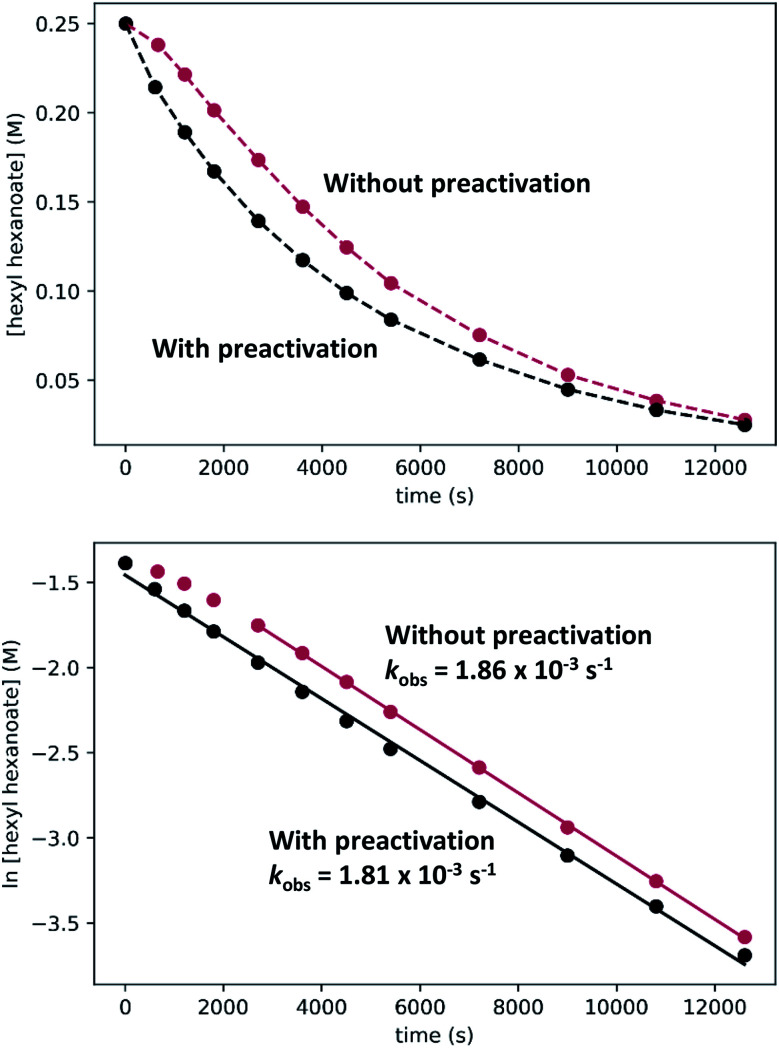
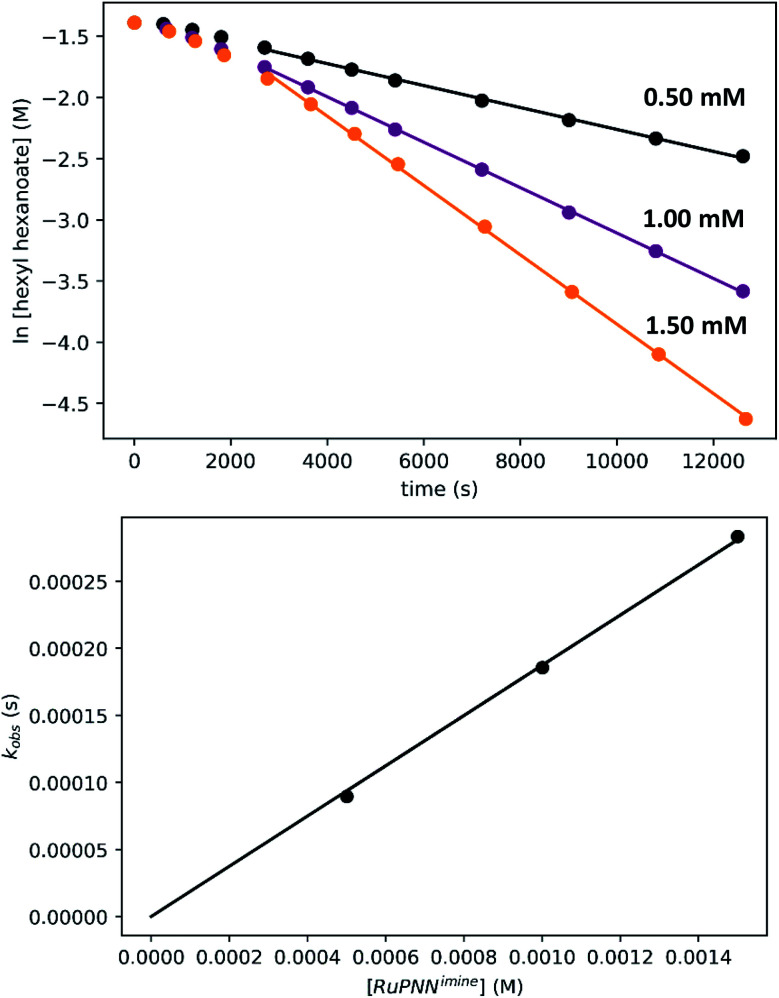
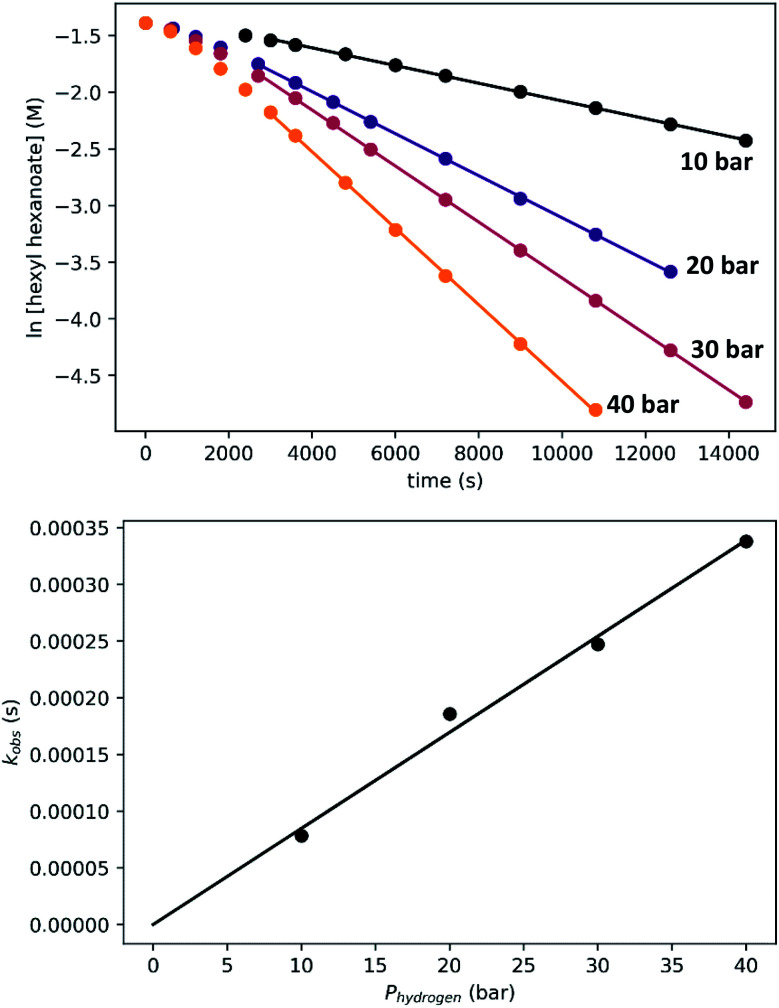
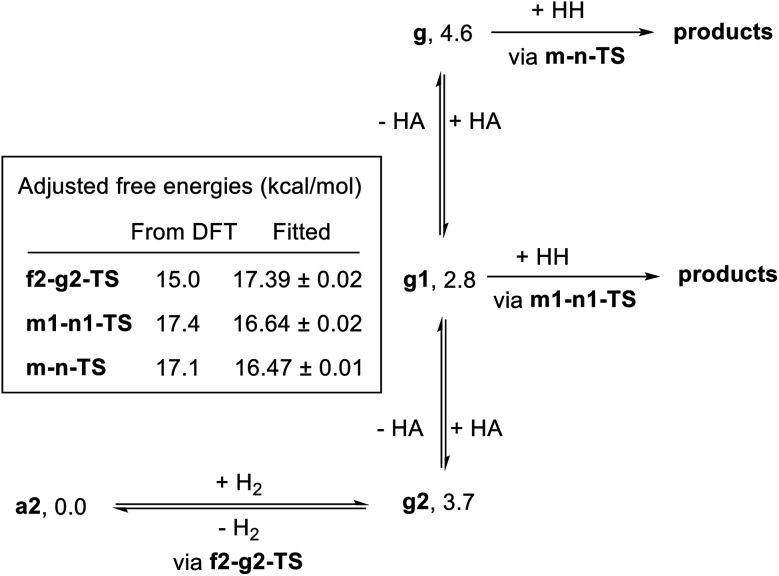
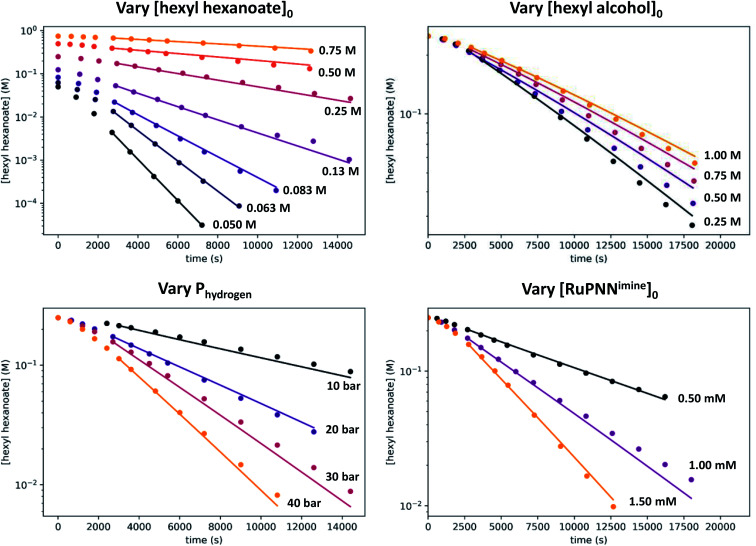
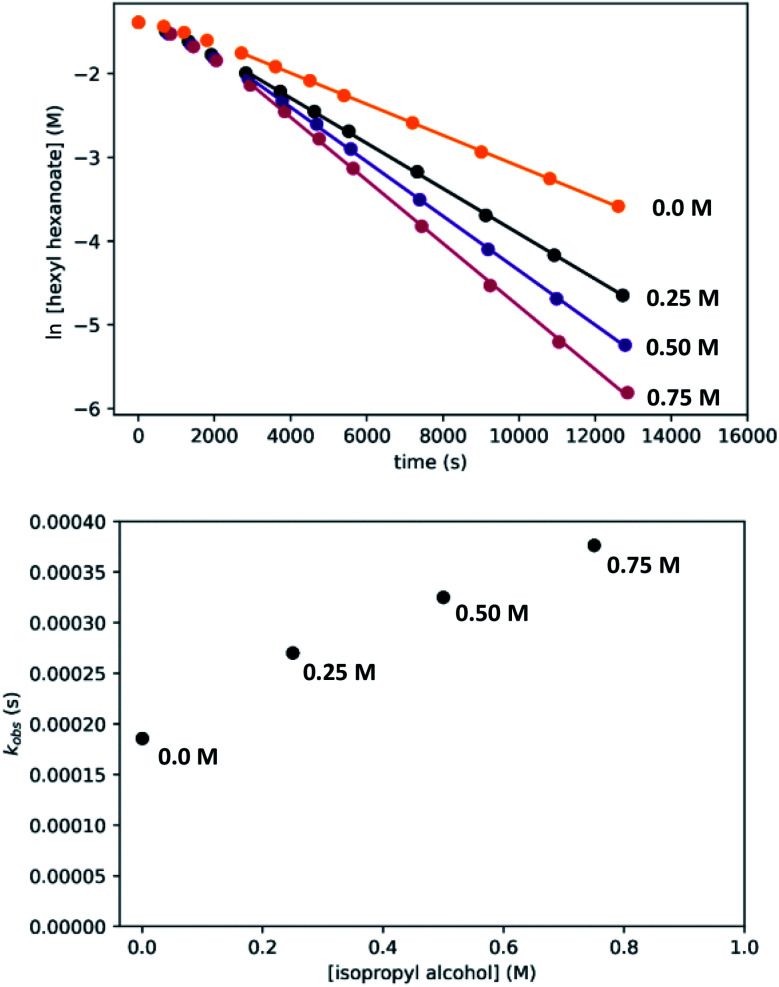
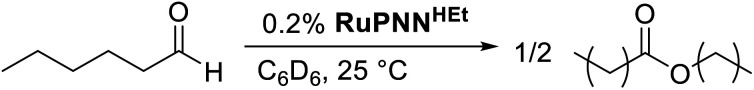
We previously demonstrated that Milstein's seminal diethylamino-substituted PNN-pincer-ruthenium catalyst for ester hydrogenation is activated by dehydroalkylation of the pincer ligand, releasing ethane and eventually forming an NHEt-substituted derivative that we proposed is the active catalyst. In this paper, we present a computational and experimental mechanistic study supporting this hypothesis. Our DFT analysis shows that the minimum-energy pathways for hydrogen activation, ester hydrogenolysis, and aldehyde hydrogenation rely on the key involvement of the nascent N-H group. We have isolated and crystallographically characterized two catalytic intermediates, a ruthenium dihydride and a ruthenium hydridoalkoxide, the latter of which is the catalyst resting state. A detailed kinetic study shows that catalytic ester hydrogenation is first-order in ruthenium and hydrogen, shows saturation behavior in ester, and is inhibited by the product alcohol. A global fit of the kinetic data to a simplified model incorporating the hydridoalkoxide and dihydride intermediates and three kinetically relevant transition states showed excellent agreement with the results from DFT.
This journal is © The Royal Society of Chemistry.
Conflict of interest statement
The authors declare no competing financial interest.
Figures
Similar articles
-
Dehydroalkylative Activation of CNN- and PNN-Pincer Ruthenium Catalysts for Ester Hydrogenation.J Am Chem Soc. 2019 Oct 30;141(43):17404-17413. doi: 10.1021/jacs.9b09326. Epub 2019 Oct 17. J Am Chem Soc. 2019. PMID: 31589441
-
Highly Enantiomerically Enriched Secondary Alcohols via Epoxide Hydrogenolysis.Organometallics. 2024 Jun 17;43(13):1490-1501. doi: 10.1021/acs.organomet.4c00214. eCollection 2024 Jul 8. Organometallics. 2024. PMID: 38993820 Free PMC article.
-
Alcohol amination with ammonia catalyzed by an acridine-based ruthenium pincer complex: a mechanistic study.J Am Chem Soc. 2014 Apr 23;136(16):5923-9. doi: 10.1021/ja409368a. Epub 2014 Apr 15. J Am Chem Soc. 2014. PMID: 24684701
-
[Development of a novel type of Pd/C-catalyzed chemoselective hydrogenation using a nitrogen catalyst poison].Yakugaku Zasshi. 2000 Nov;120(11):1091-103. doi: 10.1248/yakushi1947.120.11_1091. Yakugaku Zasshi. 2000. PMID: 11190196 Review. Japanese.
-
Diastereo- and enantioselective anti-selective hydrogenation of α-amino-β-keto ester hydrochlorides and related compounds using transition-metal-chiral-bisphosphine catalysts.Chem Rec. 2014 Apr;14(2):235-50. doi: 10.1002/tcr.201300032. Epub 2014 Feb 18. Chem Rec. 2014. PMID: 24550034 Review.
Cited by
-
Basic Promotors Impact Thermodynamics and Catalyst Speciation in Homogeneous Carbonyl Hydrogenation.J Am Chem Soc. 2022 May 11;144(18):8129-8137. doi: 10.1021/jacs.2c00548. Epub 2022 Apr 27. J Am Chem Soc. 2022. PMID: 35476423 Free PMC article.
-
Homogeneous Hydrogenation of CO2 and CO to Methanol: The Renaissance of Low-Temperature Catalysis in the Context of the Methanol Economy.Angew Chem Int Ed Engl. 2022 Oct 17;61(42):e202207278. doi: 10.1002/anie.202207278. Epub 2022 Sep 14. Angew Chem Int Ed Engl. 2022. PMID: 35921247 Free PMC article. Review.
-
Mechanistic insights on C(acyl)-N functionalisation mediated by late transition metals.Dalton Trans. 2024 Dec 3;53(47):18803-18818. doi: 10.1039/d4dt01829j. Dalton Trans. 2024. PMID: 39115156 Review.
-
Near-Ambient-Temperature Dehydrogenative Synthesis of the Amide Bond: Mechanistic Insight and Applications.ACS Catal. 2021 Jun 18;11(12):7383-7393. doi: 10.1021/acscatal.1c00728. Epub 2021 Jun 7. ACS Catal. 2021. PMID: 34168903 Free PMC article.
-
The Mechanism of Markovnikov-Selective Epoxide Hydrogenolysis Catalyzed by Ruthenium PNN and PNP Pincer Complexes.Organometallics. 2023 Feb 27;42(5):347-356. doi: 10.1021/acs.organomet.2c00503. eCollection 2023 Mar 13. Organometallics. 2023. PMID: 36937786 Free PMC article.
References
-
- Gunanathan C. Ben-David Y. Milstein D. Science. 2007;317:790–792. doi: 10.1126/science.1145295. - DOI - PubMed
- Gnanaprakasam B. Balaraman E. Ben-David Y. Milstein D. Angew. Chem., Int. Ed. 2011;50:12240–12244. doi: 10.1002/anie.201105876. - DOI - PubMed
- Zeng H. Guan Z. J. Am. Chem. Soc. 2011;133:1159–1161. doi: 10.1021/ja106958s. - DOI - PMC - PubMed
- Rigoli J. W. Moyer S. A. Pearce S. D. Schomaker J. M. Org. Biomol. Chem. 2012;10:1746–1749. doi: 10.1039/C2OB06921K. - DOI - PubMed
- Gnanaprakasam B. Milstein D. J. Am. Chem. Soc. 2011;133:1682–1685. doi: 10.1021/ja109944n. - DOI - PubMed
- Gnanaprakasam B. Ben-David Y. Milstein D. Adv. Synth. Catal. 2010;352:3169–3173. doi: 10.1002/adsc.201000663. - DOI
- Balaraman E. Gunanathan C. Zhang J. Shimon L. J. W. Milstein D. Nat. Chem. 2011;3:609–614. doi: 10.1038/nchem.1089. - DOI - PubMed
- Huff C. A. Sanford M. S. ACS Catal. 2013;3:2412–2416. doi: 10.1021/cs400609u. - DOI
- Chaudhari M. B. Bisht G. S. Kumari P. Gnanaprakasam B. Org. Biomol. Chem. 2016;14:9215–9220. doi: 10.1039/C6OB01786J. - DOI - PubMed
-
- Saudan L. A. Saudan C. M. Debieux C. Wyss P. Angew. Chem., Int. Ed. 2007;46:7473–7476. doi: 10.1002/anie.200701015. - DOI - PubMed
- Spasyuk D. Gusev D. G. Organometallics. 2012;31:5239–5242. doi: 10.1021/om300670r. - DOI
- Spasyuk D. Smith S. Gusev D. G. Angew. Chem., Int. Ed. 2013;52:2538–2542. doi: 10.1002/anie.201209218. - DOI - PubMed
- Li W. Xie J.-H. Yuan M.-L. Zhou Q.-L. Green Chem. 2014;16:4081–4085. doi: 10.1039/C4GC00835A. - DOI
- Filonenko G. A. Aguila M. J. B. Schulpen E. N. van Putten R. Wiecko J. Müller C. Lefort L. Hensen E. J. M. Pidko E. A. J. Am. Chem. Soc. 2015;137:7620–7623. doi: 10.1021/jacs.5b04237. - DOI - PubMed
- Spasyuk D. Vicent C. Gusev D. G. J. Am. Chem. Soc. 2015;137:3743–3746. doi: 10.1021/ja512389y. - DOI - PubMed
- Tan X. Wang Q. Liu Y. Wang F. Lv H. Zhang X. Chem. Commun. 2015;51:12193–12196. doi: 10.1039/C5CC04242A. - DOI - PubMed
- Tan X. Wang Y. Liu Y. Wang F. Shi L. Lee K. H. Lin Z. Lv H. Zhang X. Org. Lett. 2015;17:454–457. doi: 10.1021/ol503456j. - DOI - PubMed
- Wang Z. Chen X. Liu B. Liu Q.-B. Solan G. A. Yang X. Sun W.-H. Catal. Sci. Technol. 2017;7:1297–1304. doi: 10.1039/C6CY02413K. - DOI
-
- O W. W. N. Morris R. H. ACS Catal. 2013;3:32–40. doi: 10.1021/cs300619q. - DOI
- Otsuka T. Ishii A. Dub P. A. Ikariya T. J. Am. Chem. Soc. 2013;135:9600–9603. doi: 10.1021/ja403852e. - DOI - PubMed
- Chakraborty S. Lagaditis P. O. Förster M. Bielinski E. A. Hazari N. Holthausen M. C. Jones W. D. Schneider S. ACS Catal. 2014;4:3994–4003. doi: 10.1021/cs5009656. - DOI
- Chen T. Li H. Qu S. Zheng B. He L. Lai Z. Wang Z.-X. Huang K.-W. Organometallics. 2014;33:4152–4155. doi: 10.1021/om500549t. - DOI
- Junge K. Wendt B. Jiao H. Beller M. ChemCatChem. 2014;6:2810–2814. doi: 10.1002/cctc.201402421. - DOI
- Qu S. Dai H. Dang Y. Song C. Wang Z.-X. Guan H. ACS Catal. 2014;4:4377–4388. doi: 10.1021/cs501089h. - DOI
- Werkmeister S. Junge K. Wendt B. Alberico E. Jiao H. Baumann W. Junge H. Gallou F. Beller M. Angew. Chem., Int. Ed. 2014;53:8722–8726. doi: 10.1002/anie.201402542. - DOI - PubMed
- Chen X. Jing Y. Yang X. Chem.–Eur. J. 2016;22:1950–1957. doi: 10.1002/chem.201504058. - DOI - PubMed
- Gusev D. G. ACS Catal. 2016;6:6967–6981. doi: 10.1021/acscatal.6b02324. - DOI
- van Putten R. Uslamin E. A. Garbe M. Liu C. Gonzalez-de-Castro A. Lutz M. Junge K. Hensen E. J. M. Beller M. Lefort L. Pidko E. A. Angew. Chem., Int. Ed. 2017;56:7531–7534. doi: 10.1002/anie.201701365. - DOI - PMC - PubMed
LinkOut - more resources
Full Text Sources