

Adipose PTEN acts as a downstream mediator of a brain-fat axis in environmental enrichment
- PMID: 35355831
- PMCID: PMC8963210
- DOI: 10.1016/j.cpnec.2020.100013
Adipose PTEN acts as a downstream mediator of a brain-fat axis in environmental enrichment
Abstract
Background/objectives: Environmental enrichment (EE) is a physiological model to investigate brain-fat interactions. We previously discovered that EE activates the hypothalamic-sympathoneural adipocyte (HSA) axis via induction of brain-derived neurotrophic factor (BDNF), thus leading to sympathetic stimulation of white adipose tissue (WAT) and an anti-obesity phenotype. Here, we investigate whether PTEN acts as a downstream mediator of the HSA axis in the EE.
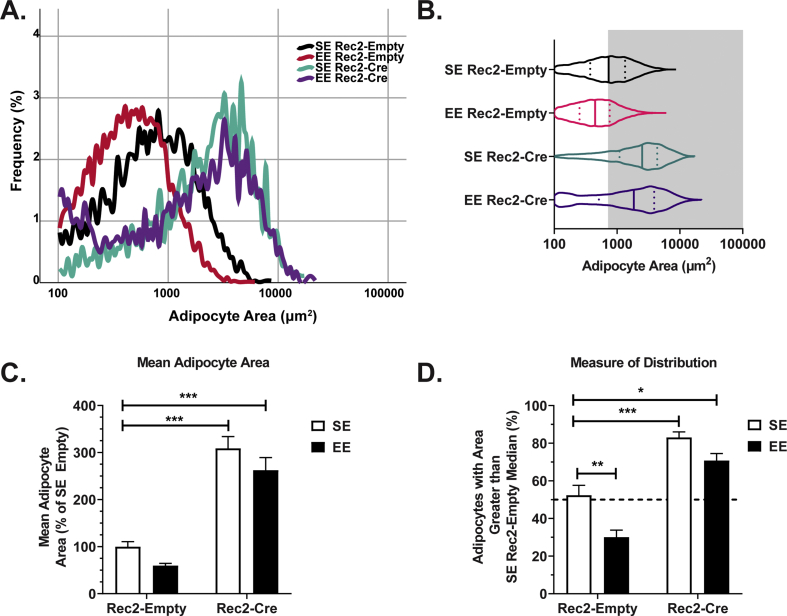
Methods: Mice were housed in EE for 4- and 16-week periods to determine how EE regulates adipose PTEN. Hypothalamic injections of adeno-associated viral (AAV) vectors expressing BDNF and a dominant negative form of its receptor were performed to assess the role of the HSA axis in adipose PTEN upregulation. A β-blocker, propranolol, and a denervation agent, 6-hydroydopamine, were administered to assess sympathetic signaling in the observed EE-PTEN phenotype. To determine whether inducing PTEN is sufficient to reproduce certain EE adipose remodeling, we overexpressed PTEN in WAT using an AAV vector. To determine whether adipose PTEN is necessary for the EE-mediated reduction in adipocyte size, we injected a rAAV vector expressing Cre recombinase to the WAT of adult PTENflox mice and placed the mice in EE.
Results: EE upregulated adipose PTEN expression, which was associated with suppression of AKT and ERK phosphorylation, increased hormone-sensitive lipase (HSL) phosphorylation, and reduced adiposity. PTEN regulation was found to be controlled by the HSA axis-with the hypothalamic BDNF acting as the upstream mediator-and dependent on sympathetic innervation. AAV-mediated adipose PTEN overexpression recapitulated EE-mediated adipose changes including suppression of AKT and ERK phosphorylation, increased HSL phosphorylation, and reduced adipose mass, whereas PTEN knockdown blocked the EE-induced reduction of adipocyte size.
Conclusions: These data suggest that adipose PTEN responds to environmental stimuli and serves as downstream mediator of WAT remodeling in the EE paradigm, resulting in decreased adipose mass and decreased adipocyte size.
Keywords: AAV; PTEN; adipose tissue; environmental enrichment; lipolysis; sympathetic nervous system.
Conflict of interest statement
COMPETING INTERESTS L.C. and W.H. are inventors of a provisional patent application related to the liver-restricting AAV vector. All other authors declare no conflicts of interest.
Figures


Similar articles
-
Adipose PTEN regulates adult adipose tissue homeostasis and redistribution via a PTEN-leptin-sympathetic loop.Mol Metab. 2019 Dec;30:48-60. doi: 10.1016/j.molmet.2019.09.008. Epub 2019 Sep 28. Mol Metab. 2019. PMID: 31767180 Free PMC article.
-
Role of Hypothalamic VGF in Energy Balance and Metabolic Adaption to Environmental Enrichment in Mice.Endocrinology. 2016 Mar;157(3):983-96. doi: 10.1210/en.2015-1627. Epub 2016 Jan 5. Endocrinology. 2016. PMID: 26730934 Free PMC article.
-
Environmental activation of a hypothalamic BDNF-adipocyte IL-15 axis regulates adipose-natural killer cells.Brain Behav Immun. 2021 Jul;95:477-488. doi: 10.1016/j.bbi.2021.05.005. Epub 2021 May 12. Brain Behav Immun. 2021. PMID: 33989745 Free PMC article.
-
Thematic review series: adipocyte biology. Sympathetic and sensory innervation of white adipose tissue.J Lipid Res. 2007 Aug;48(8):1655-72. doi: 10.1194/jlr.R700006-JLR200. Epub 2007 Apr 25. J Lipid Res. 2007. PMID: 17460327 Review.
-
Brain-adipose tissue cross talk.Proc Nutr Soc. 2005 Feb;64(1):53-64. doi: 10.1079/pns2004409. Proc Nutr Soc. 2005. PMID: 15877923 Review.
Cited by
-
Hypothalamic TrkB.FL overexpression improves metabolic outcomes in the BTBR mouse model of autism.PLoS One. 2023 Mar 9;18(3):e0282566. doi: 10.1371/journal.pone.0282566. eCollection 2023. PLoS One. 2023. PMID: 36893171 Free PMC article.
-
Long-term effects of a fat-directed FGF21 gene therapy in aged female mice.Gene Ther. 2024 Mar;31(3-4):95-104. doi: 10.1038/s41434-023-00422-0. Epub 2023 Sep 12. Gene Ther. 2024. PMID: 37699965
-
Dose-finding and in vivo safety study of an adipose targeted leptin gene therapy for congenital leptin deficiency.Mol Ther Methods Clin Dev. 2025 May 30;33(3):101500. doi: 10.1016/j.omtm.2025.101500. eCollection 2025 Sep 11. Mol Ther Methods Clin Dev. 2025. PMID: 40584572 Free PMC article.
-
Environmental Enrichment Mitigates Age-Related Metabolic Decline and Lewis Lung Carcinoma Growth in Aged Female Mice.Cancer Prev Res (Phila). 2021 Dec;14(12):1075-1088. doi: 10.1158/1940-6207.CAPR-21-0085. Epub 2021 Sep 17. Cancer Prev Res (Phila). 2021. PMID: 34535449 Free PMC article.
-
Environmental Enrichment Normalizes Metabolic Function in the Murine Model of Prader-Willi Syndrome Magel2-Null Mice.Endocrinology. 2025 Feb 5;166(3):bqaf001. doi: 10.1210/endocr/bqaf001. Endocrinology. 2025. PMID: 39801003
References
-
- Nedergaard J., Cannon B. The browning of white adipose tissue: some burning issues. Cell Metabol. 2014;20:396–407. - PubMed
Grants and funding
LinkOut - more resources
Full Text Sources
Research Materials
Miscellaneous
