

Development of a machine learning model using electrocardiogram signals to improve acute pulmonary embolism screening
- PMID: 35355847
- PMCID: PMC8946569
- DOI: 10.1093/ehjdh/ztab101
Development of a machine learning model using electrocardiogram signals to improve acute pulmonary embolism screening
Abstract
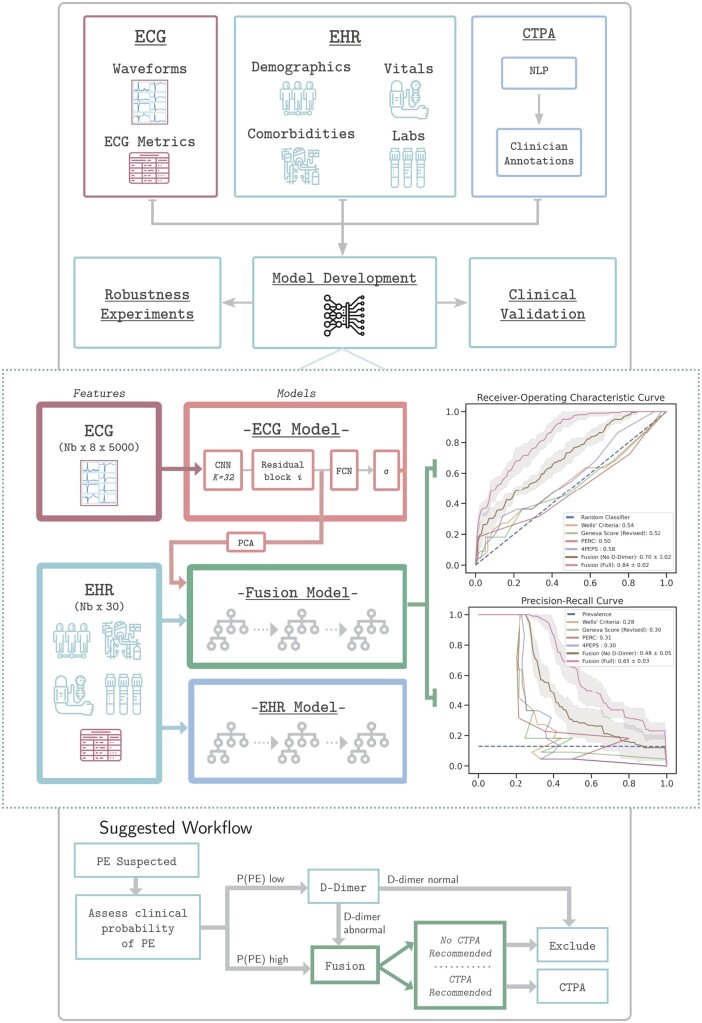
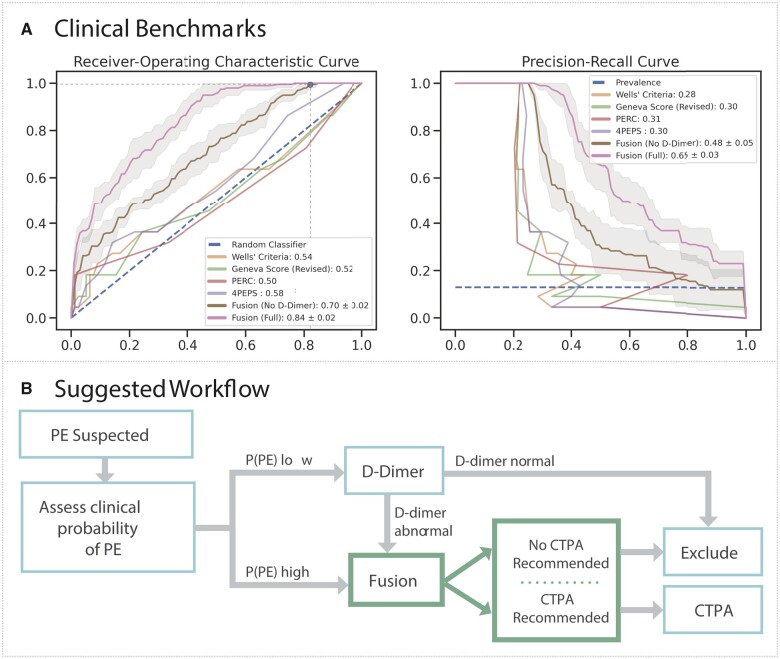
Aims: Clinical scoring systems for pulmonary embolism (PE) screening have low specificity and contribute to computed tomography pulmonary angiogram (CTPA) overuse. We assessed whether deep learning models using an existing and routinely collected data modality, electrocardiogram (ECG) waveforms, can increase specificity for PE detection.
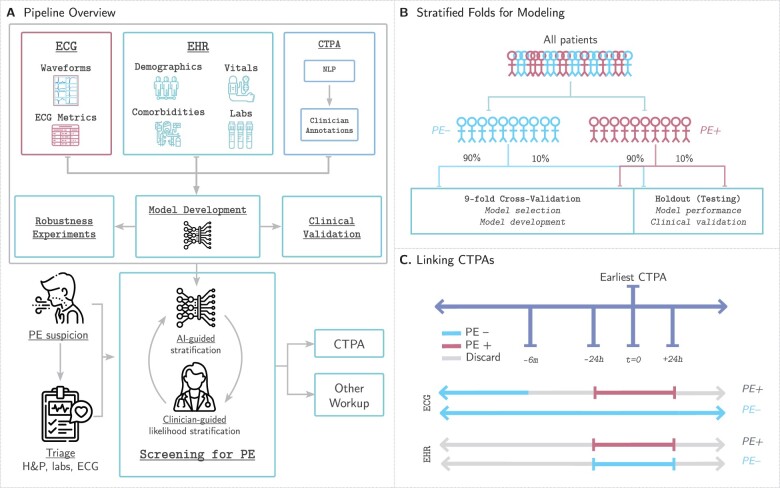
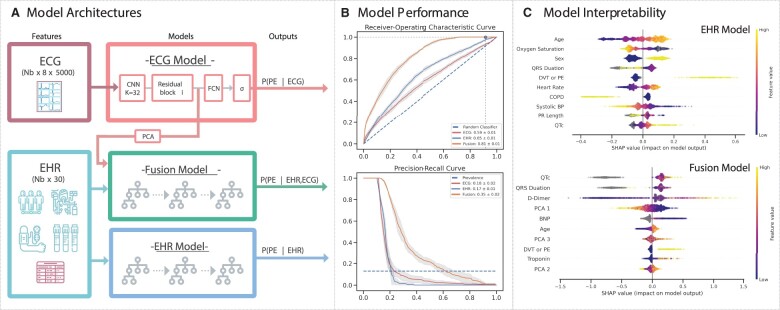
Methods and results: We create a retrospective cohort of 21 183 patients at moderate- to high suspicion of PE and associate 23 793 CTPAs (10.0% PE-positive) with 320 746 ECGs and encounter-level clinical data (demographics, comorbidities, vital signs, and labs). We develop three machine learning models to predict PE likelihood: an ECG model using only ECG waveform data, an EHR model using tabular clinical data, and a Fusion model integrating clinical data and an embedded representation of the ECG waveform. We find that a Fusion model [area under the receiver-operating characteristic curve (AUROC) 0.81 ± 0.01] outperforms both the ECG model (AUROC 0.59 ± 0.01) and EHR model (AUROC 0.65 ± 0.01). On a sample of 100 patients from the test set, the Fusion model also achieves greater specificity (0.18) and performance (AUROC 0.84 ± 0.01) than four commonly evaluated clinical scores: Wells' Criteria, Revised Geneva Score, Pulmonary Embolism Rule-Out Criteria, and 4-Level Pulmonary Embolism Clinical Probability Score (AUROC 0.50-0.58, specificity 0.00-0.05). The model is superior to these scores on feature sensitivity analyses (AUROC 0.66-0.84) and achieves comparable performance across sex (AUROC 0.81) and racial/ethnic (AUROC 0.77-0.84) subgroups.
Conclusion: Synergistic deep learning of ECG waveforms with traditional clinical variables can increase the specificity of PE detection in patients at least at moderate suspicion for PE.
Keywords: Deep learning; Electrocardiogram; Machine learning; Pulmonary embolism.
© The Author(s) 2021. Published by Oxford University Press on behalf of the European Society of Cardiology.
Figures
Similar articles
-
Electrocardiogram Signal Analysis With a Machine Learning Model Predicts the Presence of Pulmonary Embolism With Accuracy Dependent on Embolism Burden.Mayo Clin Proc Digit Health. 2024 May 24;2(3):453-462. doi: 10.1016/j.mcpdig.2024.03.009. eCollection 2024 Sep. Mayo Clin Proc Digit Health. 2024. PMID: 40206108 Free PMC article.
-
Artificial intelligence-based diagnosis of acute pulmonary embolism: Development of a machine learning model using 12-lead electrocardiogram.Rev Port Cardiol. 2023 Jul;42(7):643-651. doi: 10.1016/j.repc.2023.03.016. Epub 2023 Mar 30. Rev Port Cardiol. 2023. PMID: 37001583 English, Portuguese.
-
Massive external validation of a machine learning algorithm to predict pulmonary embolism in hospitalized patients.Thromb Res. 2022 Aug;216:14-21. doi: 10.1016/j.thromres.2022.05.016. Epub 2022 Jun 2. Thromb Res. 2022. PMID: 35679633
-
A Clinically Meaningful Interpretation of the Prospective Investigation of Pulmonary Embolism Diagnosis (PIOPED) II and III Data.Acad Radiol. 2018 May;25(5):561-572. doi: 10.1016/j.acra.2017.11.014. Epub 2018 Jan 11. Acad Radiol. 2018. PMID: 29337091 Review.
-
Suspected Acute Pulmonary Embolism: Gestalt, Scoring Systems, and Artificial Intelligence.Semin Respir Crit Care Med. 2021 Apr;42(2):176-182. doi: 10.1055/s-0041-1723936. Epub 2021 Feb 16. Semin Respir Crit Care Med. 2021. PMID: 33592653 Review.
Cited by
-
A novel multimodal computer-aided diagnostic model for pulmonary embolism based on hybrid transformer-CNN and tabular transformer.Phys Eng Sci Med. 2025 May 24. doi: 10.1007/s13246-025-01568-4. Online ahead of print. Phys Eng Sci Med. 2025. PMID: 40411540
-
Screening for RV Dysfunction Using Smartphone ECG Analysis App: Validation Study with Acute Pulmonary Embolism Patients.J Clin Med. 2024 Aug 14;13(16):4792. doi: 10.3390/jcm13164792. J Clin Med. 2024. PMID: 39200934 Free PMC article.
-
Electrocardiogram Signal Analysis With a Machine Learning Model Predicts the Presence of Pulmonary Embolism With Accuracy Dependent on Embolism Burden.Mayo Clin Proc Digit Health. 2024 May 24;2(3):453-462. doi: 10.1016/j.mcpdig.2024.03.009. eCollection 2024 Sep. Mayo Clin Proc Digit Health. 2024. PMID: 40206108 Free PMC article.
-
Research progress of artificial intelligence and machine learning in pulmonary embolism.Front Med (Lausanne). 2025 Mar 27;12:1577559. doi: 10.3389/fmed.2025.1577559. eCollection 2025. Front Med (Lausanne). 2025. PMID: 40212275 Free PMC article. Review.
-
Risk stratification of chest pain in the emergency department using artificial intelligence applied to electrocardiograms.Open Heart. 2025 Sep 1;12(2):e003343. doi: 10.1136/openhrt-2025-003343. Open Heart. 2025. PMID: 40889954 Free PMC article.
References
-
- Huisman MV, Barco S, Cannegieter SC, et al. Pulmonary embolism. Nat Rev Dis Primers 2018;4:18028. - PubMed
-
- Konstantinides SV, Meyer G, Becattini C, et al.; ESC Scientific Document Group. 2019 ESC Guidelines for the diagnosis and management of acute pulmonary embolism developed in collaboration with the European Respiratory Society (ERS). Eur Heart J 2020;41:543–603. - PubMed
-
- Kline Jeffrey A, Garrett John S, Sarmiento Elisa J, Strachan Christian C, Mark CD. Over-testing for suspected pulmonary embolism in American Emergency Departments. Circ Cardiovasc Qual Outcomes 2020;13:e005753. - PubMed
-
- Stacul F, Molen A. V D, Reimer P, et al.; Contrast Media Safety Committee of European Society of Urogenital Radiology (ESUR). Contrast induced nephropathy: updated ESUR Contrast Media Safety Committee guidelines. Eur Radiol 2011;21:2527–2541. - PubMed
Grants and funding
LinkOut - more resources
Full Text Sources
Other Literature Sources