. 2022 Mar 10:13:861525.
doi: 10.3389/fimmu.2022.861525. eCollection 2022.

The Heterogeneity of Immune Cell Infiltration Landscape and Its Immunotherapeutic Implications in Hepatocellular Carcinoma

Affiliations

The Heterogeneity of Immune Cell Infiltration Landscape and Its Immunotherapeutic Implications in Hepatocellular Carcinoma

Yuanyuan Guo et al. Front Immunol. .

Abstract

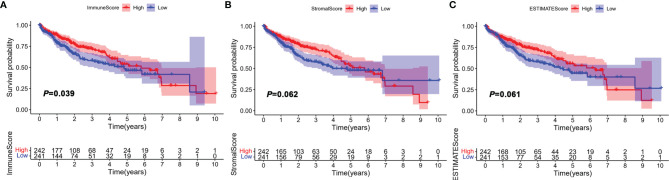
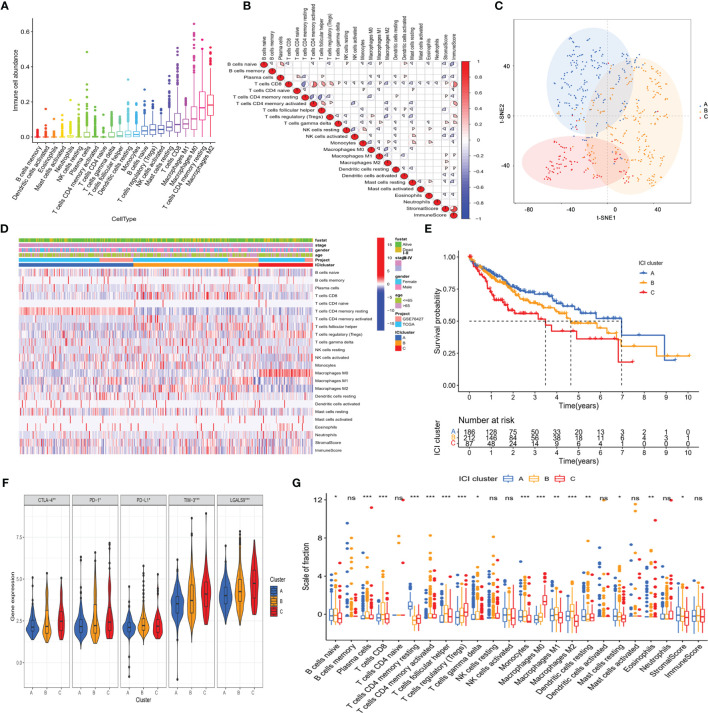
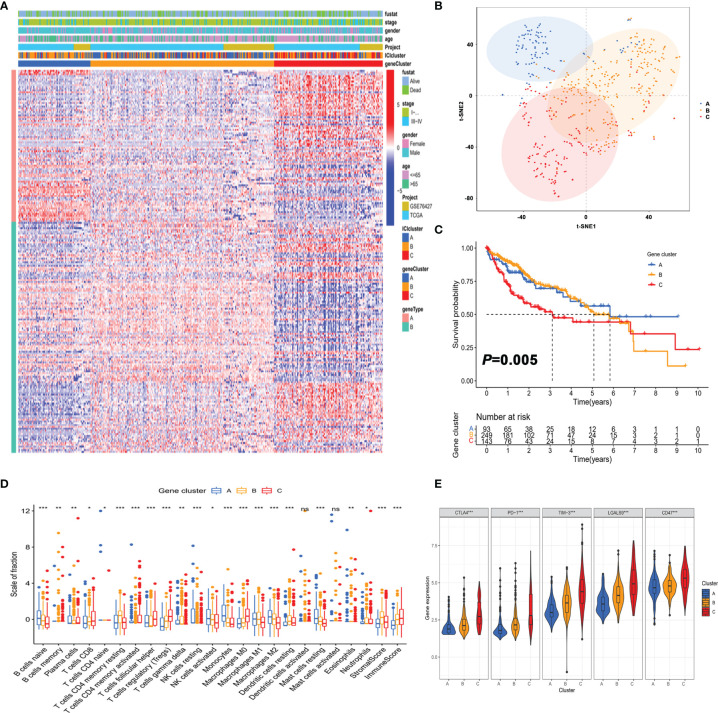
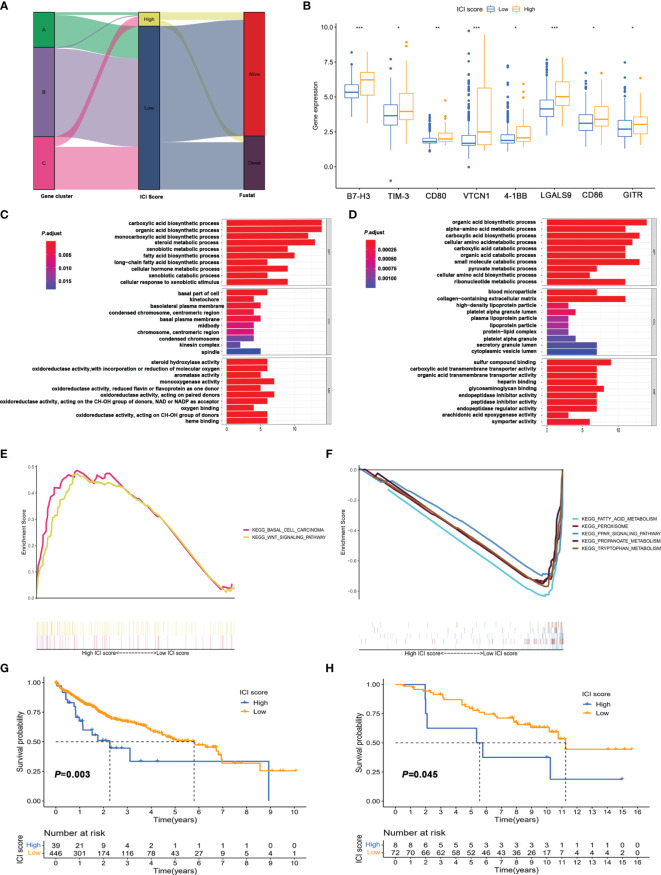
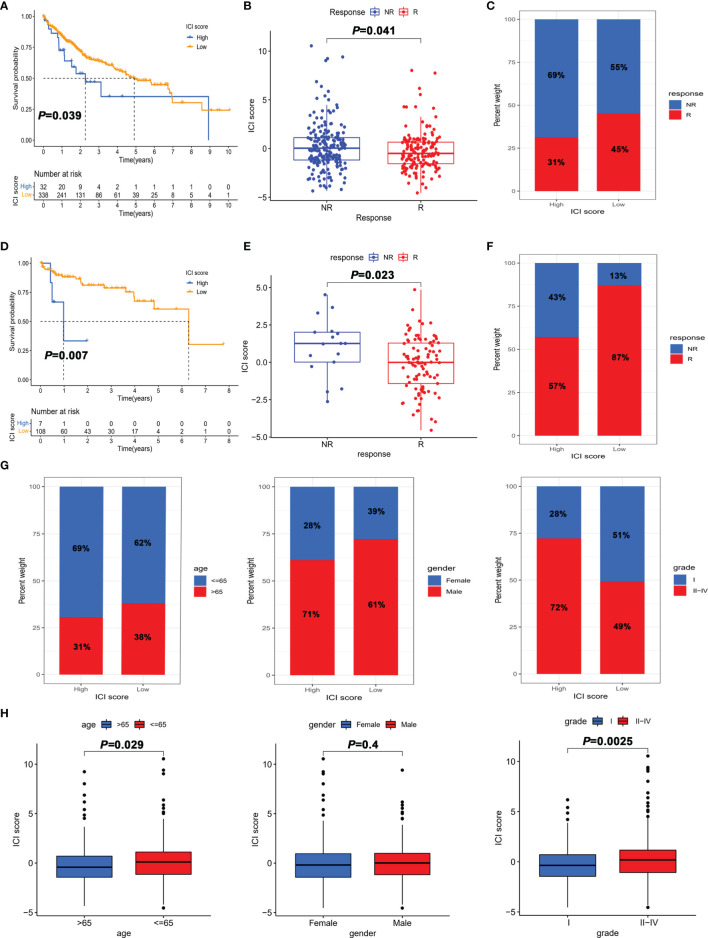
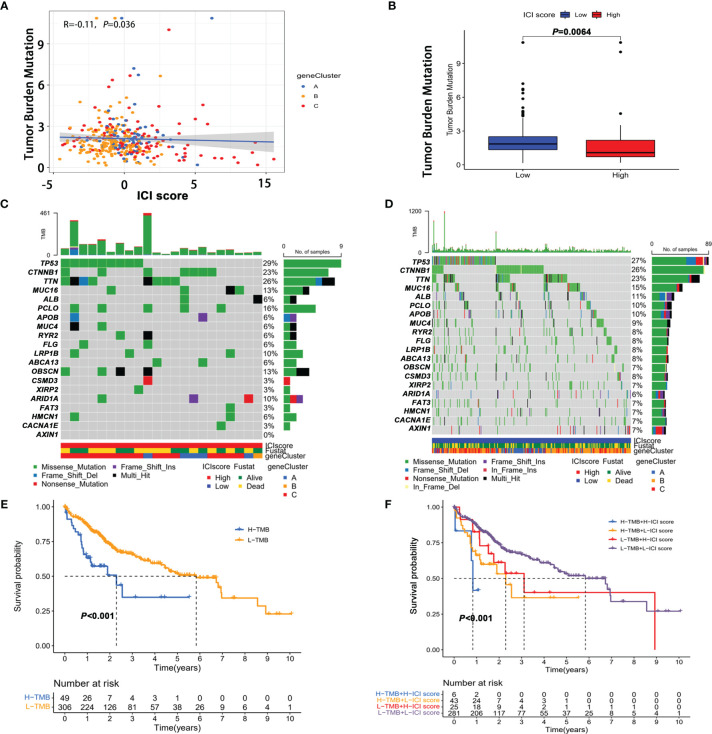
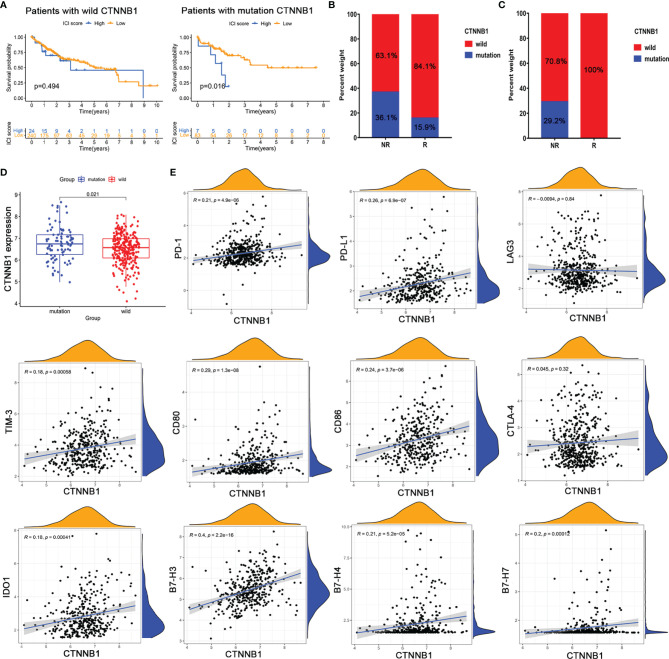
Immunotherapy, closely associated with immune infiltration and tumor mutation burden (TMB), is emerging as a promising strategy for treating tumors, but its low response rate in hepatocellular carcinoma (HCC) remains a major challenge. Herein, we applied two algorithms to uncover the immune infiltration landscape of the immune microenvironment in 491 HCC patients. Three immune infiltration patterns were defined using the CIBERSORT method, and the immune cell infiltration (ICI) scores were established using principal component analysis. In the high ICI score group, the activation of the Wnt/β-catenin pathway was significantly enriched and expressions of immune checkpoint genes increased, which showed a pessimistic outcome. The low ICI score group was characterized by increased TMB and enrichment of metabolism-related pathways. Further analysis found that the ICI score exhibited a significant difference in age ≥65/age <65, grade I/grade II-IV, and response to immunotherapy. Moreover, the CTNNB1 mutation status was found to be closely associated with prognosis and immunotherapeutic efficiency, significantly affecting the ICI score and TMB, which might be regarded as a potential marker for the treatment of HCC. The evaluation of immune infiltration patterns can improve the understanding of the tumor immune microenvironment and provide new directions for the study of individualized immunotherapy strategies for HCC.

Keywords: hepatocellular carcinoma; immune cell infiltration; immune microenvironment; tumor heterogeneity; tumor mutational burden.


Conflict of interest statement

The authors declare that the research was conducted in the absence of any commercial or financial relationships that could be construed as a potential conflict of interest.

Figures

Figure 1
Figure 1
Correlation between ImmuneScore, StromalScore, and ESTIMATEScore with overall survival (OS). HCC patients were divided into two groups according to the median of ImmuneScore, StromalScore, and ESTIMATEScore. High group, n = 242; low group, n = 241. (A) Kaplan–Meier curve analysis of ImmuneScore with the log-rank test; (B) Kaplan–Meier curve analysis of StromalScore with the log-rank test; (C) Kaplan–Meier curve analysis of ESTIMATEScore with the log-rank test.
Figure 2
Figure 2
The landscape of immuno-cell infiltration in the TME of HCC. (A) Comparison of the abundance of 22 tumor-infiltrating immune cells. (B) Correlation between the abundance of 22 tumor-infiltrating immune cells and Immune scores as well as Stromal scores. (C) Confirmation of the clustering patterns using the t-SNE algorithm. (D) Unsupervised clustering for all HCC patients based on the proportion of immune cells. (E) Kaplan–Meier survival analysis of three immune infiltration clusters. (F) Comparison of the expression of immune checkpoints among distinct immune infiltration clusters. * p < 0.05; ** p < 0.01; *** p < 0.001. (G) Comparison of fraction of tumor-infiltrating immune cells in immune infiltration clusters. * p < 0.05; ** p < 0.01; *** p < 0.001; ns, not significant.
Figure 3
Figure 3
Identification of gene subtypes of HCC based on immune profiles. (A) Unsupervised clustering of differential gene expression among three immune infiltration clusters. (B) Confirmation of the clustering patterns using the t-SNE algorithm. (C) Kaplan–Meier curves for patients in the three clusters with log-rank p = 0.005. (D) Comparison of the proportion of tumor-infiltrating immune cells in three gene clusters. * p < 0.05; ** p < 0.01; *** p < 0.001; ns, not significant. (E) Comparison of the expression of immune checkpoints among distinct immune infiltration clusters. * p < 0.05; ** p < 0.01; *** p < 0.001.
Figure 4
Figure 4
Construction of immune score and functional enrichment analysis based on immune infiltration-related genes. (A) Alluvial plot of distribution of the ICI score and prognosis in different immune infiltration gene clusters. (B) Expression of immune checkpoint in high and low ICI score groups. * p < 0.05; ** p < 0.01; *** p < 0.001; ns, not significant. (C, D) GO enrichment analysis of signature genes A (C) and B (D). (E, F) Gene set enrichment analysis (GSEA) of high score (E) and low score group (F). (G) Kaplan–Meier survival analysis of high score and low score groups divided based on the optimal cutoff value. (H) Kaplan–Meier survival analysis of high score and low score groups in the validation cohort (GSE10141).
Figure 5
Figure 5
The role of the ICI score in the prediction of immunotherapeutic benefits. (A) Kaplan–Meier curves for patients with high and low ICI score in the TGCA-LIHC cohort. (B) Comparison of the ICI score in response and non-response to immunotherapy in the TGCA-LIHC cohort. (C) Percentage of objective response rate to immunotherapy for high score and low score groups in the TGCA-LIHC cohort. (D) Kaplan–Meier curves for patients with high and low ICI scores in the GSE76427 cohort. (E) Comparison of ICI scores in response and non-response to immunotherapy in the GSE76427 cohort. (F) Percentage of objective response rate to immunotherapy for the high score and low score groups in the GSE76427 cohort. (G) Percentage of clinical parameters for high score and low score groups. (H) Comparison of clinical parameters between high score and low score groups.
Figure 6
Figure 6
The correlation between the ICI score and tumor mutation burden (TMB). (A) Correlation between tumor mutation burden and ICI score. (B) Comparison of TMB in high score and low score groups. The oncoPrint plots of tumor-related gene mutations in the high ICI score (C) and low ICI score groups (D). (E) Kaplan–Meier curves of overall survival in the high TMB and low TMB groups. (F) Kaplan–Meier survival curve for high/low TMB combined with high/low ICI score.
Figure 7
Figure 7
(CTNNB1 mutation might be predictive of response to immunotherapy. Kaplan–Meier survival curve of the (A) CTNNB1 wild-type group and (B) CTNNB1 mutation group in TCGA-LIHC. (C) CTNNB1 mutation status in the response and non-response groups from TCGA-LIHC (left) and cBioPortal database (right). (D) Comparison of the expression of CTNNB1 in wild-type and mutant groups. (E) Correlation between CTNNB1 expression and T-cell checkpoint expressions.

Similar articles

Cited by

References

    1. Villanueva A. Hepatocellular Carcinoma. N Engl J Med (2019) 380:1450–62. doi: 10.1056/NEJMra1713263 - DOI - PubMed
    1. Bray F, Ferlay J, Soerjomataram I, Siegel RL, Torre LA, Jemal A. Global Cancer Statistics 2018: GLOBOCAN Estimates of Incidence and Mortality Worldwide for 36 Cancers in 185 Countries. CA Cancer J Clin (2018) 68:394–424. doi: 10.3322/caac.21492 - DOI - PubMed
    1. Lin J, Zhao H. Systemic Management for Patients With Hepatobiliary Tumors in a Multi-Dimensional View. Hepatobiliary Surg Nutr (2019) 8:626–8. doi: 10.21037/hbsn.2019.07.21 - DOI - PMC - PubMed
    1. Davis AA, Patel VG. The Role of PD-L1 Expression as a Predictive Biomarker: An Analysis of All US Food and Drug Administration (FDA) Approvals of Immune Checkpoint Inhibitors. J Immunother Cancer (2019) 7:278. doi: 10.1186/s40425-019-0768-9 - DOI - PMC - PubMed
    1. Osipov A, Lim SJ, Popovic A, Azad NS, Laheru DA, Zheng L, et al. . Tumor Mutational Burden, Toxicity, and Response of Immune Checkpoint Inhibitors Targeting PD(L)1, CTLA-4, and Combination: A Meta-Regression Analysis. Clin Cancer Res (2020) 26:4842–51. doi: 10.1158/1078-0432.CCR-20-0458 - DOI - PMC - PubMed

Publication types

Substances