. 2022 Mar 9;4(2):fcac055.
doi: 10.1093/braincomms/fcac055. eCollection 2022.

Tau and the fractionated default mode network in atypical Alzheimer's disease

Affiliations

Tau and the fractionated default mode network in atypical Alzheimer's disease

Deepti Putcha et al. Brain Commun. .

Abstract

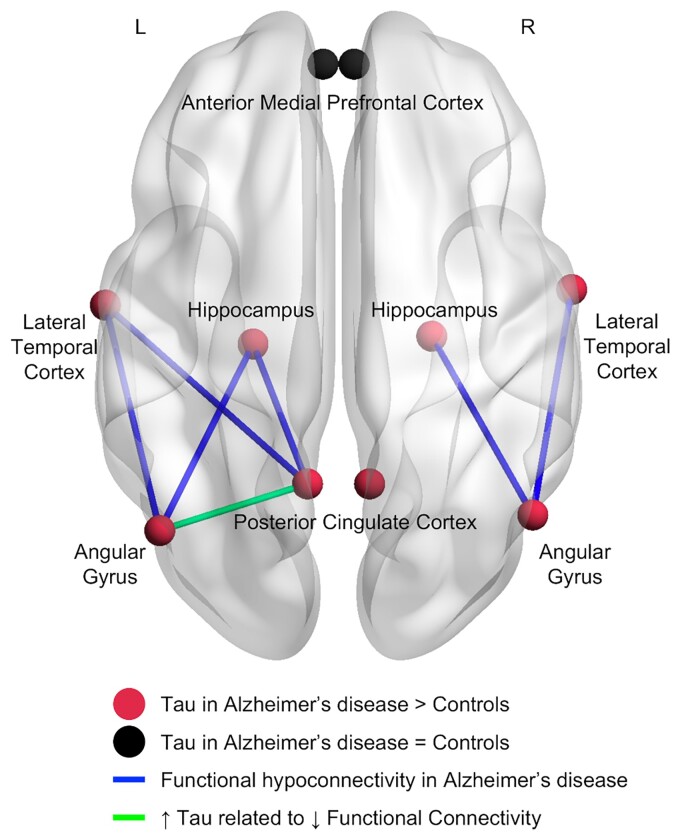
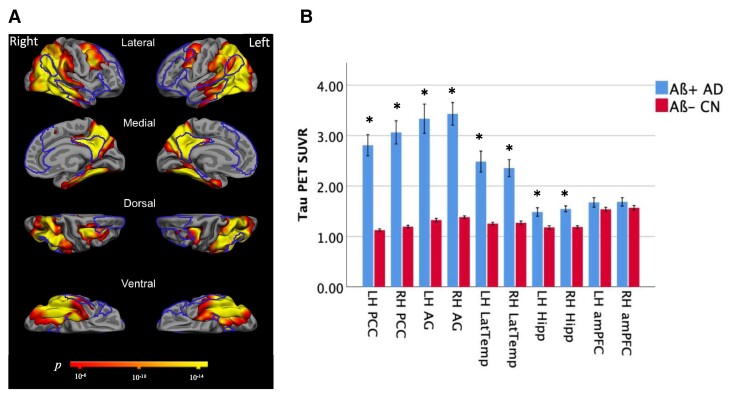
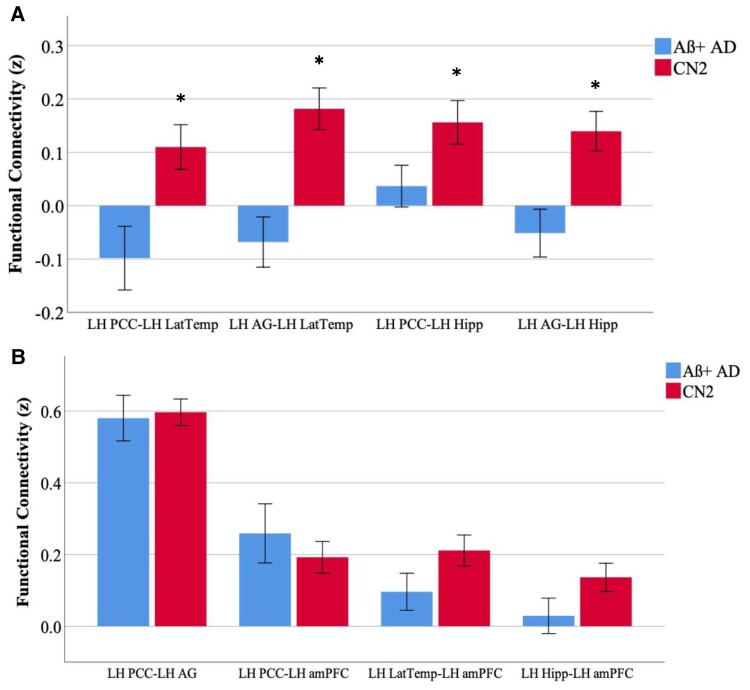
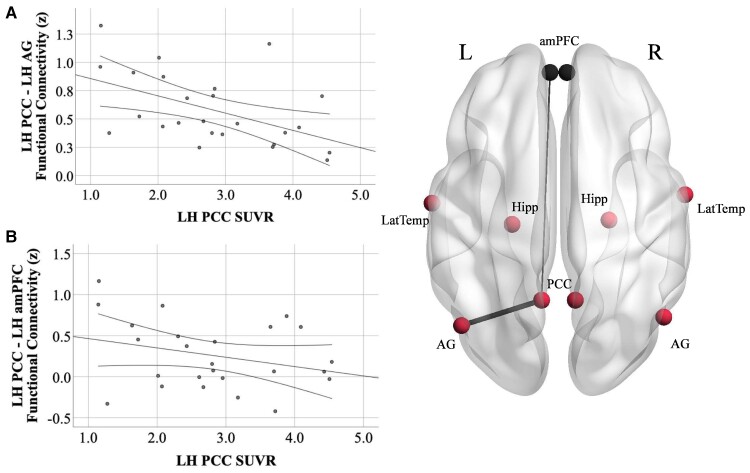
Alzheimer's disease-related atrophy in the posterior cingulate cortex, a key node of the default mode network, is present in the early stages of disease progression across clinical phenotypic variants of the disease. In the typical amnestic variant, posterior cingulate cortex neuropathology has been linked with disrupted connectivity of the posterior default mode network, but it remains unclear if this relationship is observed across atypical variants of Alzheimer's disease. In the present study, we first sought to determine if tau pathology is consistently present in the posterior cingulate cortex and other posterior nodes of the default mode network across the atypical Alzheimer's disease syndromic spectrum. Second, we examined functional connectivity disruptions within the default mode network and sought to determine if tau pathology is related to functional disconnection within this network. We studied a sample of 25 amyloid-positive atypical Alzheimer's disease participants examined with high-resolution MRI, tau (18F-AV-1451) PET, and resting-state functional MRI. In these patients, high levels of tau pathology in the posteromedial cortex and hypoconnectivity between temporal and parietal nodes of the default mode network were observed relative to healthy older controls. Furthermore, higher tau signal and reduced grey matter density in the posterior cingulate cortex and angular gyrus were associated with reduced parietal functional connectivity across individual patients, related to poorer cognitive scores. Our findings converge with what has been reported in amnestic Alzheimer's disease, and together these observations offer a unifying mechanistic feature that relates posterior cingulate cortex tau deposition to aberrant default mode network connectivity across heterogeneous clinical phenotypes of Alzheimer's disease.

Keywords: functional connectivity; logopenic variant primary progressive aphasia; posterior cortical atrophy; resting-state fMRI.


Figures

Graphical Abstract
Graphical Abstract
Figure 1
Figure 1
Individual variability in the cortical distribution of tau PET signal. Coloured vertices on the cortical surface map indicate the degree of spatial overlap in elevated tau across individual patients. Raw W-score maps were binarized at W > 3, corresponding to the 99th percentile of the normal distribution, summed across all patients, divided by the number of patients and multiplied by 100. The overlap map thus identifies the extent of between-subjects consistency in elevated tau uptake (from 0 to 100%). All patients exhibited elevated tau in the posterior DMN, including the PCC and lateral temporoparietal cortex.
Figure 2
Figure 2
Mean tau PET signal is high across the posterior DMN in Aβ+ Alzheimer’s disease. (A) Maps of the mean cortical tau (18F-AV-1451) PET in 25 Aβ+ Alzheimer’s disease patients compared with 25 Aβ− CN participants, with significance thresholded at P < 10−6. The DMN is outlined. (B) Mean partial volume-corrected tau PET SUVR values in ROIs comprising the DMN were compared between the Aβ+ Alzheimer’s disease patients and Aβ− CN group with independent samples t-tests. Elevated tau signal in the left (t = 8.0, P = 2.5 × 10−10) and right (t = 8.1, P = 1.7 × 10−10) PCC, left (t = 6.9, P = 1.2 × 10−8) and right (t = 9.05, P = 6.0 × 10−12) AG, left (t = 5.9, P = 4.2 × 10−7) and right (t = 6.3, P = 7.6 × 10−8) LTC and left (t = 3.4, P = 0.001) and right (t = 5.6, P = 9.2 × 10−7) hippocampal formation were observed in the Aβ+ Alzheimer’s disease patients compared with Aβ− CN participants. PCC, posterior cingulate cortex; AG, angular gyrus; LatTemp, lateral temporal cortex; Hipp, hippocampus; LH, left hemisphere; RH, right hemisphere. *Significant group difference at the level of P < 0.005. There were no group differences in tau PET SUVR values in the left and right amPFC. SUVR, standard uptake value ratio; ROI, region of interest.
Figure 3
Figure 3
Functional hypoconnectivity between temporal and parietal nodes of the DMN. Independent samples t-tests were conducted to determine the group mean differences between the Aβ+ Alzheimer’s disease and CN2 groups in functional connectivity (Fisher’s z-score) between DMN ROIs. (A) Functional hypoconnectivity in the Aβ+ Alzheimer’s disease group was observed between the left PCC and LatTemp (t = 2.9, P = 0.005), between the left AG and left LatTemp (t = 4.1, P = 0.0001), between the left PCC and left Hipp (t = 2.1, P = 0.04) and between the left AG and left Hipp (t = 3.3, P = 0.002). (B) Functional connectivity was comparable between posterior parietal nodes (PCC and AG), between parietal and frontal nodes (PCC and amPFC) and between temporal and parietal nodes (LatTemp, Hipp and amPFC). PCC, posterior cingulate cortex; LatTemp, lateral temporal cortex; AG, angular gyrus. Hipp, Hippocampus; amPFC, anterior medial prefrontal cortex; LH, left hemisphere. *Significance at the level of p < 0.05. Functional connectivity between left-hemisphere ROIs is shown here for illustrative purposes; complete group differences are described in the text.
Figure 4
Figure 4
Tau PET SUVR in the PCC is related to PCC-to-AG hypoconnectivity but not PCC-amPFC connectivity. (A) Increased tau PET signal in the left PCC is related to reduced functional connectivity between the left PCC and AG (r = −0.51, P = 0.01) in Aβ+ Alzheimer’s disease. (B) There was no relationship between tau PET signal in the left PCC and functional connectivity between the left PCC and amPFC (r = −0.29, P = 0.2). PCC, posterior cingulate cortex; AG, angular gyrus; amPFC, anterior medial prefrontal cortex; LH, left hemisphere. Functional connectivity units are Fisher’s z-scores. 95% confidence intervals are displayed. Results from the left hemisphere are shown here for illustrative purposes; complete results from both hemispheres are described in the text.

References

    1. Buckner RL, Snyder AZ, Shannon BJ, et al. . Molecular, structural, and functional characterization of Alzheimer’s disease: Evidence for a relationship between default activity, amyloid, and memory. J Neurosci. 2005;25(34):7709–7717. - PMC - PubMed
    1. Dickerson BC, Bakkour A, Salat DH, et al. . The cortical signature of Alzheimer’s disease: Regionally specific cortical thinning relates to symptom severity in very mild to mild AD dementia and is detectable in asymptomatic amyloid-positive individuals. Cereb Cortex. 2009;19(3):497–510. - PMC - PubMed
    1. Greicius MD, Srivastava G, Reiss AL, Menon V. Default-mode network activity distinguishes Alzheimer’s disease from healthy aging: Evidence from functional MRI. Proc Natl Acad Sci USA. 2004;101(13):4637–4642. - PMC - PubMed
    1. Minoshima S, Giordani B, Berent S, Frey KA, Foster NL, Kuhl DE. Metabolic reduction in the posterior cingulate cortex in very early Alzheimer’s disease. Ann Neurol. 1997;42(1):85–94. - PubMed
    1. Lustig C, Snyder AZ, Bhakta M, et al. . Functional deactivations: Change with age and dementia of the Alzheimer type. Proc Natl Acad Sci USA. 2003;100(24):14504–14509. - PMC - PubMed

LinkOut - more resources