. 2022 Mar 23;11(3):e1380.
doi: 10.1002/cti2.1380. eCollection 2022.

A scalable serology solution for profiling humoral immune responses to SARS-CoV-2 infection and vaccination

Affiliations

A scalable serology solution for profiling humoral immune responses to SARS-CoV-2 infection and vaccination

Karen Colwill et al. Clin Transl Immunology. .

Abstract

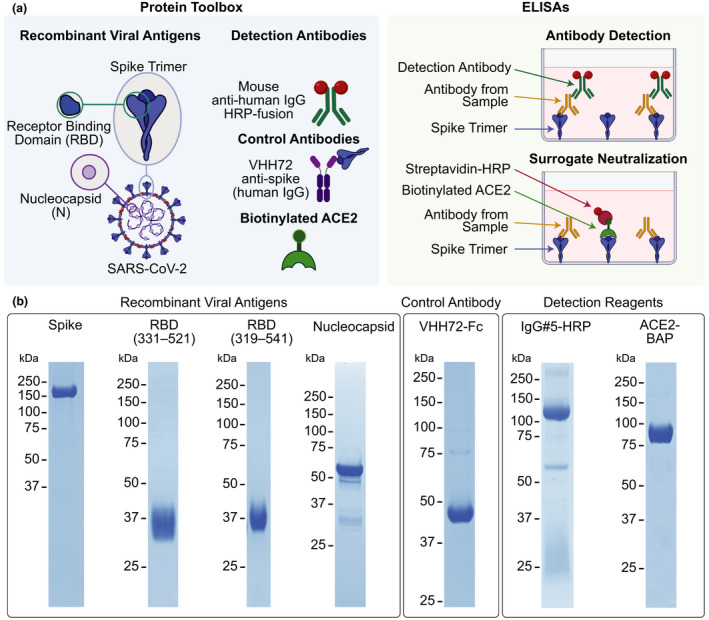
Objectives: Antibody testing against severe acute respiratory syndrome coronavirus 2 (SARS-CoV-2) has been instrumental in detecting previous exposures and analyzing vaccine-elicited immune responses. Here, we describe a scalable solution to detect and quantify SARS-CoV-2 antibodies, discriminate between natural infection- and vaccination-induced responses, and assess antibody-mediated inhibition of the spike-angiotensin converting enzyme 2 (ACE2) interaction.

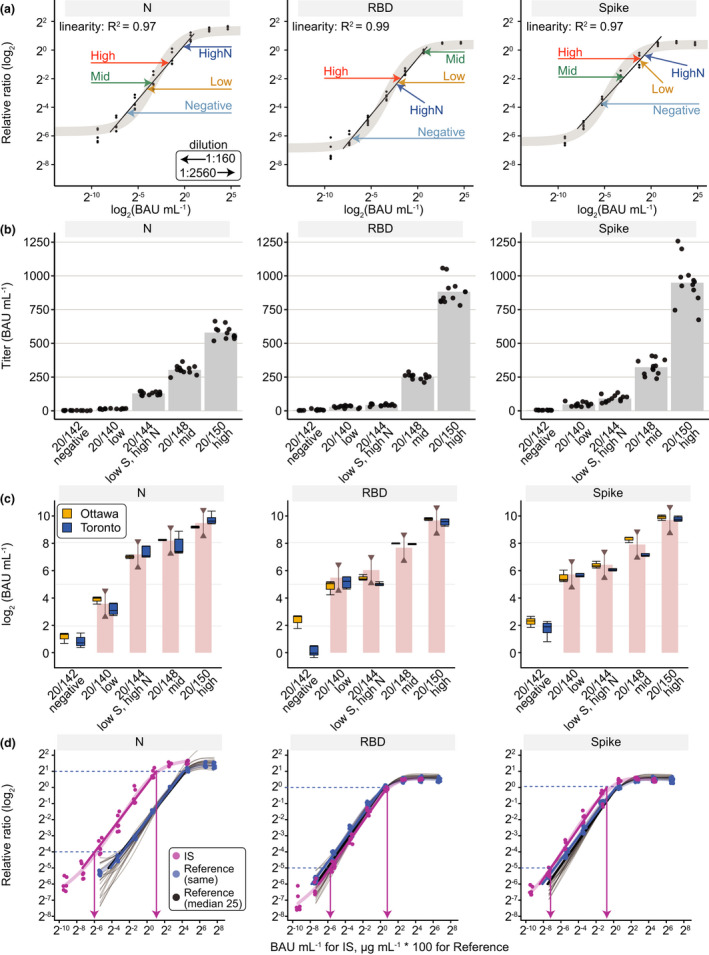
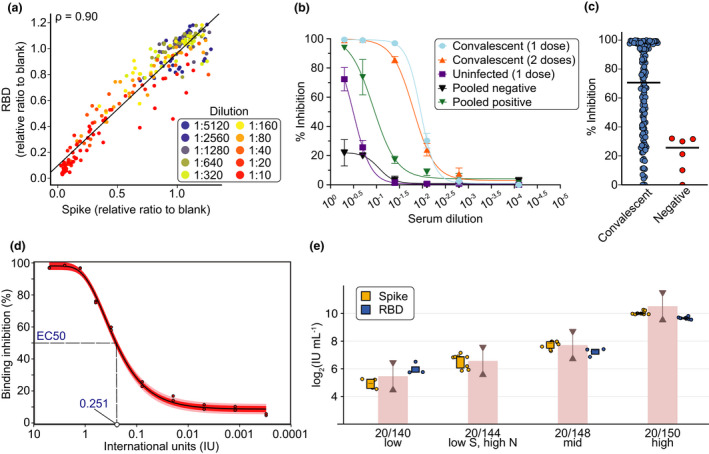
Methods: We developed methods and reagents to detect SARS-CoV-2 antibodies by enzyme-linked immunosorbent assay (ELISA). The main assays focus on the parallel detection of immunoglobulin (Ig)Gs against the spike trimer, its receptor binding domain (RBD) and nucleocapsid (N). We automated a surrogate neutralisation (sn)ELISA that measures inhibition of ACE2-spike or -RBD interactions by antibodies. The assays were calibrated to a World Health Organization reference standard.

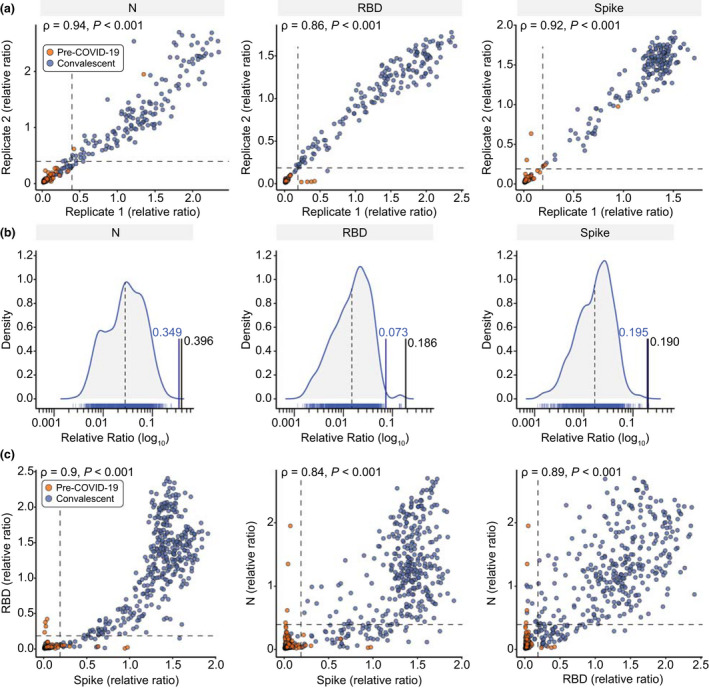
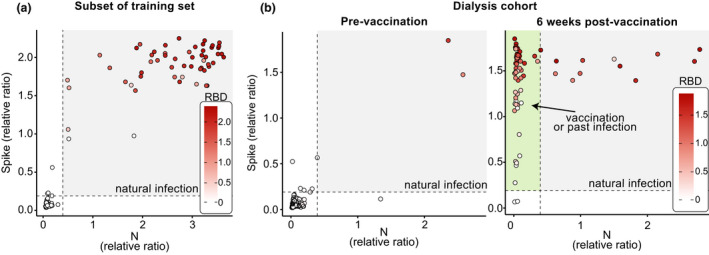
Results: Our single-point IgG-based ELISAs accurately distinguished non-infected and infected individuals. For seroprevalence assessment (in a non-vaccinated cohort), classifying a sample as positive if antibodies were detected for ≥ 2 of the 3 antigens provided the highest specificity. In vaccinated cohorts, increases in anti-spike and -RBD (but not -N) antibodies are observed. We present detailed protocols for serum/plasma or dried blood spots analysis performed manually and on automated platforms. The snELISA can be performed automatically at single points, increasing its scalability.

Conclusions: Measuring antibodies to three viral antigens and identify neutralising antibodies capable of disrupting spike-ACE2 interactions in high-throughput enables large-scale analyses of humoral immune responses to SARS-CoV-2 infection and vaccination. The reagents are available to enable scaling up of standardised serological assays, permitting inter-laboratory data comparison and aggregation.

Keywords: SARS‐CoV‐2; antibody detection; antibody neutralisation; assay development and standardisation; high‐throughput screening.


Conflict of interest statement

The authors declare no conflict of interest.

Figures

Figure 1
Figure 1
High‐quality reagents for SARS‐CoV‐2 serology. (a) Reagents comprising the protein toolbox (left panel) are used in high‐throughput plate‐based ELISAs for antibody detection and surrogate neutralisation (right panel). (b) The reagents were analyzed on Coomassie‐stained polyacrylamide gels under reducing conditions to assess their purity. Molecular weight markers (kDa) are shown to the left of the gels.
Figure 2
Figure 2
Development of high‐throughput ELISAs for plasma or serum. (a) Known negative (pre‐COVID‐19) and positive (confirmed convalescent) samples (0.0625 µL/well) were tested in an automated antibody detection ELISA in two separate replicates 7 weeks apart. Spearman correlations are noted. (b) Density distributions of negative samples were plotted for each antigen. The black lines represent the mean of the negative distribution (dotted) and three SDs from the mean (solid; the relative ratio is indicated). The blue line represents the thresholds established by ROC analysis. (c) Comparison of the antigens with a set of known negative and positive samples at 0.0625 µL/well. Spearman correlations are shown. For both a and c, dashed lines represent the thresholds as defined by the 3‐SD negative distribution shown in b and listed in Table 1.
Figure 3
Figure 3
Conversion of Ottawa and Toronto ELISA data to WHO BAUs and comparison to the WHO Reference Panel 20/268. (a) The 20/268 reference panel at the indicated dilutions (arrows) was fitted onto a dose‐response curve of the IS with the measured values expressed as relative ratios (Toronto). A 1:160 dilution (0.0625 µL/well) of sample was used except when it was out of the linear range of the fitted line in which case the 1:2560 dilution (0.0039 µL/well) was used. (b) IgG levels in the five samples in the 20/268 reference panel are represented for spike, its RBD, and N (n = 12, 4 replicates at 1:500, 1:1000, 1:2500 dilutions). (c) Box plots for Ottawa (orange) show the median of the 12 samples from B. Box plots for Toronto (blue) show the median of individual measurements (n = 4) for the selected dilution (1:2560 (0.0039 µL/well) for Mid and High for spike and N, High for RBD, the rest were at 1:160 (0.0625 µL/well)). The WHO bar graph shows the geometric mean from the WHO study and the lines with half arrows represent a 0.5–2‐fold range from the geometric mean. (d) Reference curves (VHH72‐Fc for spike/RBD, anti‐N for N) were plotted for each antigen either from the same tests in which the IS was analyzed or from 25 different tests over 3 months (shown as faded black lines with a thicker median line in black). The blue dashed lines represent the limits of the linear intervals for the curves and the pink arrows represent the BAU mL−1 at those points. As the reference curves are parallel to the IS within the linear interval, a conversion factor can be applied to convert relative ratios to international BAU mL−1 units (Supplementary table 4). For illustrations purposes to show IS and reference curves in the same panel, the x‐axis is BAU mL−1 for IS and μg mL−1 * 100 for the reference curves.
Figure 4
Figure 4
Dose response curves or single‐point snELISA and conversion to International Units using the WHO International Standard. (a) Correlation of spike to RBD as snELISA antigens is shown for 11 samples in a 10‐point dilution series (individual curves are shown in Supplementary figure 13). (b) Dose response curves (n = 4) for the spike snELISA. Samples were from convalescent SARS‐CoV‐2 individuals 3 weeks after 1 or 2 doses of Comirnaty vaccine (Pfizer) or an uninfected individual (from a surveillance study) 3 weeks post‐first dose of Comirnaty. Pooled sera were from 100 individuals with or without prior SARS‐CoV‐2 infection. (c) Single‐point measurements (at 1:5 dilution) using the spike snELISA. (d) Titration of the neutralising activity of the WHO IS using snELISA. Raw luminescence values were converted to inhibition of ACE2‐Spike binding; maximal signal (i.e. 0% inhibition) was measured in absence of convalescent plasma (PBS only). The normalised data was fitted with a four‐parameter logistic function and the 95% confidence interval (in red) and two standard deviations (in pink) is shown. (e) Box plots for the WHO reference panel 20/268 using RBD (blue, Toronto, ACE2 source: Rini) or spike (orange, Ottawa) as antigens. For RBD, n = 3 at 1:10 dilution for Low, n = 4 at 1:10 dilution for Mid, n = 7 at 1:40 and 1:160 for High. For spike, n = 12 for High (4 replicates at 3 dilutions), n = 8 for LowS HighN and Mid (4 replicates at 2 dilutions) and n = 4 for Low (2 replicates at 2 dilutions). The WHO bar graph shows the geometric mean from the WHO study and the lines with half arrows represent a 0.5–2‐fold range from the geometric mean. No inhibition was seen for the LowS HighN sample for RBD.
Figure 5
Figure 5
Visualisation of data from three antigen testing. The results are from known negative and positive samples (a) and samples from a longitudinal study of patients on dialysis at baseline and after their first vaccine dose (b). The dashed lines represent the thresholds for spike and N. The area with positives for both spike and N (colored in gray) is indicative of natural infection and the area showing samples that are N‐negative but spike‐positive (and RBD‐positive if colored) is highlighted in green on the right panel and is indicative of vaccination.

References

    1. Johns Hopkins University COVID‐19 dashboard. [cited February 25 2021]. Available from: https://coronavirus.jhu.edu/map.html
    1. Few Canadians had antibodies against SARS‐CoV‐2 in early 2021 – Statistics Canada. [updated July 6 2021; cited February 25 2022]. Available from: https://www150.statcan.gc.ca/n1/daily‐quotidien/210706/dq210706a‐eng.htm
    1. Serotracker. [updated February 22 2022; cited February 25 2022]. Available from: https://serotracker.com/en/Explore
    1. Chung H, He S, Nasreen S et al. Effectiveness of BNT162b2 and mRNA‐1273 covid‐19 vaccines against symptomatic SARS‐CoV‐2 infection and severe covid‐19 outcomes in Ontario, Canada: test negative design study. BMJ 2021; 374: n1943. - PMC - PubMed
    1. Health Infobase Canada – COVID‐19 vaccination coverage. [updated February 18 2022; cited February 25 2022]. Available from: https://health‐infobase.canada.ca/covid‐19/vaccination‐coverage/