

Soluble Programmed Cell Death Protein 1 and Its Ligand: Potential Biomarkers to Predict Acute Kidney Injury After Surgery in Critically Ill Patients
- PMID: 35356070
- PMCID: PMC8959723
- DOI: 10.2147/JIR.S356475
Soluble Programmed Cell Death Protein 1 and Its Ligand: Potential Biomarkers to Predict Acute Kidney Injury After Surgery in Critically Ill Patients
Abstract
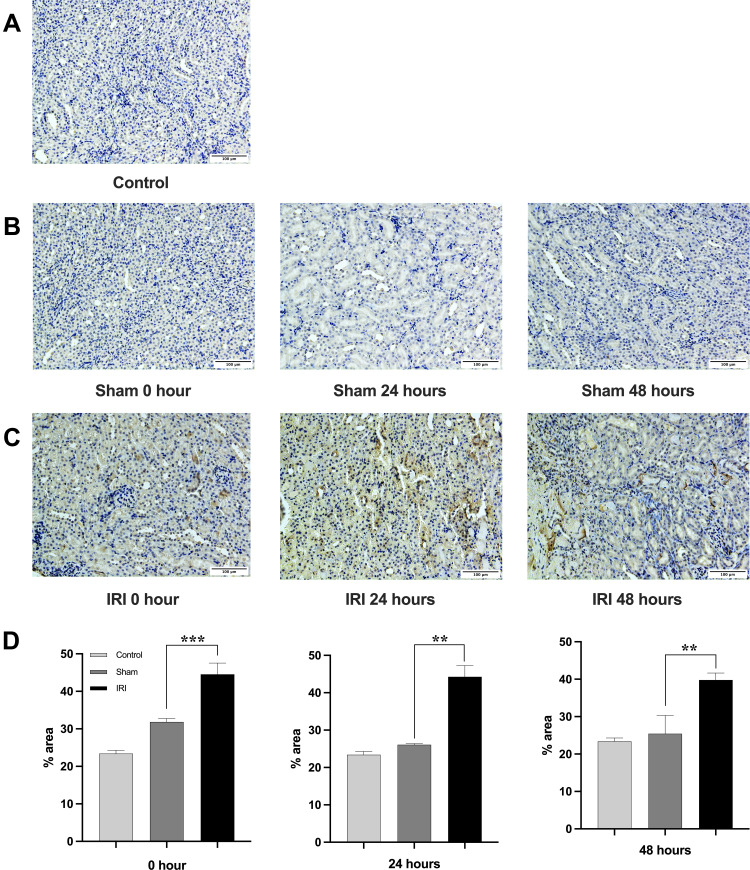
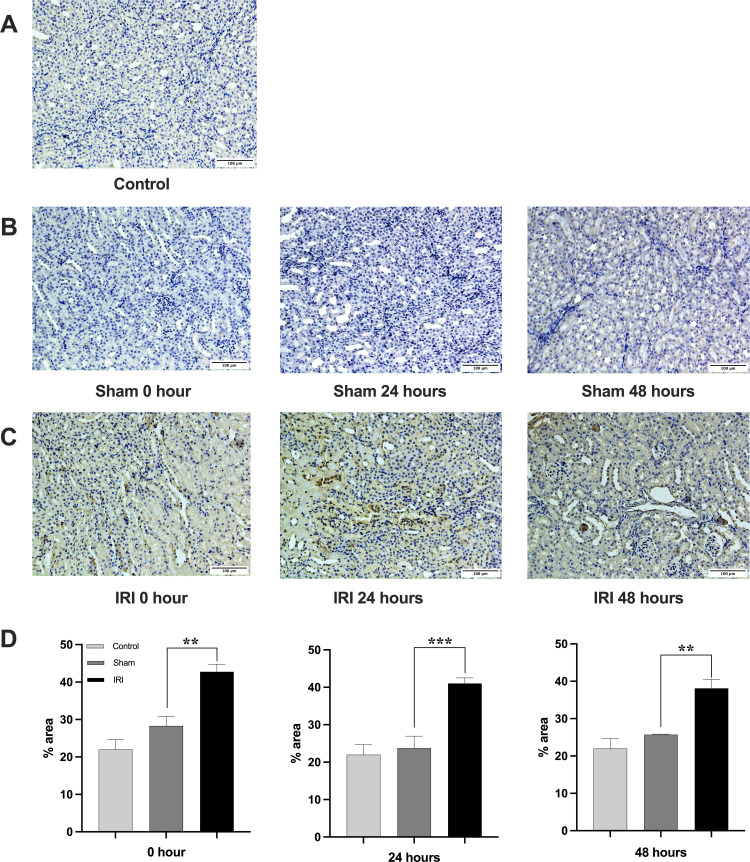
Purpose: Programmed cell death protein 1 (PD-1) and programmed death-ligand 1 (PD-L1) have been detected in injury kidney. However, their expressions are unclear in mice kidneys under renal ischemia-reperfusion injury (IRI). In this study, we would observe the expressions of PD-1 and PD-L1 in kidney tissues and analyze the association between the concentrations of PD-1 and PD-L1 in mouse kidney homogenate and the corresponding concentrations of soluble PD-1 (sPD-1) and soluble PD-L1 (sPD-L1) in plasma after renal IRI. Further, we explored the predictive value of sPD-1 and sPD-L1 for acute kidney injury (AKI) in high-risk patients after surgery.
Methods: This study established an AKI model induced by IRI in mice. Plasma, kidney samples, and homogenate were collected 0h, 24h, and 48h after surgery for immunohistochemistry and enzyme-linked immunosorbent assay. Then, we continuously enrolled 88 AKI high-risk patients who underwent noncardiac surgery. The biomarkers, including sPD-1, sPD-L1, and urine neutrophil gelatinase-associated lipocalin (NGAL), tissue inhibitor of metalloproteinase-2 (TIMP-2), insulin-like growth factor-binding protein 7 (IGFBP7), were detected immediately after surgery.
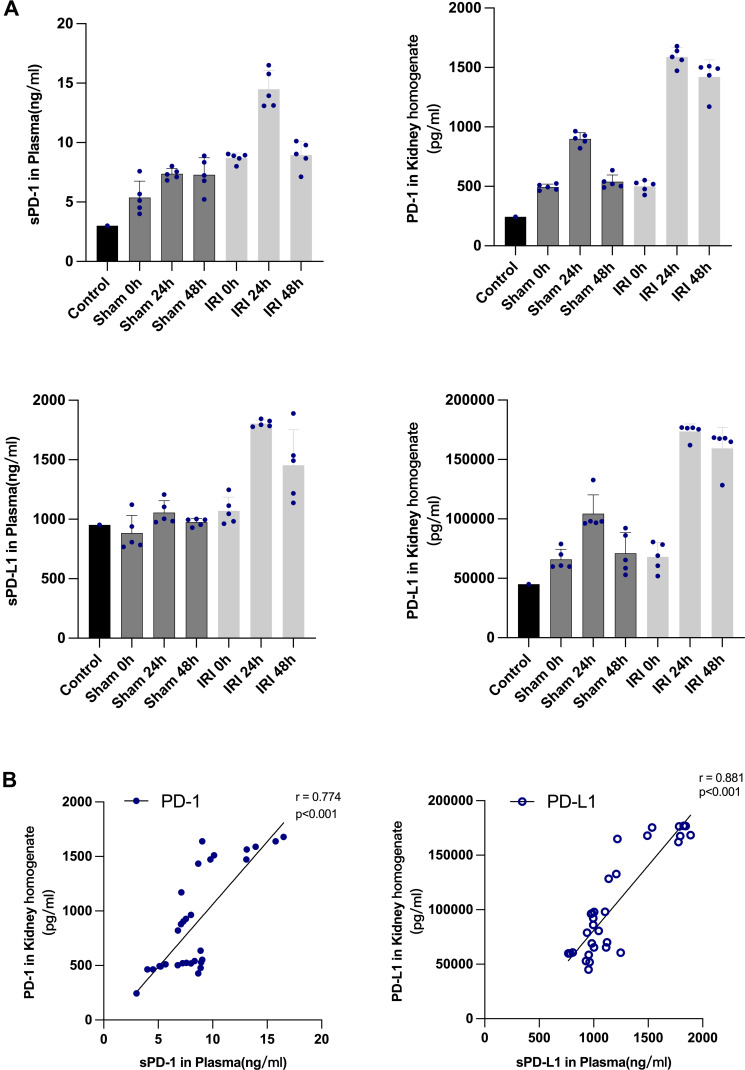
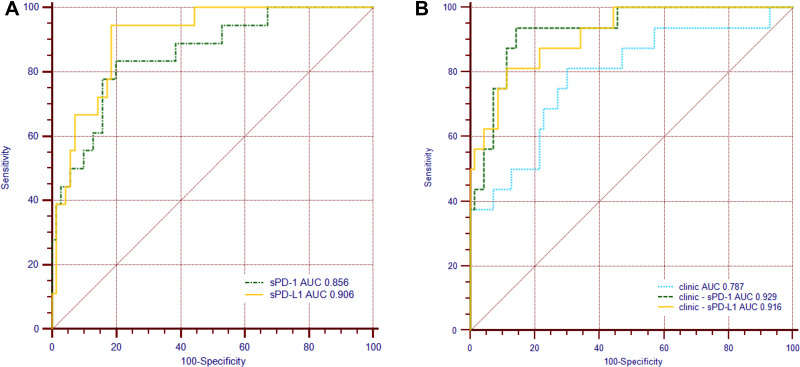
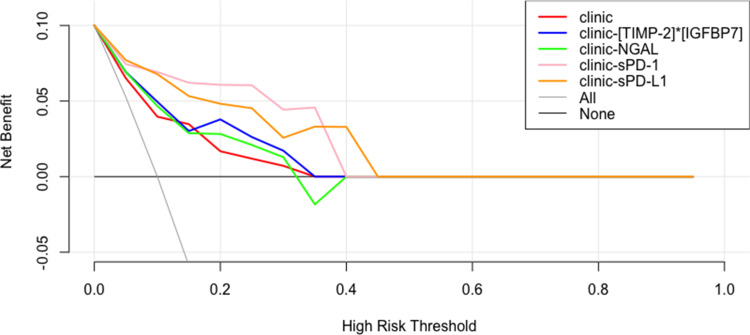
Results: Our data revealed the concentrations of PD-1 and PD-L1 in kidney homogenate, and sPD-1 and sPD-L1 in plasma significantly increased at 0h, 24h, and 48h after IRI. A positive association was found between PD-1 and sPD-1 (r = 0.774, p < 0.001), and between PD-L1 and sPD-L1 (r = 0.881, p < 0.001). Compared to NGAL, [TIMP-2]*[IGFBP7], sPD-1 and sPD-L1 showed better predictive abilities for AKI with an area under the ROC curve of 0.856 (95% confidence interval [CI]: 0.825-0.958, p < 0.001) and 0.906 (95% CI: 0.764-0.921, p < 0.001).
Conclusion: The increased expressions of PD-1 and PD-L1 in kidneys under IRI suggested they may play essential roles in AKI development. sPD-1 and sPD-L1 can indirectly reflect the expressions of PD-1 and PD-L1 in kidneys, respectively. sPD-1 and sPD-L1 showed excellent predictive ability for AKI in high-risk patients.
Keywords: acute kidney injury; ischemia-reperfusion injury; programmed cell death protein 1; programmed death-ligand 1.
© 2022 Wang et al.
Conflict of interest statement
The authors report no conflicts of interest or financial disclosure in this work.
Figures
References
LinkOut - more resources
Full Text Sources
Research Materials
Miscellaneous
