

Nomogram Predicts Risk and Prognostic Factors for Bone Metastasis of Pancreatic Cancer: A Population-Based Analysis
- PMID: 35356148
- PMCID: PMC8959409
- DOI: 10.3389/fendo.2021.752176
Nomogram Predicts Risk and Prognostic Factors for Bone Metastasis of Pancreatic Cancer: A Population-Based Analysis
Abstract
Background: The overall survival (OS) of pancreatic cancer (PC) patients with bone metastasis (BM) is extremely low, and it is pretty hard to treat bone metastasis. However, there are currently no effective nomograms to predict the diagnosis and prognosis of pancreatic cancer with bone metastasis (PCBM). Therefore, it is of great significance to establish effective predictive models to guide clinical practice.
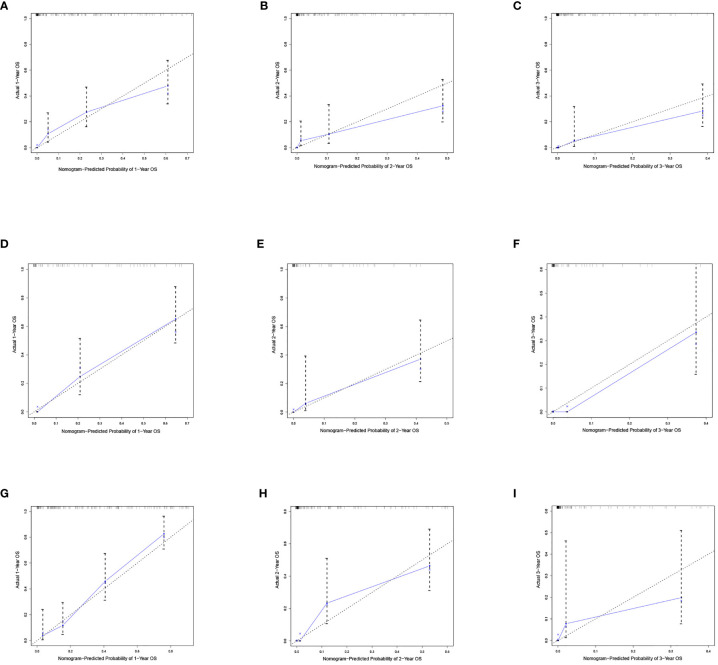
Methods: We screened patients from Surveillance Epidemiology and End Results (SEER) database between 2010 and 2016. The independent risk factors of PCBM were identified from univariable and multivariable logistic regression analyses, and univariate and multivariate Cox proportional hazards regression analyses were used to determine independent prognostic factors affecting the prognosis of PCBM. In addition, two nomograms were constructed to predict the risk and prognosis of PCBM. We used the area under the curve (AUC), C-index and calibration curve to determine the predictive accuracy and discriminability of nomograms. The decision curve analysis (DCA) and Kaplan-Meier(K-M) survival curves were employed to further confirm the clinical effectiveness of the nomogram.
Results: Multivariable logistic regression analyses revealed that risk factors of PCBM included age, primary site, histological subtype, N stage, radiotherapy, surgery, brain metastasis, lung metastasis, and liver metastasis. Using Cox regression analyses, we found that independent prognostic factors of PCBM were age, race, grade, histological subtype, surgery, chemotherapy, and lung metastasis. We utilized nomograms to visually express data analysis results. The C-index of training cohort was 0.795 (95%CI: 0.758-0.832), whereas that of internal validation cohort was 0.800 (95%CI: 0.739-0.862), and the external validation cohort was 0.787 (95%CI: 0.746-0.828). Based on AUC of receiver operating characteristic (ROC) analysis, calibration plots, and decision curve analysis (DCA), we concluded that the risk and prognosis model of PCBM exhibits excellent performance.
Conclusion: Nomogram is sufficiently accurate to predict the risk and prognostic factors of PCBM, allowing for individualized clinical decisions for future clinical work.
Keywords: Cox regression; Surveillance Epidemiology and End Results (SEER) database; bone metastasis; logistic regression; nomogram; pancreatic cancer; predictors.
Copyright © 2022 Zhang, Ji, Wang, Zhu, Luo, Zhang, Tong, Feng, Kang and Bi.
Conflict of interest statement
The authors declare that the research was conducted in the absence of any commercial or financial relationships that could be construed as a potential conflict of interest.
Figures


Similar articles
-
Two Novel Nomograms Predicting the Risk and Prognosis of Pancreatic Cancer Patients With Lung Metastases: A Population-Based Study.Front Public Health. 2022 May 31;10:884349. doi: 10.3389/fpubh.2022.884349. eCollection 2022. Front Public Health. 2022. PMID: 35712294 Free PMC article.
-
Nomograms for Predicting the Risk and Prognosis of Liver Metastases in Pancreatic Cancer: A Population-Based Analysis.J Pers Med. 2023 Feb 24;13(3):409. doi: 10.3390/jpm13030409. J Pers Med. 2023. PMID: 36983591 Free PMC article.
-
Evaluation of Risk Factors, and Development and Validation of Prognostic Prediction Models for Distant Metastasis in Patients With Rectal Cancer: A Study Based on the SEER Database and a Chinese Population.Cancer Control. 2024 Jan-Dec;31:10732748241303650. doi: 10.1177/10732748241303650. Cancer Control. 2024. PMID: 39579008 Free PMC article.
-
A New Online Dynamic Nomogram: Construction and Validation of a Predictive Model for Distant Metastasis Risk and Prognosis in Patients with Gastrointestinal Stromal Tumors.J Gastrointest Surg. 2023 Jul;27(7):1429-1444. doi: 10.1007/s11605-023-05706-9. Epub 2023 May 25. J Gastrointest Surg. 2023. PMID: 37231240 Review.
-
Analysis of prognostic factors of metastatic endometrial cancer based on surveillance, epidemiology, and end results database.Front Surg. 2023 Jan 6;9:1001791. doi: 10.3389/fsurg.2022.1001791. eCollection 2022. Front Surg. 2023. PMID: 36684133 Free PMC article. Review.
Cited by
-
Elevated serum MMP-1 associated with advanced disease stage and lymph node metastasis in patients with pancreatic carcinoma.Am J Cancer Res. 2023 Nov 15;13(11):5405-5417. eCollection 2023. Am J Cancer Res. 2023. PMID: 38058827 Free PMC article.
-
FAM50A as a novel prognostic marker modulates the proliferation of colorectal cancer cells via CylinA2/CDK2 pathway.PLoS One. 2025 Feb 25;20(2):e0318776. doi: 10.1371/journal.pone.0318776. eCollection 2025. PLoS One. 2025. PMID: 39999107 Free PMC article.
-
Personalized three-year survival prediction and prognosis forecast by interpretable machine learning for pancreatic cancer patients: a population-based study and an external validation.Front Oncol. 2024 Oct 21;14:1488118. doi: 10.3389/fonc.2024.1488118. eCollection 2024. Front Oncol. 2024. PMID: 39497722 Free PMC article.
-
Clinicopathological significance of cancer stem cell marker CD44/SOX2 in esophageal squamous cell carcinoma (ESCC) patients and construction of a nomogram to predict overall survival.Transl Cancer Res. 2024 Jun 30;13(6):2971-2984. doi: 10.21037/tcr-23-2313. Epub 2024 May 30. Transl Cancer Res. 2024. PMID: 38988936 Free PMC article.
-
An m6A/m5C/m1A/m7G-Related Long Non-coding RNA Signature to Predict Prognosis and Immune Features of Glioma.Front Genet. 2022 May 26;13:903117. doi: 10.3389/fgene.2022.903117. eCollection 2022. Front Genet. 2022. PMID: 35692827 Free PMC article.
References
MeSH terms
LinkOut - more resources
Full Text Sources
Medical