. 2022 Mar 9:13:823728.
doi: 10.3389/fgene.2022.823728. eCollection 2022.

Identification of a Novel Glycosyltransferase Prognostic Signature in Hepatocellular Carcinoma Based on LASSO Algorithm

Affiliations

Identification of a Novel Glycosyltransferase Prognostic Signature in Hepatocellular Carcinoma Based on LASSO Algorithm

Zhiyang Zhou et al. Front Genet. .

Abstract

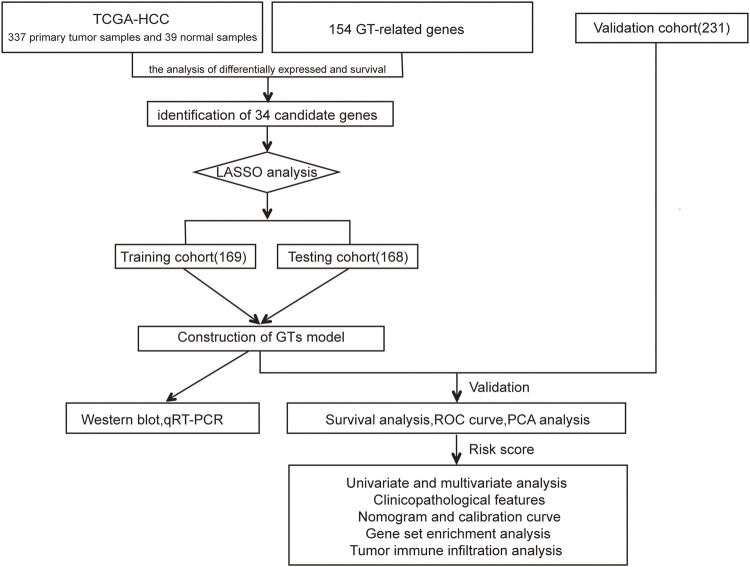
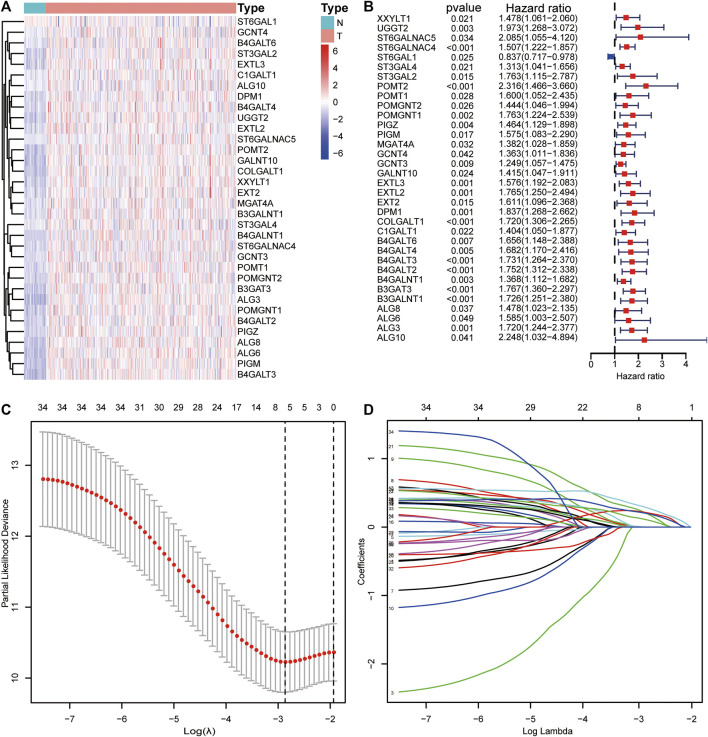
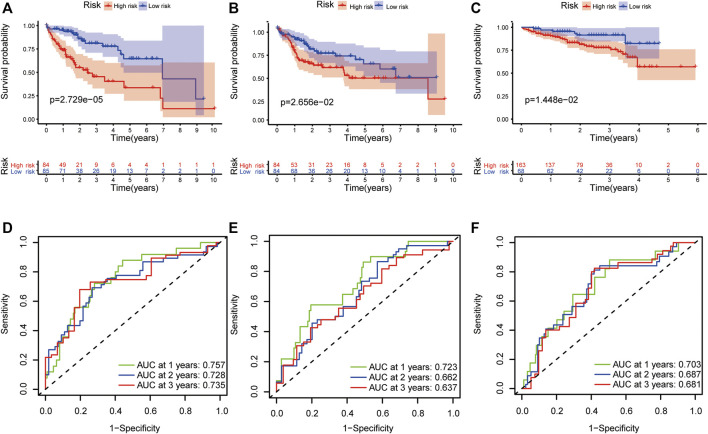
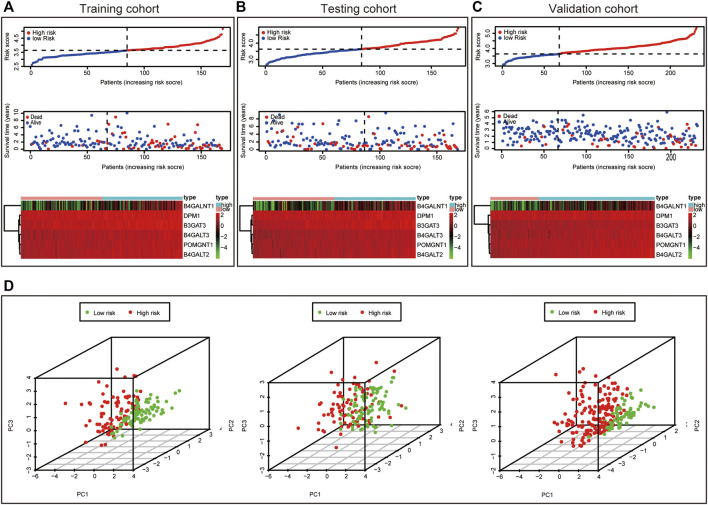
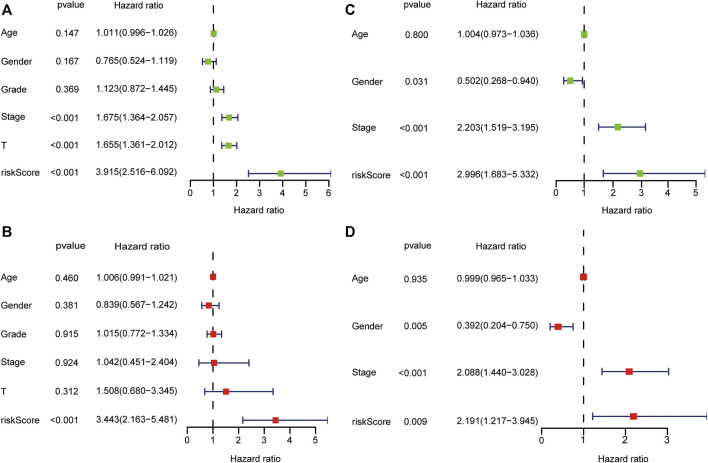
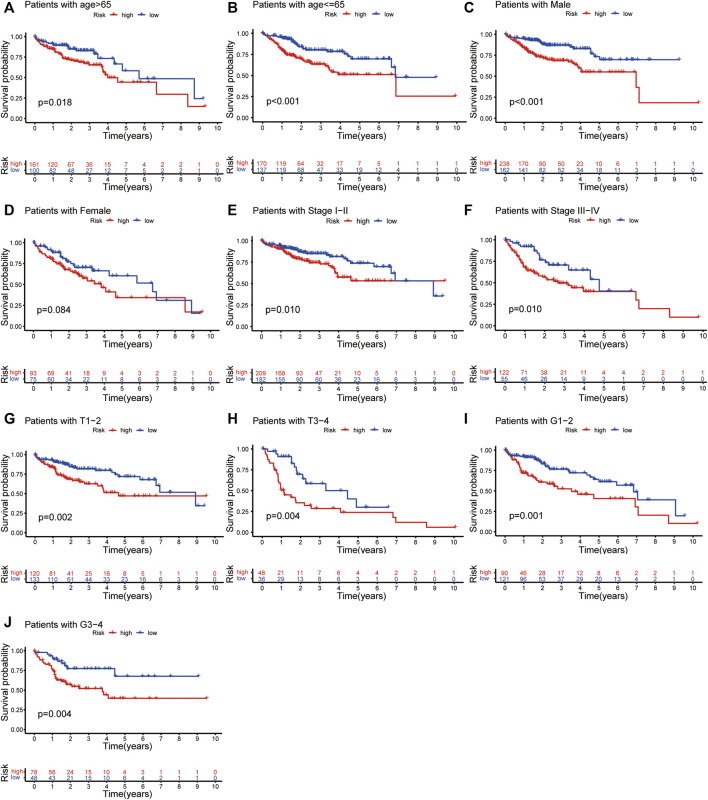
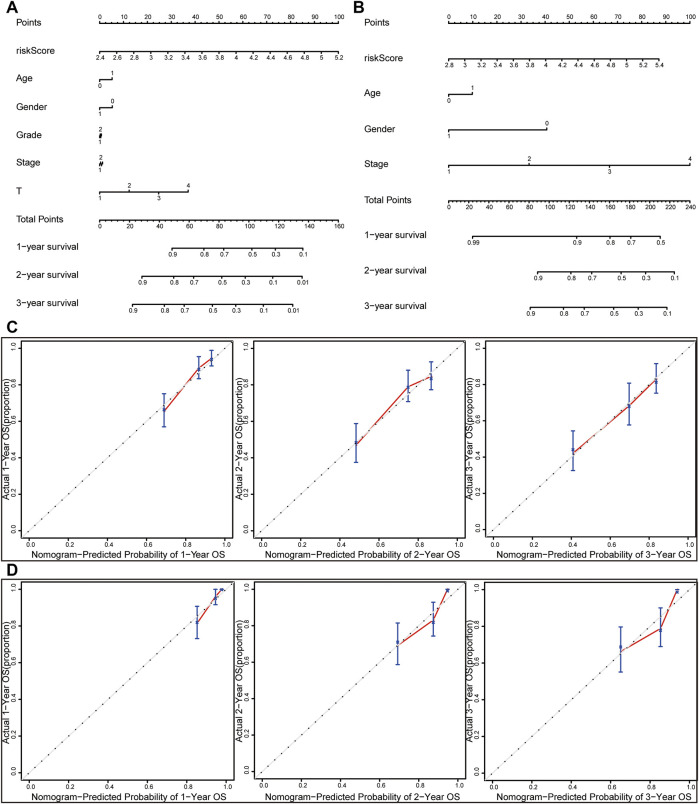
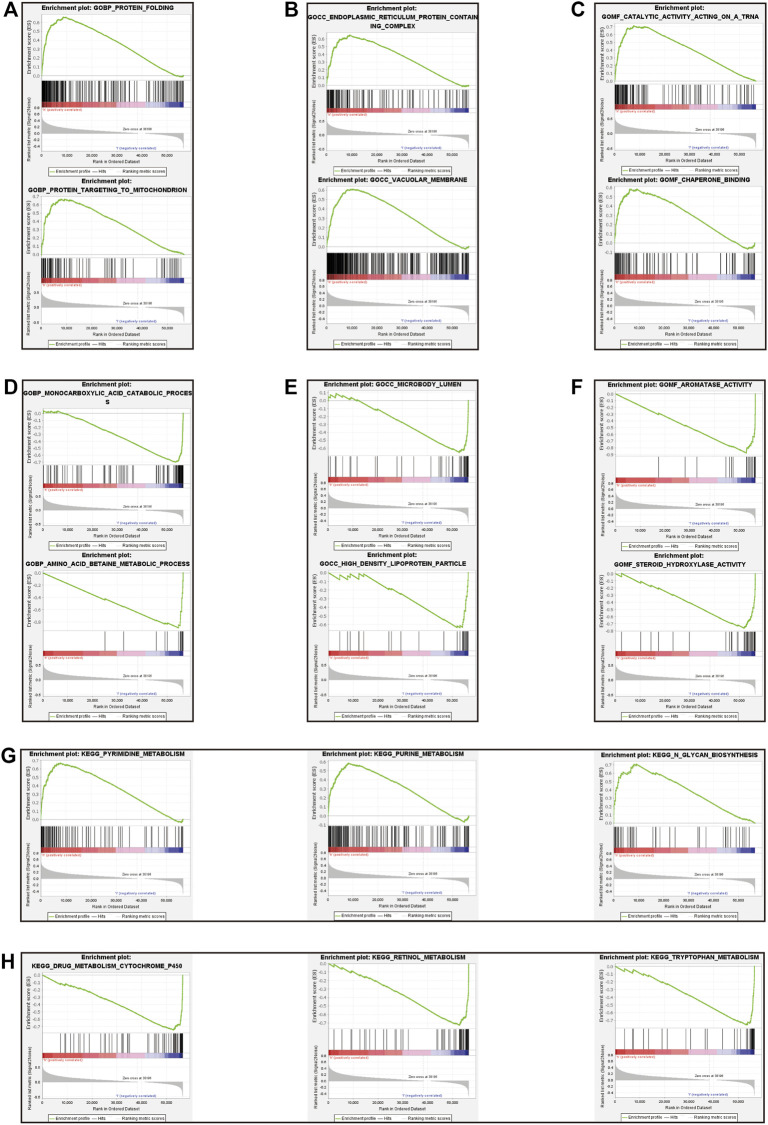
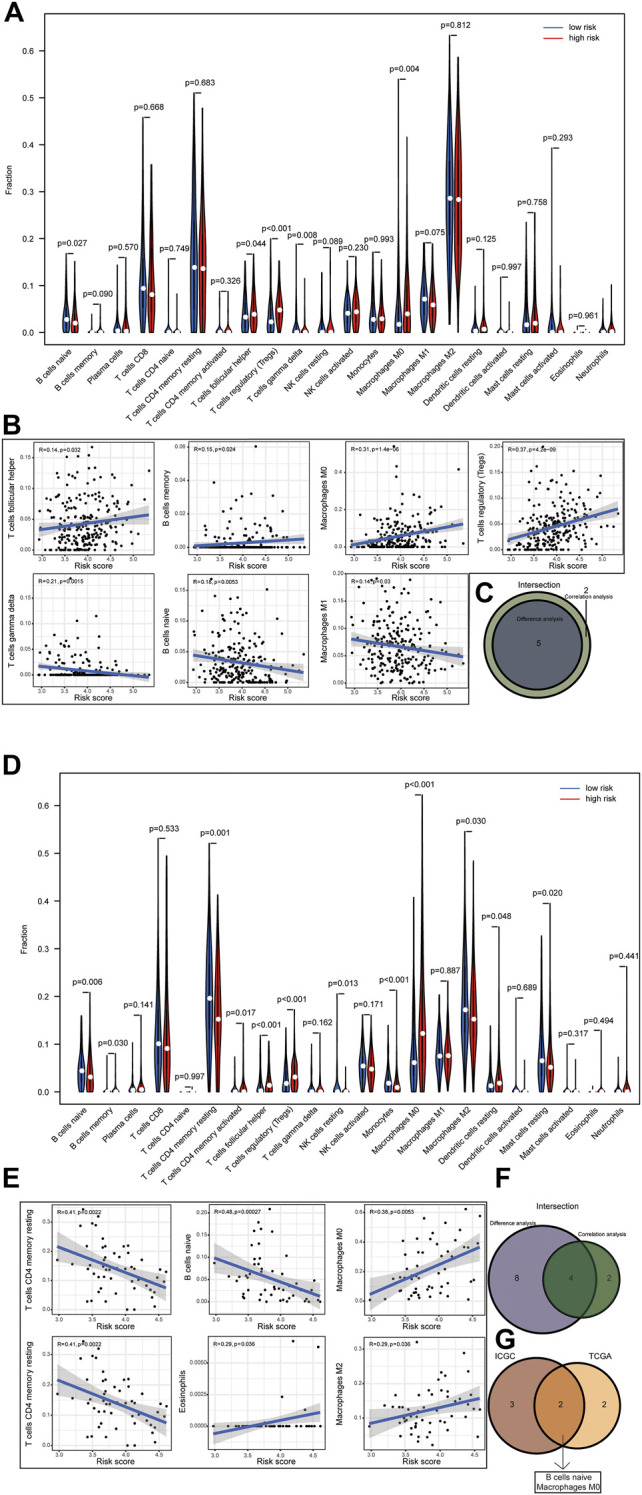
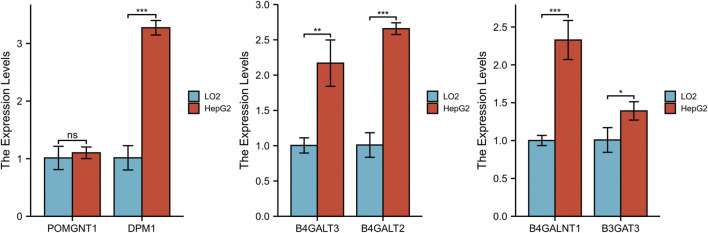
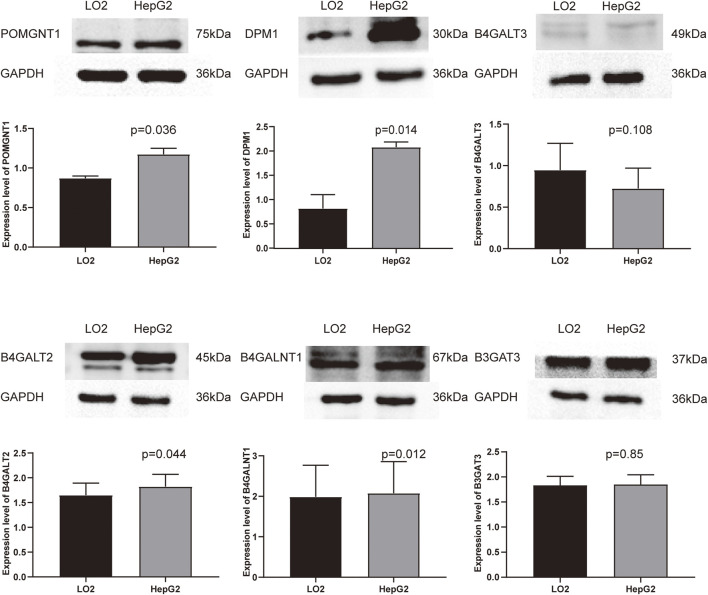
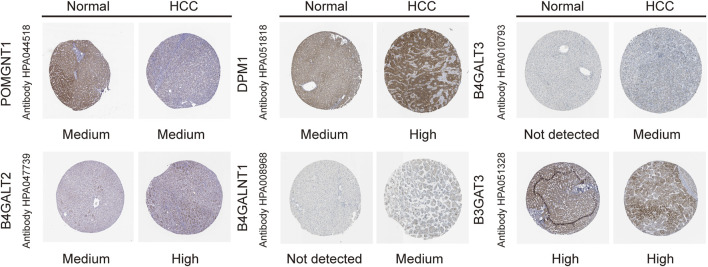
Although many prognostic models have been developed to help determine personalized prognoses and treatments, the predictive efficiency of these prognostic models in hepatocellular carcinoma (HCC), which is a highly heterogeneous malignancy, is less than ideal. Recently, aberrant glycosylation has been demonstrated to universally participate in tumour initiation and progression, suggesting that dysregulation of glycosyltransferases can serve as novel cancer biomarkers. In this study, a total of 568 RNA-sequencing datasets of HCC from the TCGA database and ICGC database were analysed and integrated via bioinformatic methods. LASSO regression analysis was applied to construct a prognostic signature. Kaplan-Meier survival, ROC curve, nomogram, and univariate and multivariate Cox regression analyses were performed to assess the predictive efficiency of the prognostic signature. GSEA and the "CIBERSORT" R package were utilized to further discover the potential biological mechanism of the prognostic signature. Meanwhile, the differential expression of the prognostic signature was verified by western blot, qRT-PCR and immunohistochemical staining derived from the HPA. Ultimately, we constructed a prognostic signature in HCC based on a combination of six glycosyltransferases, whose prognostic value was evaluated and validated successfully in the testing cohort and the validation cohort. The prognostic signature was identified as an independent unfavourable prognostic factor for OS, and a nomogram including the risk score was established and showed the good performance in predicting OS. Further analysis of the underlying mechanism revealed that the prognostic signature may be potentially associated with metabolic disorders and tumour-infiltrating immune cells.

Keywords: glycosyltransferase; hepatocellular carcinoma; lasso regression analysis; overall survival; prognostic signature.


Conflict of interest statement

The authors declare that the research was conducted in the absence of any commercial or financial relationships that could be construed as a potential conflict of interest.

Figures

FIGURE 1
FIGURE 1
Flowchart of our study.
FIGURE 2
FIGURE 2
Visualization of candidate genes. (A) Heatmap of the expression levels of candidate genes. (B) Forest plot of candidate genes. (C) Partial likelihood deviance of different combinations of variables calculated via the LASSO Cox regression model. (D) LASSO coefficient profiles of candidate genes.
FIGURE 3
FIGURE 3
Validation of the prognostic signature. The Kaplan–Meier survival plots of high-risk and low-risk groups in the training cohort (A), testing cohort (B) and validation cohort (C). The ROC curves of the prognostic signature in 1-, 2-, and 3-years survival in the training cohort (D), testing cohort (E) and validation cohort (F).
FIGURE 4
FIGURE 4
Characteristics of prognostic signature. Distribution of risk score, Survival status of HCC samples and Heat map of the expression of prognostic signature in the training cohort (A), testing cohort (B) and validation cohort (C). Principal component analysis (PCA) plot in the training cohort, testing cohort and validation cohort (D).
FIGURE 5
FIGURE 5
Forest plot of prognostic signature and clinical risk factors. The univariate Cox regression analysis in the TCGA dataset (A) and ICGC dataset (C). The multivariate Cox regression analysis in the TCGA dataset (B) and ICGC dataset (D).
FIGURE 6
FIGURE 6
Independent prognostic analysis of risk scores and clinicopathological features. The Kaplan–Meier survival plots of patients with age >65 and ≤65 (A,B); Males and females (C,D); Stage I-II and Stage III-IV (E,F) in both TCGA and ICGC dataset. The Kaplan–Meier survival plots of patients with tumour stage T1-2 and T3-4 (G,H); tumour grading G1-2 and G3-4 (I,J).
FIGURE 7
FIGURE 7
Nomograms and calibration curves for the prognostic signature. Nomograms for predicting the OS of 1-, 2-, and 3-years in the TCGA dataset (A) and ICGC dataset (B). Calibration curves of nomograms in the TCGA dataset (C) and ICGC dataset (D).
FIGURE 8
FIGURE 8
Gene set enrichment analysis between high-risk and low-risk groups. The result of top 3 in GO analysis in the high-risk group (A–C). The result of top 3 in GO analysis in the low-risk group (D–F). The upregulated KEGG pathways of top 3 in the high-risk group (G). The upregulated KEGG pathways of top 3 in the low-risk group (H).
FIGURE 9
FIGURE 9
(1–2) Correlation of risk score with tumor-infiltrating immune. Results of the infiltrating level of 22 immune cell types in the ICGC dataset (A) and TCGA dataset (D). Correlations of risk scores with immune infiltration level in the ICGC dataset (B) and TCGA dataset (E) (only significant correlations were plotted). Venn diagram of immune cells by the results of difference analysis and correlation analysis in the ICGC dataset (C) and TCGA dataset (F). Result of the overlapping immune cell in the ICGC dataset and TCGA dataset (G).
FIGURE 10
FIGURE 10
Validation of the mRNA expression levels of the prognostic genes in HCC cell line (HepG2) and normal hepatocyte cell line (LO2) using qRT–PCR.
FIGURE 11
FIGURE 11
Validation of the protein expression levels of the prognostic genes in HCC cell line (HepG2) and normal hepatocyte cell line (LO2) using Western blot.
FIGURE 12
FIGURE 12
Immunohistochemistry staining of the prognostic genes in HCC and normal liver tissues derived from the HPA database.

Similar articles

Cited by

References

    1. Barré L., Venkatesan N., Magdalou J., Netter P., Fournel-Gigleux S., Ouzzine M., et al. (2006). Evidence of Calcium‐dependent Pathway in the Regulation of Human β1,3‐glucuronosyltransferase‐1 (GlcAT‐I) Gene Expression: a Key Enzyme in Proteoglycan Synthesis. FASEB j. 20 (10), 1692–1694. 10.1096/fj.05-5073fje - DOI - PubMed
    1. Bingxiang X., Panxing W., Lu F., Xiuyou Y., Chao D. (2021). A Prognostic Model for Brain Glioma Patients Based on 9 Signature Glycolytic Genes. Biomed. Res. Int. 2021, 1–15. 10.1155/2021/6680066 - DOI - PMC - PubMed
    1. Cao B., Duan M., Xing Y., Liu C., Yang F., Li Y., et al. (2019). O‐GlcNAc Transferase Activates Stem‐like Cell Potential in Hepatocarcinoma through O‐GlcNAcylation of Eukaryotic Initiation Factor 4E. J. Cel Mol Med 23 (4), 2384–2398. 10.1111/jcmm.14043 - DOI - PMC - PubMed
    1. Chang H.-H., Chen C.-H., Chou C.-H., Liao Y.-F., Huang M.-J., Chen Y.-H., et al. (2013). β-1,4-Galactosyltransferase III Enhances Invasive Phenotypes via β1-Integrin and Predicts Poor Prognosis in Neuroblastoma. Clin. Cancer Res. 19 (7), 1705–1716. 10.1158/1078-0432.Ccr-12-2367 - DOI - PubMed
    1. Chen C.-H., Wang S.-H., Liu C.-H., Wu Y.-L., Wang W.-J., Huang J., et al. (2014). β-1,4-Galactosyltransferase III Suppresses β1 Integrin-Mediated Invasive Phenotypes and Negatively Correlates with Metastasis in Colorectal Cancer. Carcinogenesis 35 (6), 1258–1266. 10.1093/carcin/bgu007 - DOI - PubMed

LinkOut - more resources