. 2022 Mar 9:9:799052.
doi: 10.3389/fsurg.2022.799052. eCollection 2022.

From the Ground Up: Esophageal Atresia Types, Disease Severity Stratification and Survival Rates at a Single Institution

Affiliations

From the Ground Up: Esophageal Atresia Types, Disease Severity Stratification and Survival Rates at a Single Institution

Devon Michael Evanovich et al. Front Surg. .

Abstract

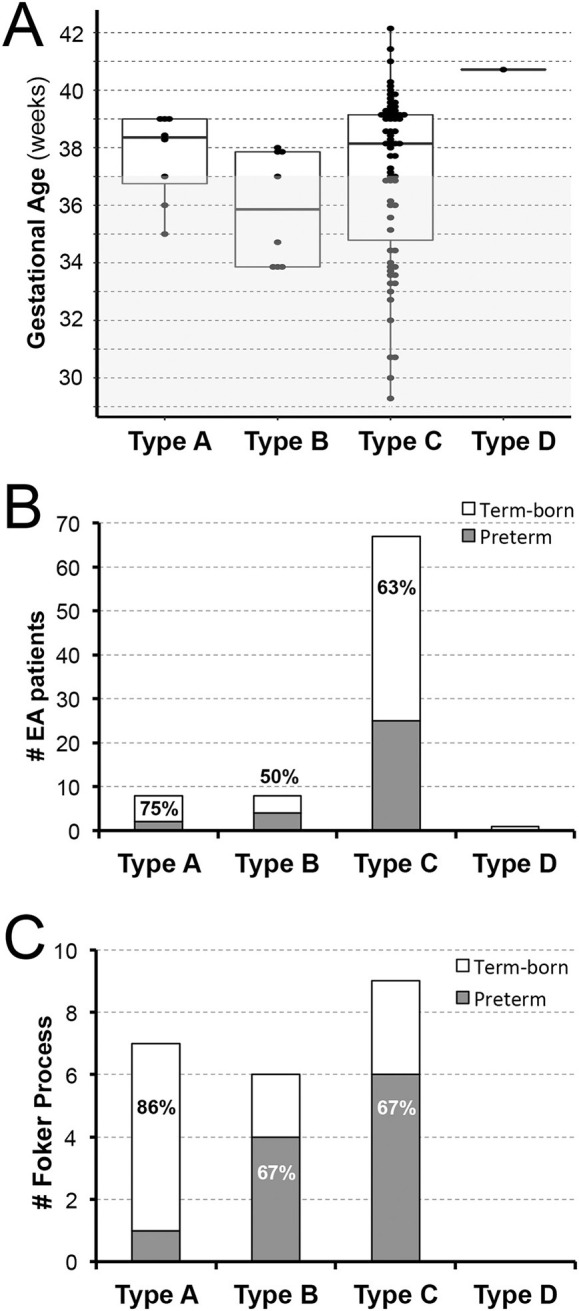
Esophageal atresia (EA), although a rare congenital anomaly, represents one of the most common gastrointestinal birth defects. There is a gap in our knowledge regarding the impact of perioperative critical care in infants born with EA. This study addresses EA types, disease severity stratification, and mortality in a retrospective cohort at a single institution. Institutional Review Board approved our retrospective cross-sectional study of term-born (n = 53) and premature infants (28-37 weeks of gestation; n = 31) that underwent primary surgical repair of EA at a single institution from 2009-2020. Demographic and clinical data were obtained from the electronic medical record, Powerchart (Cerner, London, UK). Patients were categorized by (i) sex, (ii) gestational age at birth, (iii) types of EA (in relation to respiratory tract anomalies), (iv) co-occurring congenital anomalies, (v) severity of disease (viz. American Society of Anesthesiologists (ASA) and Pediatric Risk Assessment (PRAm) scores), (vi) type of surgical repair for EA (primary anastomosis vs. Foker process), and (vii) survival rate classification using Spitz and Waterston scores. Data were presented as numerical sums and percentages. The frequency of anatomical types of EA in our cohort parallels that of the literature: 9.5% (8/84) type A, 9.5% (8/84) type B, 80% (67/84) type C, and 1% (1/84) type D. Long-gap EA accounts for 88% (7/8) type A, 75% (6/8) type B, and 13% (9/67) type C in the cohort studied. Our novel results show a nearly equal distribution of sex per each EA type, and gestational age (term-born vs. premature) by anatomical EA type. PRAm scoring showed a wider range of disease severity (3-9) than ASA scores (III and IV). The survival rate in our EA cohort dramatically increased in comparison to the literature in previous decades. This retrospective analysis at a single institution shows incidence of EA per sex and gestational status for anatomical types (EA type A-D) and by surgical approach (primary anastomosis vs. Foker process for short-gap vs. long-gap EA, respectively). Despite its wider range, PRAm score was not more useful in predicting disease severity in comparison to ASA score. Increased survival rates over the last decade suggest a potential need to assess unique operative and perioperative risks in this unique population of patients. Presented findings also represent a foundation for future clinical studies of outcomes in infants born with EA.

Keywords: ASA; EA; LGEA; PRAm; mortality; premature; term; term-born infant.


Conflict of interest statement

The authors declare that the research was conducted in the absence of any commercial or financial relationships that could be construed as a potential conflict of interest.

Figures

Figure 1
Figure 1
Retrospective Analysis of Incidence of Primary Esophageal Atresia Repair at a Single Institution. Data was retrospectively collected from 2009–2020 (n = 84). Pie chart in (A) summarizes the percent (%) incidence of esophageal atresia (EA) by anatomical classification that is schematically illustrated in (B). According to our retrospective data analysis, anatomical type C of EA is the most frequently encountered. Graph in (C) also illustrates nearly equal sex distribution per anatomical type with females found in 50% in type A, 62.5% in type B, and 48% in type C. Graph in (D) summarizes the incidence of long-gap EA patients (n = 22) that underwent Foker process (–8). Incidence of long-gap EA follows the trend per anatomical type and sex, similar to the cohort as a whole (see Results for more detail).
Figure 2
Figure 2
Retrospective Analysis of Esophageal Atresia Classification by Gestational Age at Birth. Retrospective data of infants born with esophageal atresia (EA) was collected from 2009–2020 (n = 84) and included infants born ≥28 weeks of gestation that were classified as term-born (37–42 weeks gestation) or premature (28–37 weeks of gestation). (A) Illustrates individual distribution of gestational age at birth per EA type (dots), while gray area schematically marks prematurity (<37 weeks of gestation). (B) Summarizes percent (%) incidence of EA per anatomical type and gestational age groups with either equal (type B) or predominant incidence of term-born patients (type A and C). In this cohort of infants with primary surgical repair of EA at our institution, we report only one term-born infant with type D EA. For illustration of anatomical EA types, please see Figure 1B. (C) Summarizes incidence of infants that underwent Foker process (–8) for long-gap EA repair. We report equal incidence of term-born and preterm patients. However, term-born patients with long-gap EA were predominantly noted in type A (6/7; 86%) while premature infants with long-gap EA represented majority in type B (4/6; 67%) and type C (6/9; 67%) anatomical EA type.
Figure 3
Figure 3
Underlying Disease Severity Stratification in Esophageal Atresia Cohort. Graphs illustrate incidence of American Society of Anesthesiologists (ASA) Physical Status classification (A) and Pediatric Risk Assessment (PRAm) severity scores (B) in infants born with esophageal atresia (EA) that underwent primary repair at a single institution from 2009-2020 (n = 84). Definition of scoring is shown in summary tables on the right for both the ASA Physical Status (16) and PRAm scoring (–19). Graphs show stratification by anatomical types of EA (type A-D) and gestational age (term-born and premature; see Methods section). Specifically, all patients in this study were rated as either ASA Physical Status III or IV (A). For the most common type C EA, the majority of term-born patients had ASA III status (27/42; 64%), while the majority of premature infants were assigned ASA IV status (19/25; 76%) implicating premature infants were more critically ill in the most common type of EA, type C. Graph in (B) illustrates distribution of PRAm scores per anatomical type and gestational age. Considering all infants had surgery when <12 months of age, the minimal score was 3. Since none of the infants had co-existing malignancy, the highest score was 9. From the graph in (B), one can infer that premature infants had higher median score for type B EA, but lower median score for type C (thick horizontal line). Individual values are represented as dots, boxes span the interquartile range (IQR) (first and third quartile), and whiskers represent maximum and minimum values.
Figure 4
Figure 4
Pediatric Risk Assessment (PRAm) Scores in a Retrospective Cohort of Infants Born with Esophageal Atresia. (A) Shows PRAm scores of term-born (left) and preterm patients (right) illustrating a wide range of PRAm score across gestational age of infants born with esophageal atresia (EA; n = 84). Note a subtle tendency of term-born patients for lower, and premature patients for higher PRAm scores. (B) Plots PRAm scores in relation to American Society of Anesthesiologists (ASA) Physical Status Classification. Despite more premature infants having had higher ASA IV classification (21/31; 68%) in comparison to term-born (22/53; 41%; see also Figure 3A), PRAm score shows wide distribution of scores between 3 and 9. Such outlining is in support of ASA and not PRAm scoring in assessing disease severity when gestational age is the primary factor.
Figure 5
Figure 5
Disease Severity Stratification of Infants Born with Esophageal Atresia by Type of Surgical Repair. (A) Illustrates wide distribution of Pediatric Risk Assessment (PRAm) scores (from scores 3–9) by the type of surgical repair: (i) direct anastomosis for short-gap esophageal atresia (EA) repair (left), and (ii) Foker process (–8) for long-gap EA repair (right). (B) Summarizes severity of disease per type of surgical repair in relation to the gestation age at birth. Similar to data in Figure 4A, note the subtle tendency of term-born patients having had lower, and premature patients higher PRAm scores. When PRAm scores are graphed in relation to American Society of Anesthesiologists (ASA) physical status (C), we report more infants with long-gap EA with an ASA IV classification (73%; 16/22).

Similar articles

Cited by

References

    1. Sfeir R, Michaud L, Salleron J, Gottrand F. Epidemiology of esophageal atresia. Dis Esophagus. (2013) 26:354–5. 10.1111/dote.12051 - DOI - PubMed
    1. Moore KL, Persaud TVN, Torchia MG. Alimentary System. In Moore KL, Persaud TVN, Torchia MG, editors. The Developing Human: Clinically Oriented Embryology. London: Elsevier India; (2012), p. 193–221. Available online at: https://www.elsevier.com/books/the-developing-human-clinically-oriented-...
    1. Pinheiro PF. Simões e Silva AC, Pereira RM. Current knowledge on esophageal atresia. World J Gastroenterol. (2012) 18:3662–72. 10.3748/wjg.v18.i28.3662 - DOI - PMC - PubMed
    1. Gross RE. The Surgery of Infancy and Childhood: its principles and techniques. Philadelphia, London: WB Saunders; (1953).
    1. Foker JE, Linden BC, Boyle EM Jr. Marquardt C. Development of a true primary repair for the full spectrum of esophageal atresia. Ann Surg. (1997) 226:533–41; discussion 41-3. 10.1097/00000658-199710000-00014 - DOI - PMC - PubMed