. 2022 Mar 11;110(3):355-381.
doi: 10.1109/JPROC.2022.3149785.

Wearable Photoplethysmography for Cardiovascular Monitoring

Affiliations

Wearable Photoplethysmography for Cardiovascular Monitoring

Peter H Charlton et al. Proc IEEE Inst Electr Electron Eng. .

Abstract

Smart wearables provide an opportunity to monitor health in daily life and are emerging as potential tools for detecting cardiovascular disease (CVD). Wearables such as fitness bands and smartwatches routinely monitor the photoplethysmogram signal, an optical measure of the arterial pulse wave that is strongly influenced by the heart and blood vessels. In this survey, we summarize the fundamentals of wearable photoplethysmography and its analysis, identify its potential clinical applications, and outline pressing directions for future research in order to realize its full potential for tackling CVD.

Keywords: Cardiovascular (CV); photoplethysmogram (PPG); pulse wave; sensor; signal processing; smartwatch.


Figures
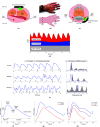
Fig. 1.
Fig. 1.
Acquiring PPG signals. (a)–(c) Cross sections of the wrist and finger showing Typical configurations for acquiring PPG signals. (b) Wearable PPG sensors. (d) Physiological Origins of the PPG signal, showing attenuation of light due to pulsatile arterial blood, venous blood, and other tissues. (e) Comparison of PPG recordings (left) and their frequency spectra (right) with electrocardiogram (ECG) measurements during different activities, acquired using infrared reflectance photoplethysmography at the finger. (f)–(h) Key features of a PPG pulse wave and how they change with age and exercise. See the Supplementary Material for additional details and images. Sources: (a) and (c) are adapted from (public domain), (b) is adapted from https://freesvg.org/vector-drawing-of-outline-of-a-raised-hand (public domain), (d) is adapted from under CC BY 4.0, (e)–(h) data from the Vortal dataset, acquired at the finger , and (f) is adapted from under CC BY 4.0.
Fig. 2.
Fig. 2.
Preprocessing PPG signals. (a) Filtering to eliminate low-frequency content. (b) Filtering to eliminate high-frequency content. (c) Assessing PPG signal quality: segment of PPG signal containing a period of low-quality signal (red) from which pulse wave features cannot be reliably extracted. (d) Representing a PPG signal in phase space using symmetric projection attractor reconstruction. Sources: (a) and (b) data from the Vortal dataset, acquired using infrared reflectance photoplethysmography at the finger , (c) data from the PPG diary study , and (d) data from the Vortal dataset, acquired at the finger using a clinical monitor .
Fig. 3.
Fig. 3.
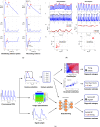
Processing PPG signals. (a) Two steps in extracting features from PPG pulse waves and their derivatives: (left) identifying fiducial points and (right) extracting feature measurements (extracting features from PPG pulse waves). (b) Typical process for detecting AF from PPG signals by quantifying IBI variability using the spread of points on a Poincaré plot (lowest plots, labeled IV.) with ECG signals shown for comparison—these plots all show data from the same subject with the left-hand plots showing data while in AF and the right-hand plots showing data while in normal sinus rhythm. (c) Typical processes for developing models to analyze PPG signals using statistical modeling or machine learning. Sources: (a) is adapted from under CC BY 3.0 (DOI: 10.1088/1361-6579/aabe6a), (b) is adapted from under CC BY 4.0, and (c) is produced using data from the Vortal dataset acquired at the finger using a clinical monitor , data from the PWDB Database , and C. Burnett’s Artificial neural network diagram (https://commons.wikimedia.org/wiki/File:Artificial_neural_network.svg) under CC BY-SA 3.0.
Fig. 4.
Fig. 4.
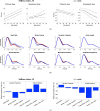
Determinants of PPG pulse wave features: Insights obtained using simulated PPG pulse waves. (a) Comparison of the changes in two pulse wave indices with age observed in simulated and clinical data. (b) Wrist PPG Pulse waves representative of a healthy 25-year old male in black and pulse waves under varying CV properties of ±1 standard deviation from the mean for a healthy individual in red and blue, respectively. (c) Influence of CV properties on two pulse wave features, expressed as the relative sensitivity index: the percentage change in a feature associated with a change in CV parameter of 1 standard deviation from baseline. Sources: data obtained from the PWDB database and analyzed using . Clinical data in (a) obtained from .

Similar articles

  • Using Smart Wearables to Monitor Cardiac Ejection .
    Mathieu A, Charlton PH, Alastruey J. Mathieu A, et al. Proceedings (MDPI). 2018 Nov 14;4(1):48. doi: 10.3390/ecsa-5-05744. eCollection 2018 Nov 14. Proceedings (MDPI). 2018. PMID: 35782202 Free PMC article.
  • Acquiring Wearable Photoplethysmography Data in Daily Life: The PPG Diary Pilot Study .
    Charlton PH, Kyriacou P, Mant J, Alastruey J. Charlton PH, et al. Eng Proc. 2020 Nov 14;2(1):80. doi: 10.3390/ecsa-7-08233. eCollection 2020. Eng Proc. 2020. PMID: 33778803 Free PMC article.
  • The 2023 wearable photoplethysmography roadmap.
    Charlton PH, Allen J, Bailón R, Baker S, Behar JA, Chen F, Clifford GD, Clifton DA, Davies HJ, Ding C, Ding X, Dunn J, Elgendi M, Ferdoushi M, Franklin D, Gil E, Hassan MF, Hernesniemi J, Hu X, Ji N, Khan Y, Kontaxis S, Korhonen I, Kyriacou PA, Laguna P, Lázaro J, Lee C, Levy J, Li Y, Liu C, Liu J, Lu L, Mandic DP, Marozas V, Mejía-Mejía E, Mukkamala R, Nitzan M, Pereira T, Poon CCY, Ramella-Roman JC, Saarinen H, Shandhi MMH, Shin H, Stansby G, Tamura T, Vehkaoja A, Wang WK, Zhang YT, Zhao N, Zheng D, Zhu T. Charlton PH, et al. Physiol Meas. 2023 Nov 29;44(11):111001. doi: 10.1088/1361-6579/acead2. Physiol Meas. 2023. PMID: 37494945 Free PMC article. Review.
  • Design of a Realtime Photoplethysmogram Signal Quality Checker for Wearables and Edge Computing.
    Banerjee T, Gavas RD, Bs M, Karmakar S, Ramakrishnan RK, Pal A. Banerjee T, et al. Annu Int Conf IEEE Eng Med Biol Soc. 2022 Jul;2022:1323-1326. doi: 10.1109/EMBC48229.2022.9871741. Annu Int Conf IEEE Eng Med Biol Soc. 2022. PMID: 36086651
  • Assessing hemodynamics from the photoplethysmogram to gain insights into vascular age: a review from VascAgeNet.
    Charlton PH, Paliakaitė B, Pilt K, Bachler M, Zanelli S, Kulin D, Allen J, Hallab M, Bianchini E, Mayer CC, Terentes-Printzios D, Dittrich V, Hametner B, Veerasingam D, Žikić D, Marozas V. Charlton PH, et al. Am J Physiol Heart Circ Physiol. 2022 Apr 1;322(4):H493-H522. doi: 10.1152/ajpheart.00392.2021. Epub 2021 Dec 24. Am J Physiol Heart Circ Physiol. 2022. PMID: 34951543 Free PMC article. Review.

Cited by

References

    1. Roth G. A.et al., “Global, regional, and national burden of cardiovascular diseases for 10 causes, 1990 to 2015,” J. Amer. College Cardiol., vol. 70, no. 1, pp. 1–25, Jul. 2017, doi: 10.1016/j.jacc.2017.04.052. - DOI - PMC - PubMed
    1. Stewart J., Manmathan G., and Wilkinson P., “Primary prevention of cardiovascular disease: A review of contemporary guidance and literature,” JRSM Cardiovascular Disease, vol. 6, pp. 1–9, Jan. 2017, doi: 10.1177/2048004016687211. - DOI - PMC - PubMed
    1. Mück J. E., Ünal B., Butt H., and Yetisen A. K., “Market and patent analyses of wearables in medicine,” Trends Biotechnol., vol. 37, no. 6, pp. 563–566, Jun. 2019, doi: 10.1016/j.tibtech.2019.02.001. - DOI - PubMed
    1. Cisco. (2019). Cisco Visual Networking Index (VNI) Global Mobile Data Traffic Forecast Update, 2017–2022 White Paper. Accessed: Mar. 15, 2021. [Online]. Available: https://s3.amazonaws.com/media.mediapost.com/uploads/CiscoForecast.pdf
    1. Gartner. (2021). Gartner Forecasts Global Spending on Wearable Devices to Total $81.5 Billion in 2021. Accessed: Mar. 15, 2021. [Online]. Available: https://www.gartner.com/en/newsroom/press-releases/2021-01-11-gartner-fo...

LinkOut - more resources