. 2022 Mar 9:12:835217.
doi: 10.3389/fcimb.2022.835217. eCollection 2022.

Intestinal Flora Composition Determines Microglia Activation and Improves Epileptic Episode Progress

Affiliations

Intestinal Flora Composition Determines Microglia Activation and Improves Epileptic Episode Progress

Xiaomi Ding et al. Front Cell Infect Microbiol. .

Abstract

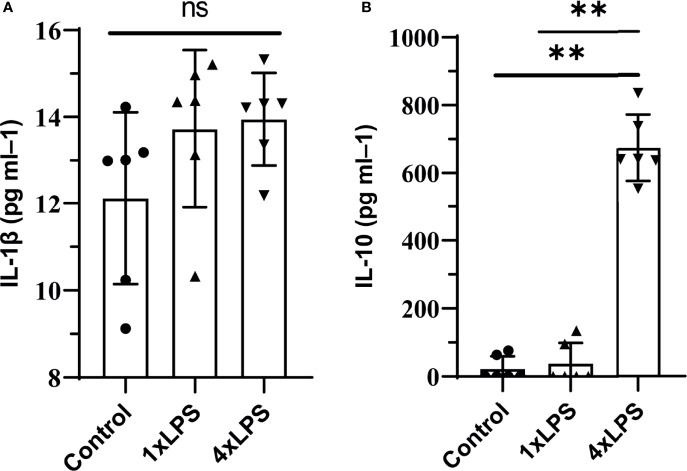
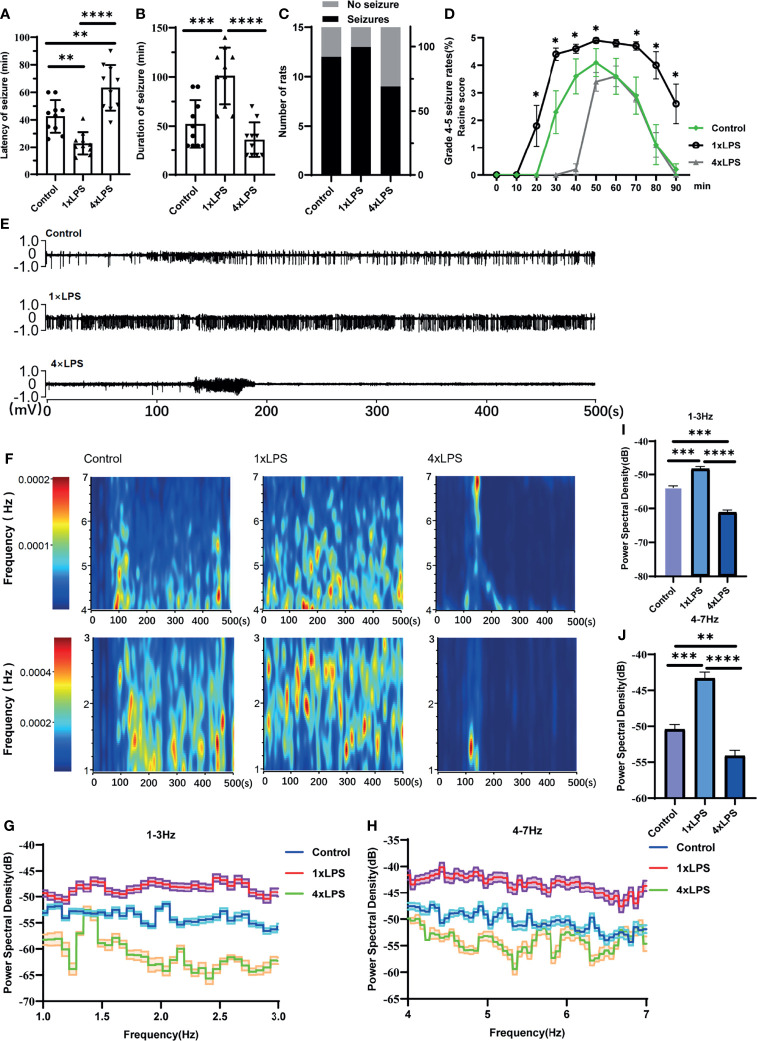
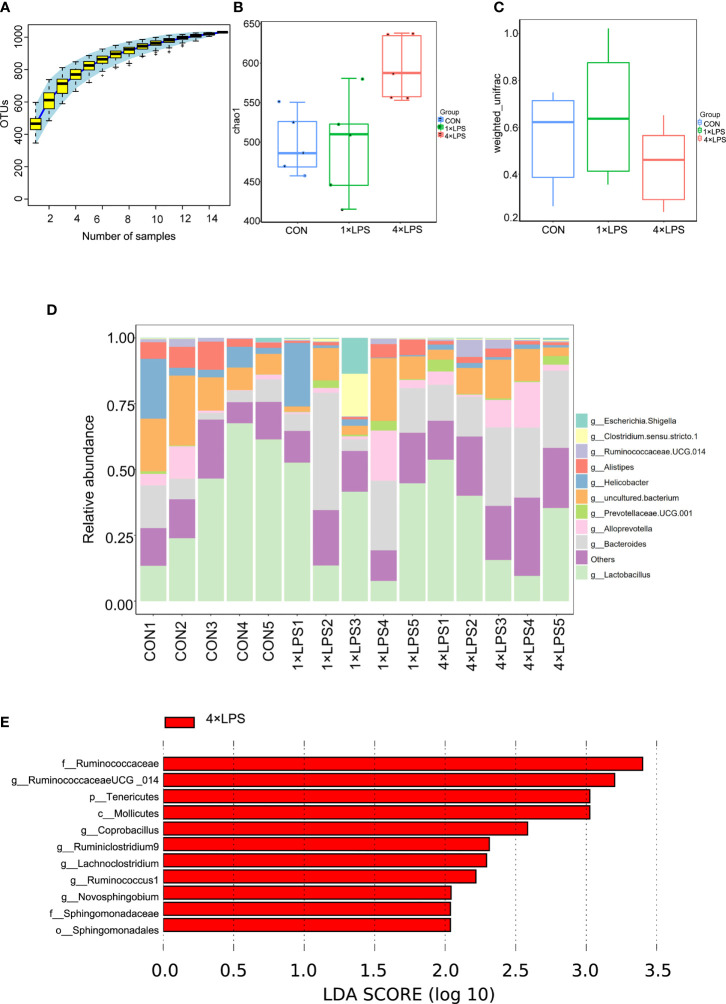
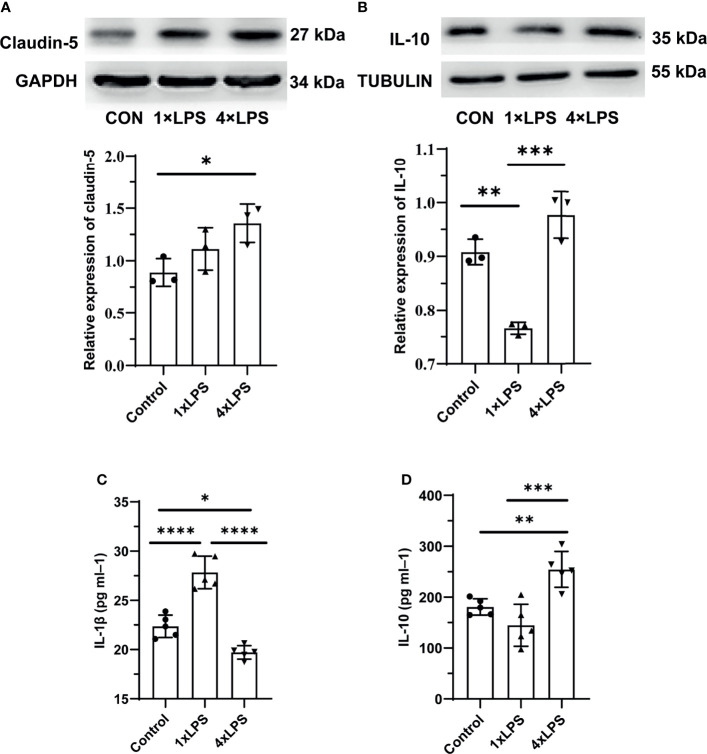
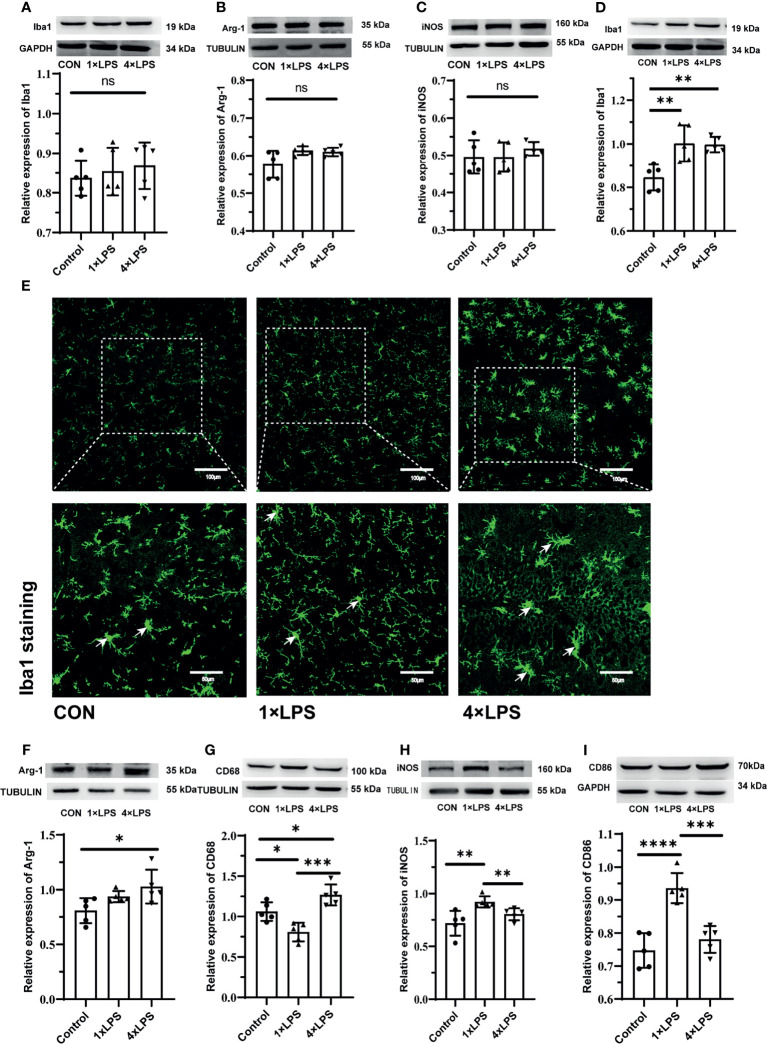
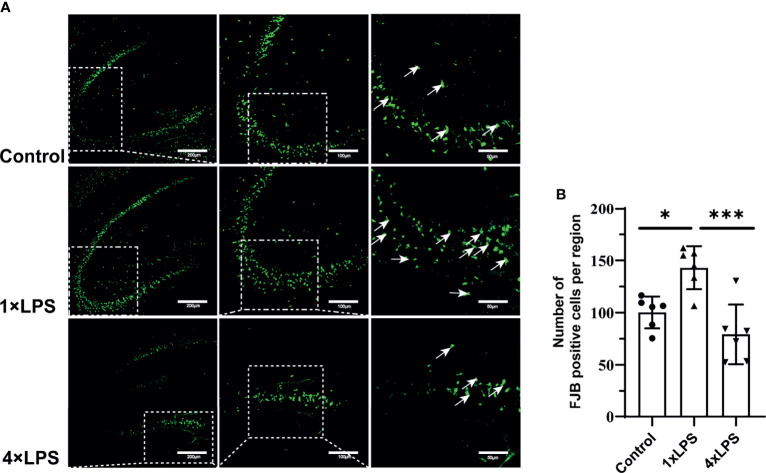
In response to environmental stimuli, immune memory mediates the plasticity of myeloid cells. Immune training and immune tolerance are two aspects of plasticity. Microglia that are immunologically trained or immunologically tolerant are endowed with a tendency to differentiate into alternative dominant phenotypes (M1/M2). Male C57BL/6 mice (immune-training group, immune-tolerant group, and control group) were used to establish the kainic acid epilepsy model. The seizure grade, duration, latency, hippocampal potential, and energy density were used to evaluate seizures, and the changes in the polarization of microglia were detected by western blot. 16S rDNA sequencing showed that the abundance of Ruminococcus in the immune-tolerant group was the dominant flora. Our research connections Intestinal microorganisms, brain immune status, and epilepsy behavior together. Pro-inflammatory M1 phenotype and anti-inflammatory M2 phenotype mediate and enhance and suppress subsequent inflammation, respectively. We conclude that intestinal microorganisms influence the occurrence and development of epilepsy by regulating the polarization of microglia.

Keywords: 16S rDNA; epilepsy; gut-brain axis; immune tolerance; intestinal flora; microglia.


Conflict of interest statement

The authors declare that the research was conducted in the absence of any commercial or financial relationships that could be construed as a potential conflict of interest.

Figures

Figure 1
Figure 1
Peripheral cytokine levels in C57BL/6 mice following lipopolysaccharide (LPS) injections. Note that tolerance is induced with repeated injections. IL-1β was detected on day 4, no differences were found. tolerance occurs after immune tolerance (4×LPS). (A) There was no significant difference in serum inflammatory factor IL-1β among the three groups. (B) The level of IL-10 in the immunotolerant group (4 x LPS) was significantly increased. ns, no significance. **P < 0.01 by one-way ANOVA (and nonparametric or mixed) followed by methods of multiple comparisons.
Figure 2
Figure 2
Peripheral immune stimulation modulates epileptic-seizure activity. (A) Immune training (1×LPS) and immune tolerance (4×LPS) on the latency of grade 4 or above epileptic seizures. (B) The duration of epileptic seizures. (C) The proportion of mice with stage 4 or 5 seizures. (D) The Racine score at different time points. (E) Representative traces of in vivo hippocampal electroencephalogram recordings at 1h after kanic acid injection. (F) Corresponding power spectrograms of each group. (G) 1-3Hz Energy spectrum trend curve. (H) 4-7Hz Energy spectrum trend curve. (I) Immune tolerance significantly reduced the average energy density of 1-3Hz oscillatory activity compared to the control group and immune training (1×LPS) group. (J) Immune tolerance (4×LPS) significantly reduced the average energy density of 4-7Hz oscillatory activity compared to the control group and immune training (1×LPS) group. *p<0.05; **p < 0.01; ***p < 0.001; ****p < 0.0001 by one-way ANOVA (and nonparametric or mixed) followed by methods of multiple comparisons.
Figure 3
Figure 3
Changes of intestinal flora. (A) The upward trend of the box chart of species accumulation curve is stable (n = 5 per group). (B) Comparison of microbial genus counts and α-diversity (as assessed by the chao 1) based on the genus profiles in the three groups (Control vs 4×LPS, p<0.05; 1×LPS vs 4×LPS, p <0.01, by t test).(C) Comparison of microbial genus counts and β-diversity (as assessed by the unweighted unifrac) based on the genus profiles in the three groups (1×LPS vs 4×LPS, p < 0.05, by t test). (D) Composition ratio of three groups of samples at genus level. (E) The red area in the histogram of LDA value distribution indicates the microbial groups that play an important role in 4 × LPS. Only the species whose LDA score is greater than the set value (the default setting is 2) are shown in the graph, and the length of the histogram represents the LDA value. The species whose LDA value is greater than 2 by default are Biomarker with statistical differences between groups. Source data are provided as a Source Data file. 1×LPS: immune training; 4×LPS: immune tolerance; LDA: Linear Discriminant Analysis.
Figure 4
Figure 4
Intestinal barrier and systemic inflammation after establishing epilepsy model. (A) Western blot showing protein expression of Claudin-5 protein. Data are expressed as the mean ± SEM (n = 3 per group). (B) Western blot showing protein expression of IL-10 protein. Data are expressed as the mean ± SEM (n = 3 per group). (C) Serum IL-1β level in 24h after epilepsy induced by kainic acid (n = 5 per group). (D) Serum IL-10 level in 24h after epilepsy induced by kainic acid (n = 5 per group). *P < 0.05; **p < 0.01; ***p < 0.001; ****p < 0.0001 by one-way ANOVA (and nonparametric or mixed) followed by methods of multiple comparisons. GAPDH: Glyceraldehyde 3-phosphate dehydrogenase.
Figure 5
Figure 5
Figures (A–C) show the expression and differentiation of microglia before epilepsy modeling. (A) Western blot showing protein expression of Iba1 protein. Data are expressed as the mean ± SEM (n = 5 per group). (B) Western blot showing protein expression of Arg-1 protein. Data are expressed as the mean ± SEM (n = 5 per group). (C) Western blot showing protein expression of iNOS protein. Data are expressed as the mean ± SEM (n = 5 per group). Figures (D–I) show the expression and differentiation of microglia 24 hours after epilepsy modeling. (D) Western blot showing protein expression of Iba1 protein. Data are expressed as the mean ± SEM (n = 5 per group). (E) Iba1 positive cells (green; Alexa Fluor-488 staining) were observed with fluorescence microscope. White arrows indicate Iba1 positive cells. Scale bars: 100 μm for 200×, 50 μm for 400×. (F) Western blot showing protein expression of Arg-1 protein. Data are expressed as the mean ± SEM (n = 5 per group). (G) Western blot showing protein expression of CD68 protein. Data are expressed as the mean ± SEM (n = 5 per group). (H) Western blot showing protein expression of iNOS protein. Data are expressed as the mean ± SEM (n = 5 per group). (I) Western blot showing protein expression of CD86 protein. Data are expressed as the mean ± SEM (n = 5 per group). ns, no significance. *P < 0.05; **p < 0.01; ***p < 0.001; ****p < 0.0001 by one-way ANOVA (and nonparametric or mixed) followed by methods of multiple comparisons.
Figure 6
Figure 6
| Immune tolerance alleviates neuronal degeneration after epilepsy. (A) FJB positive neurons (green; Alexa Fluor-488 staining) in hippocampus were observed with fluorescence microscope 24 hours after epilepsy modeling. White arrows indicate FJB positive neurons. Scale bars: 200 µm for 100×, 100 µm for 200×, 50 µm for 400×. (B) Quantitative statistics of FJB-positive cell number. Data are expressed as the mean ± SEM (n = 3 per group). *P < 0.05; ***p < 0.001 by one-way ANOVA (and nonparametric or mixed) followed by methods of multiple comparisons. FJB: Fluoro-Jade B.

Similar articles

Cited by

References

    1. Alvariza S., Fagiolino P., Vázquez M., Feria-Romero I., Orozco-Suárez S. (2014). Chronic Administration of Phenytoin Induces Efflux Transporter Overexpression in Rats. Pharmacol. Rep. PR 66, 946–951. doi: 10.1016/j.pharep.2014.06.007 - DOI - PubMed
    1. Balestrini S., Arzimanoglou A., Blümcke I., Scheffer I. E., Wiebe S., Zelano J., et al. . (2021). The Aetiologies of Epilepsy. Epileptic Disord. Int. Epilepsy J. Videotape 23, 1–16. doi: 10.1684/epd.2021.1255 - DOI - PubMed
    1. Cani P. D., Amar J., Iglesias M. A., Poggi M., Knauf C., Bastelica D., et al. . (2007). Metabolic Endotoxemia Initiates Obesity and Insulin Resistance. Diabetes 56, 1761–1772. doi: 10.2337/db06-1491 - DOI - PubMed
    1. Chang K. H., Lu F. J. H., Chyi T., Hsu Y. W., Chan S. W., Wang E. T. W. (2017). Examining the Stress-Burnout Relationship: The Mediating Role of Negative Thoughts. PeerJ 5, e4181. doi: 10.7717/peerj.4181 - DOI - PMC - PubMed
    1. Chang Y., Woo H. G., Jeong J. H., Kim G. H., Park K. D., Song T. J. (2021). Microbiota Dysbiosis and Functional Outcome in Acute Ischemic Stroke Patients. Sci. Rep. 11, 10977. doi: 10.1038/s41598-021-90463-5 - DOI - PMC - PubMed

Publication types