. 2022 Mar 3;8(1):veac016.
doi: 10.1093/ve/veac016. eCollection 2022.

Quantifying rates of HIV-1 flow between risk groups and geographic locations in Kenya: A country-wide phylogenetic study

Affiliations

Quantifying rates of HIV-1 flow between risk groups and geographic locations in Kenya: A country-wide phylogenetic study

George M Nduva et al. Virus Evol. .

Abstract

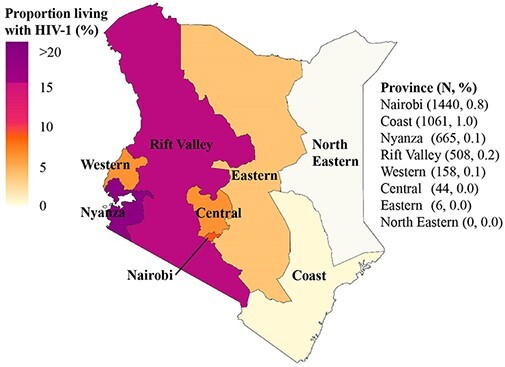
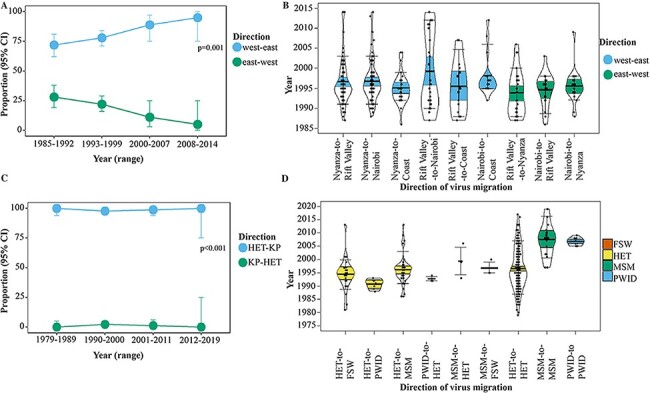
In Kenya, HIV-1 key populations including men having sex with men (MSM), people who inject drugs (PWID) and female sex workers (FSW) are thought to significantly contribute to HIV-1 transmission in the wider, mostly heterosexual (HET) HIV-1 transmission network. However, clear data on HIV-1 transmission dynamics within and between these groups are limited. We aimed to empirically quantify rates of HIV-1 flow between key populations and the HET population, as well as between different geographic regions to determine HIV-1 'hotspots' and their contribution to HIV-1 transmission in Kenya. We used maximum-likelihood phylogenetic and Bayesian inference to analyse 4058 HIV-1 pol sequences (representing 0.3 per cent of the epidemic in Kenya) sampled 1986-2019 from individuals of different risk groups and regions in Kenya. We found 89 per cent within-risk group transmission and 11 per cent mixing between risk groups, cyclic HIV-1 exchange between adjoining geographic provinces and strong evidence of HIV-1 dissemination from (i) West-to-East (i.e. higher-to-lower HIV-1 prevalence regions), and (ii) heterosexual-to-key populations. Low HIV-1 prevalence regions and key populations are sinks rather than major sources of HIV-1 transmission in Kenya. Targeting key populations in Kenya needs to occur concurrently with strengthening interventions in the general epidemic.

Keywords: HIV-1; key populations; molecular epidemiology; transmission.


Figures

Figure 1.
Figure 1.
Map of Kenya highlighting geographic locations and sampling density. Map of Kenya highlighting geographic locations (former administrative provinces), HIV-1 burden per province (proportion of people with HIV-1 as per province in Kenya (Kenya National AIDS Control Council (NACC) 2018; Kenya National Bureau of Statistics 2019; National AIDS and STI Control Programme (NASCOP) 2019, 2020), and the sampling density (number of people with HIV-1 included in the study based on the estimated number of people with HIV-1 in Kenya).
Figure 2.
Figure 2.
Population dynamics of HIV-1 sub-subtype A1, subtype D and subtype C lineages in Kenya. Bayesian Skygrid plots showing effective population size of the (A) HIV-1 sub-subtype A1, (B) HIV-1 subtype C and (C) HIV-1 subtype D lineages in the Kenyan dataset. Median estimates of the effective population size overtime are shown as a continuous line in each plot (coloured Red for sub-subtype A1, Brown for subtype C, and Blue for subtype D). The shaded area represents the 95 per cent higher posterior density intervals of the inferred effective population size for each lineage.
Figure 3.
Figure 3.
HIV-1 risk group-specific estimates in the effective population size through time in Kenya. Bayesian Skygrid plots showing historical population dynamics of (A) the main HIV-1 sub-subtype A1 HET clusters, (B) the only large subtype C HET cluster, (C) the only large HIV-1 sub-subtype A1 PWID cluster and (D) the only large HIV-1 sub-subtype A1 MSM cluster in Kenya. Median estimates of the number of individuals contributing to new infections over time are shown as a continuous line coloured as per the dominant risk group per cluster (bluish-green: MSM; sky blue: PWID; and yellow: HET). The area shaded grey represents the 95 per cent higher posterior density intervals of the inferred effective population size. Information on geographic representation per cluster is provided in the figure legends.
Figure 4.
Figure 4.
Date of origin, evolutionary rate, and growth rate among sub-subtype A1 and subtype C clusters of different risk groups. Time to the most recent common ancestor (A), evolutionary rate (B), and growth rate (C) estimates among seventeen sub-subtype A1 and one subtype C clusters. Median estimates and 95 per cent higher posterior density interval are shown for the different categories per cluster, coloured by the dominant risk group per cluster. Results are not shown for two clusters (A1.5.HET and A1.18.HET) whose parameters did not converge.
Figure 5.
Figure 5.
Proportion and dates of HIV-1 transitions between geographic provinces and risk groups. Dates of HIV-1 transitions between geographic provinces and risk groups summarised from trait-annotated maximum clade credibility trees. Plots represent (A) proportion of West-to-East vs East-to-West geographic migration over time, (B) dates of HIV-1 dissemination between different geographic locations (where group median and interquartile range are coloured by the direction of transmission—coloured sky blue: West-to-East, and vermillion: East-to-West), (C) proportion of HIV-1 transmission from heterosexuals to key populations and vice-versa over time, and (D) dates of HIV-1 transmission within and between different risk groups (where group median and interquartile range are coloured by ‘source’ risk group—coloured green: MSM; sky blue: PWID; vermillion: FSW; yellow: HET). Only transitions with a posterior probability higher than 0.90 are plotted. Dots in the pirate plots represent HIV-1 migration events.

Similar articles

Cited by

References

    1. Abeler-Dörner L. et al. (2019) ‘PANGEA-HIV 2: Phylogenetics and Networks for Generalised Epidemics in Africa’, Current Opinion in HIV and AIDS, 14: 173. - PMC - PubMed
    1. Anderson S.-J. et al. (2014) ‘Maximising the Effect of Combination HIV Prevention through Prioritisation of the People and Places in Greatest Need: A Modelling Study’, The Lancet, 384: 249–56. - PubMed
    1. Baele G. et al. (2012) ‘Improving the Accuracy of Demographic and Molecular Clock Model Comparison while Accommodating Phylogenetic Uncertainty’, Molecular Biology and Evolution, 29: 2157–67. - PMC - PubMed
    1. Bailey R. C. et al. (2007) ‘Male Circumcision for HIV Prevention in Young Men in Kisumu, Kenya: A Randomised Controlled Trial’, The Lancet, 369: 643–56. - PubMed
    1. Bbosa N. et al. (2019) ‘Phylogeography of HIV-1 Suggests that Ugandan Fishing Communities are a Sink For, Not a Source Of, Virus from General Populations’, Scientific Reports, 9: 1–8. - PMC - PubMed