. 2022 Feb 28:28:58-76.
doi: 10.1016/j.omtn.2022.02.019. eCollection 2022 Jun 14.

VEGFA-targeting miR-agshRNAs combine efficacy with specificity and safety for retinal gene therapy

Affiliations

VEGFA-targeting miR-agshRNAs combine efficacy with specificity and safety for retinal gene therapy

Sidsel Alsing et al. Mol Ther Nucleic Acids. .

Abstract

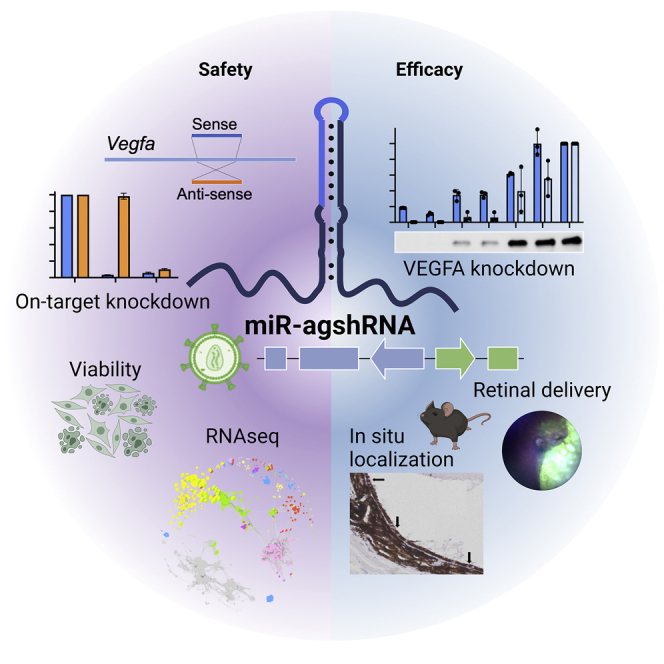
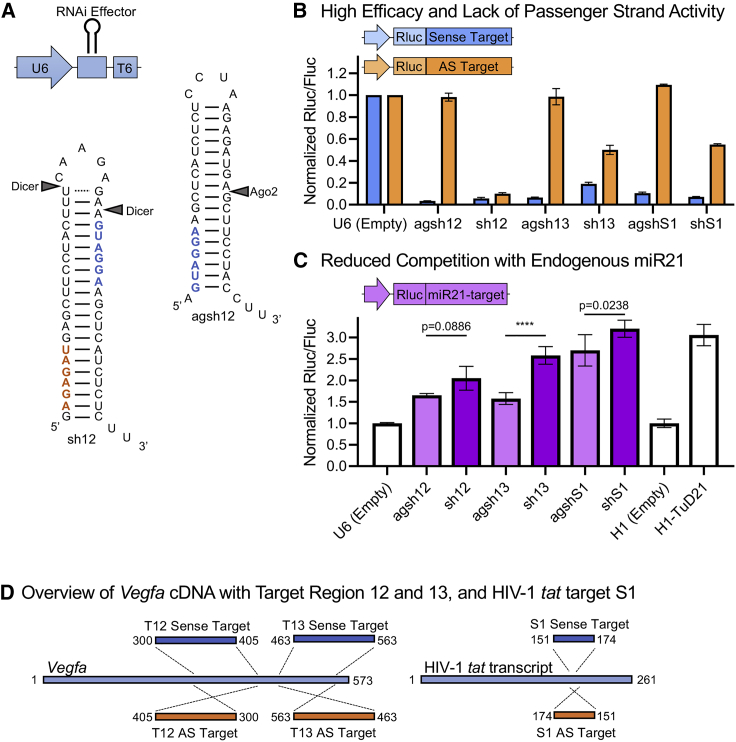
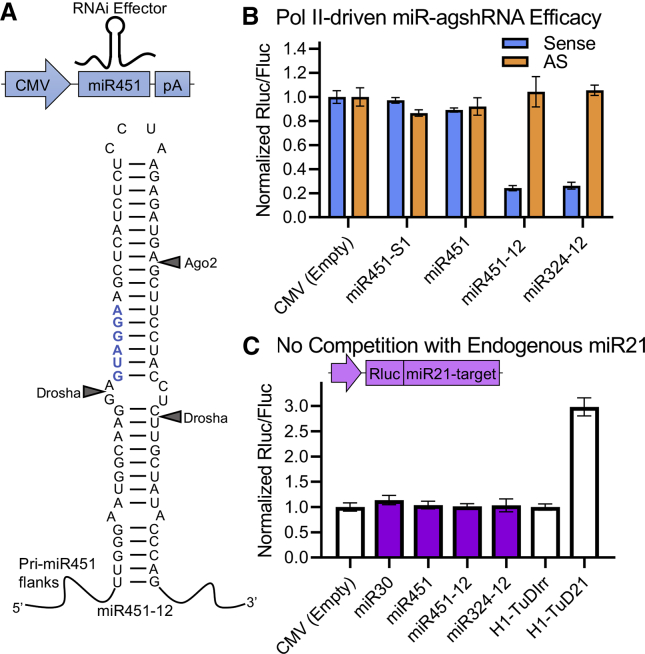
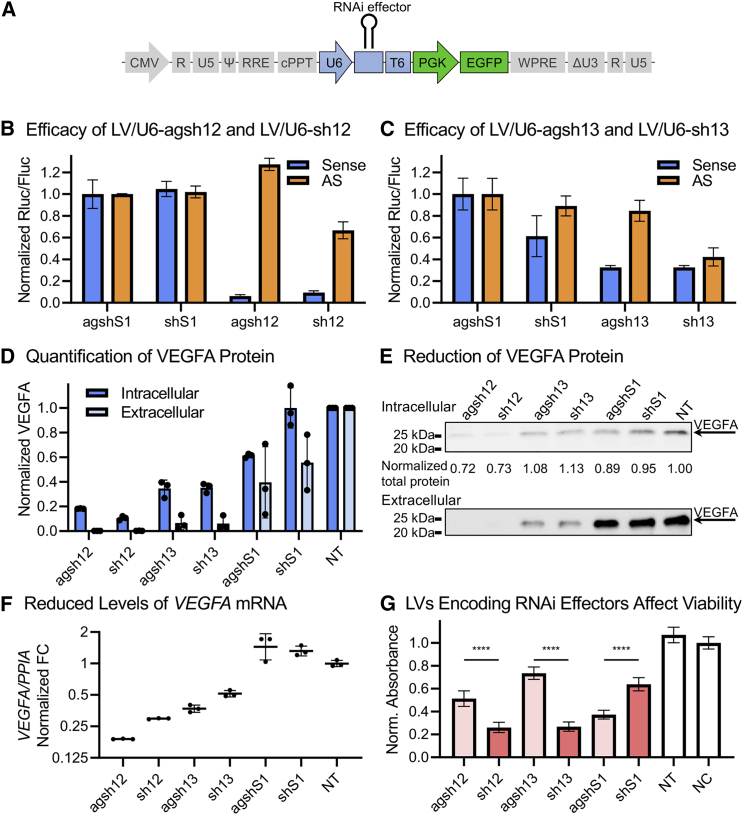
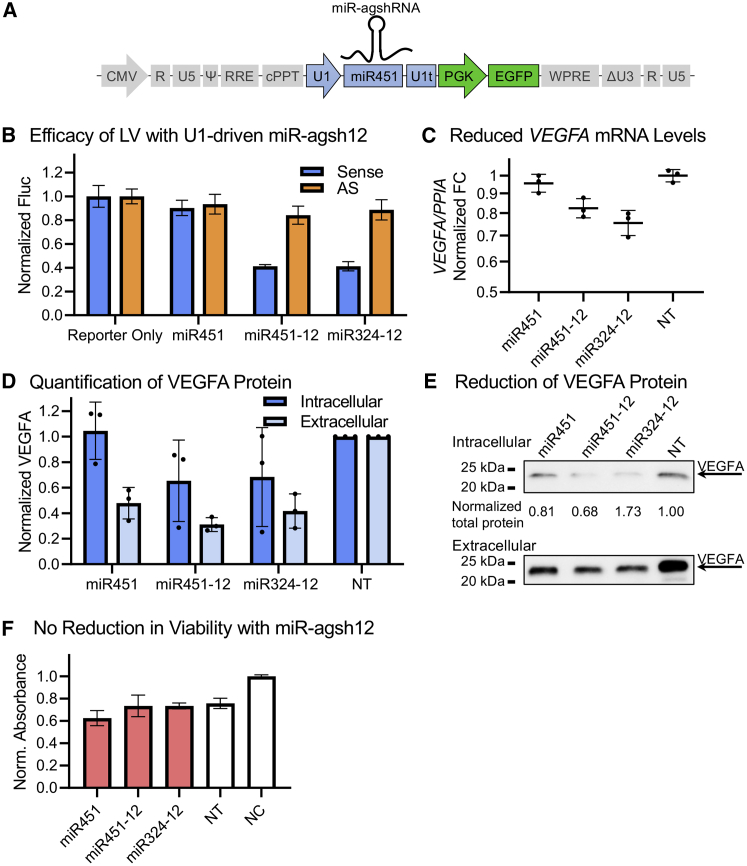
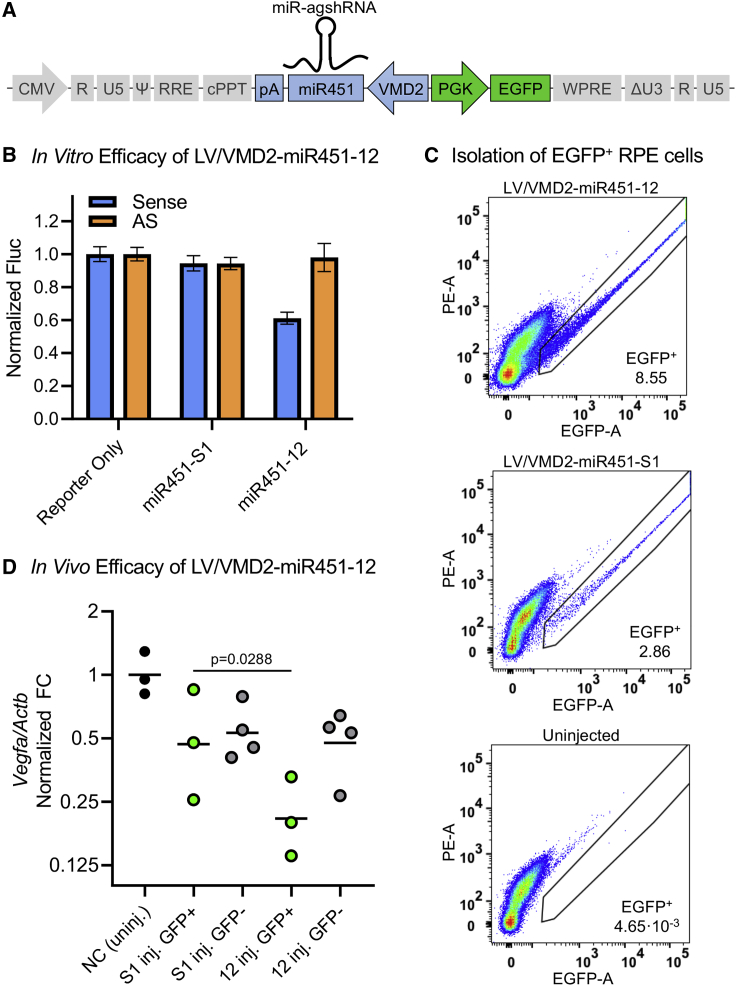
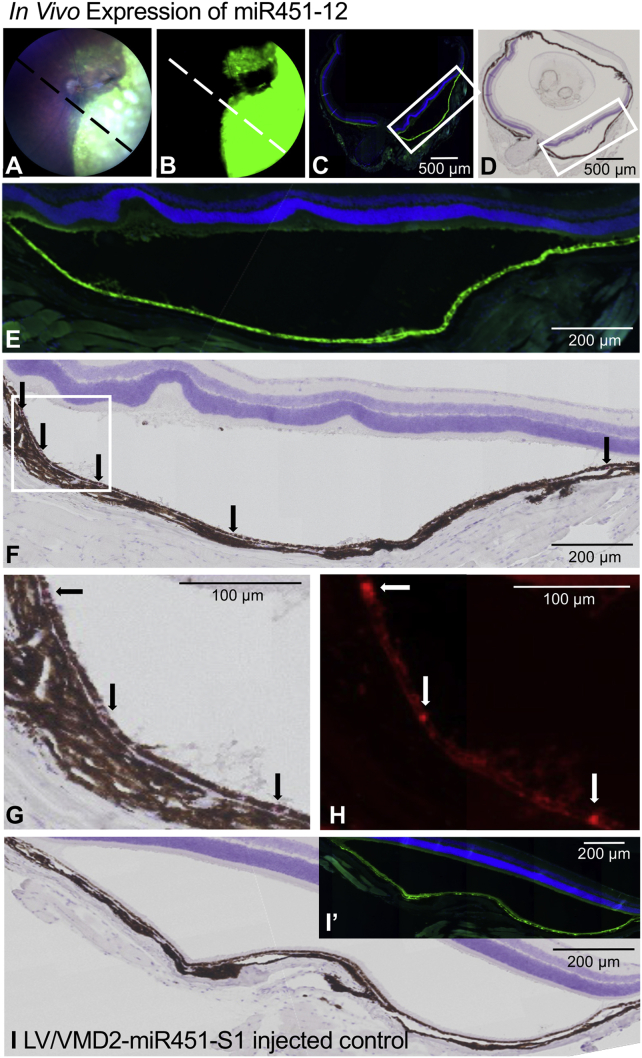
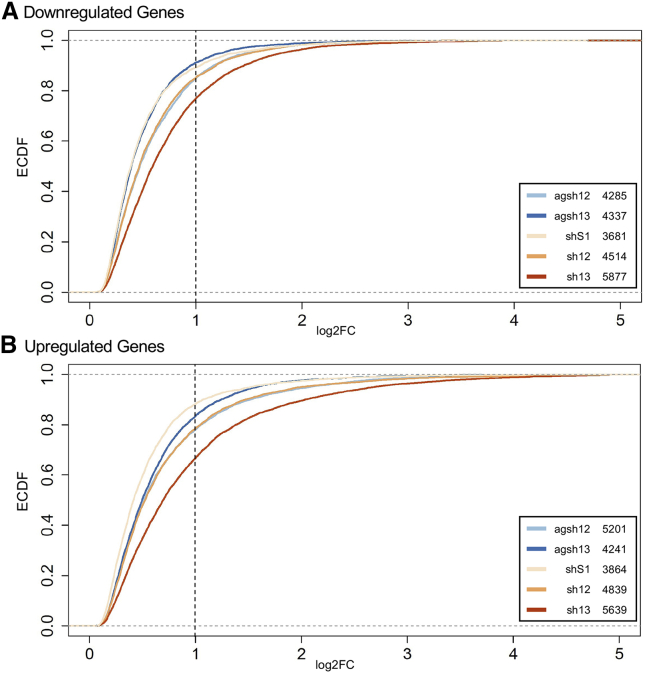
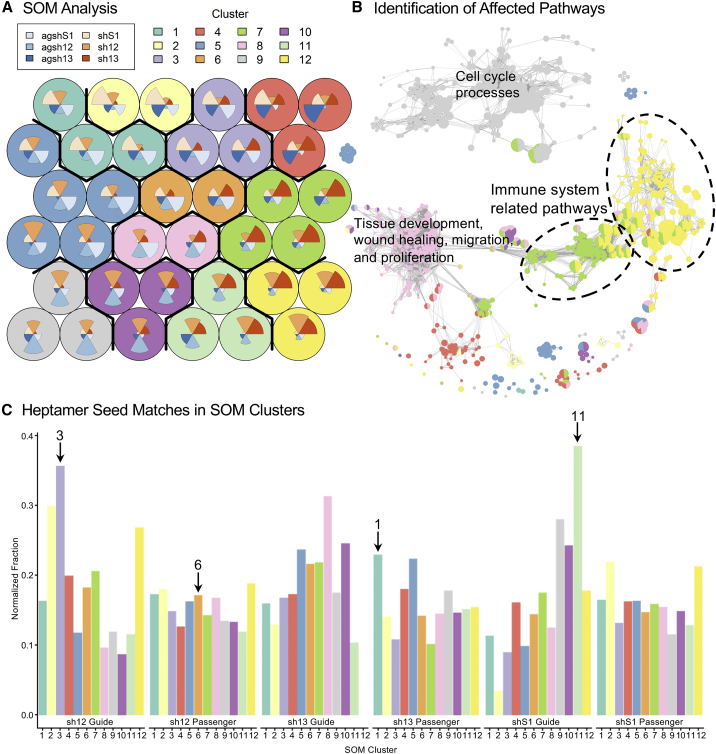
Retinal gene therapy using RNA interference (RNAi) to silence targeted genes requires both efficacy and safety. Short hairpin RNAs (shRNAs) are useful for RNAi, but high expression levels and activity from the co-delivered passenger strand may cause undesirable cellular responses. Ago2-dependent shRNAs (agshRNAs) produce no passenger strand activity. To enhance efficacy and to investigate improvements in safety, we have generated VEGFA-targeting agshRNAs and microRNA (miRNA)-embedded agshRNAs (miR-agshRNAs) and inserted these RNAi effectors in Pol II/III-driven expression cassettes and lentiviral vectors (LVs). Compared with corresponding shRNAs, agshRNAs and miR-agshRNAs increased specificity and safety, while retaining a high knockdown efficacy and abolishing passenger strand activity. The agshRNAs also caused significantly smaller reductions in cell viability and reduced competition with the processing of endogenous miR21 compared with their shRNA counterparts. RNA sequencing (RNA-seq) analysis of LV-transduced ARPE19 cells revealed that expression of shRNAs in general leads to more changes in gene expression levels compared with their agshRNA counterparts and activation of immune-related pathways. In mice, subretinal delivery of LVs encoding tissue-specific miR-agshRNAs resulted in retinal pigment epithelium (RPE)-restricted expression and significant knockdown of Vegfa in transduced RPE cells. Collectively, our data suggest that agshRNAs and miR-agshRNA possess important advantages over shRNAs, thereby posing a clinically relevant approach with respect to efficacy, specificity, and safety.

Keywords: Dicer-independent shRNAs; Non-coding RNAs; Pol II-driven miRNA scaffold; RNA interference; VEGF; agoshRNA; agshRNA; in vivo efficacy; off-target effects; retinal gene therapy.


Conflict of interest statement

The authors declare no competing interests.

Figures

None
Graphical abstract
Figure 1
Figure 1
agshRNAs provide efficacy, lack of passenger strand activity, and reduced competition with an endogenous miRNA compared with classical shRNAs (A) The U6-driven RNAi effector expression cassette. Sequence and predicted secondary structure of the agsh12 and the classical sh12 with expected Ago2 and Dicer cleavage sites. The predicted guide strand seed sequence (blue) and the predicted passenger strand seed sequence (orange) are shown in bold. The 13 and S1 agshRNA-shRNA pairs are shown in Figure S1. (B) Knockdown efficacy of the U6-driven RNAi effectors in HEK293 cells measured using co-transfected dedicated dual luciferase reporters with the Renilla luciferase (Rluc) fused to a Vegfa or S1 target sequence in the sense or the AS direction (see also Figure 1D) and the firefly luciferase (Fluc) serving as an internal control for normalization. Data for each individual experiment are presented in Figures S2A–S2C. (C) The competition of the U6-driven RNAi effectors with the endogenous miR21 was investigated in HEK293 cells using a co-transfected dual luciferase reporter with a perfect miR21 target sequence. An increase in the expression of the miR21-sensitive reporter may be interpreted as reduced functional miR21 levels caused by RNAi effector-mediated competition. The H1-driven miR21-specific tough decoy (TuD21), which has previously been shown to efficiently reduce miR21-mediated silencing, was included as a positive control, along with an empty control vector for normalization of this control. (D) Left: schematics of the Vegfa mRNA and the position of target region 12 and 13, which were fused to the Rluc of the psiCHECK dual luciferase reporters in the sense or the AS direction to create the dedicated luciferase reporters psiCHECK2-mVEGF-T12-Sense/AS or psiCHECK2-mVEGF-T13-Sense/AS. Right: schematics of the HIV-1 tat transcript with the S1 target sequence that was fused to the psiCHECK reporter in the sense or the AS direction to create psiCHECK2-S1-Sense/AS. The psiCHECK reporters also encoded Fluc. Rluc/Fluc ratio is the mean of triplicates ± SD normalized to a control. (C) A one-way ANOVA was performed followed by Šídák's multiple comparisons test between each of the agshRNAs and their corresponding shRNAs. The multiplicity-adjusted p values are reported. ∗∗∗∗p <0.0001.
Figure 2
Figure 2
Pol II-driven miR-agshRNAs produce potent knockdown and cause no competition with endogenous miR21 (A) The CMV-driven miR-agshRNA expression cassette. Sequence and predicted secondary structure of the miR451-12 with expected Ago2 and Drosha cleavage sites. The pri-miR451 scaffold includes ∼100 nt on both sides of the hairpin. The miR451-S1, miR324-12, and the endogenous miR451 are shown in Figure S1. (B) The knockdown efficacy of the CMV-driven RNAi effectors was investigated using a co-transfected dedicated dual luciferase Vegfa reporter in HEK293 cells. (C) The effect of the expression of the CMV-driven RNAi effectors on the knockdown efficacy of the endogenous miR21 was investigated in HEK293 cells as in Figure 1C. A tough decoy with an irrelevant target miRNA (TuDIrr) was included as a control for normalization. Rluc/Fluc ratio is the mean of triplicates ± SD normalized to a control.
Figure 3
Figure 3
LVs encoding the Pol III-driven RNAi effectors produce potent VEGFA knockdown but also affect viability (A) A schematic vector map of the pCCL-based lentiviral transfer vector encoding the U6-driven RNAi effectors. CMV, cytomegalovirus promoter; cPPT, central polypurine tract; EGFP, enhanced green fluorescent protein; ΔU3, LTR unique 3′ region (U3) with self-inactivating deletion; PGK, phosphoglycerate kinase 1 promoter; Ψ, packaging signal; R, LTR repeat region; RRE, Rev-responsive element; T6, T-rich Pol III termination signal; U5, LTR unique 5′ region; U6, U6 snRNA promoter; WPRE, woodchuck hepatitis virus post-transcriptional regulatory element. (B and C) Knockdown efficacy of LVs encoding the U6-driven 12 and 13 agshRNA-shRNA pairs. HEK293 cells were transduced with the LVs encoding the RNAi effectors and then transfected with dedicated dual luciferase reporters. Rluc/Fluc ratio is the mean of triplicates ± SD normalized to agshS1. (D and E) Western blot-assessed VEGFA levels in 293-hVEGFA cells transduced with the LVs encoding the U6-driven RNAi effectors, quantification, and representative blot. The intracellular VEGFA levels are presented relative to the total protein content, while the extracellular samples are volume normalized. Mean of triplicates ± SD, normalized to NT control. (F) RT-qPCR quantification of the mRNA levels of VEGFA in 293-hVEGFA cells transduced with the LVs encoding the U6-driven RNAi effectors. Geometric mean of the PPIA-normalized VEGFA fold change (FC) with geometric SD relative to NT. (G) MTT-based cell number assessment of ARPE19 cells 5 days post transduction with the LVs encoding the U6-driven RNAi effectors. The background-subtracted absorbance at 570 nm relative to the untreated negative control (NC) is presented. Means of quintuplicates ± SD. The NT and NC are in triplicates. (G) A one-way ANOVA was performed followed by Šídák's multiple comparisons test between each of the agshRNAs and their corresponding shRNAs. The multiplicity-adjusted p values are reported. ∗∗∗∗p <0.0001.
Figure 4
Figure 4
LVs encoding the U1-driven miR-agshRNAs produce knockdown of VEGFA and no reduction in viability (A) A schematic vector map of the pCCL-based lentiviral transfer vector encoding the U1-driven RNAi effectors. U1, U1 snRNA promoter; U1t, U1 terminator box. (B) HEK293 cells were transduced with LVs encoding minimal Vegfa target 12 reporters (see Figure S5A). Then they were transduced with the LVs encoding the U1-driven RNAi effectors, and the Fluc activity was measured after 3 days. Mean Fluc levels (relative light units [RLU]) of triplicates ± SD, normalized to HEK293 cells transduced with the reporter only. See Figure S5B for flow cytometry evaluation. (C) RT-qPCR quantification of the mRNA levels of VEGFA in the 293-hVEGFA cells transduced with the LV encoding the indicated U1-driven RNAi effector. Geometric mean of the PPIA-normalized VEGFA FC relative to the NT control with geometric SD. (D and E) Western blot-assessed VEGFA levels in 293-hVEGFA cells transduced with the LV encoding the U1-driven RNAi effectors, quantification, and representative blot. The intracellular VEGFA levels are presented relative to the total protein content, while the extracellular samples are volume normalized. Mean of triplicates ± SD, normalized to the NT samples. (F) MTT-based cell number assessment of ARPE19 cells 5 days post transduction with the LVs encoding the indicated U1-driven miR451 or miR-agshRNAs. The background-subtracted absorbance at 570 nm relative to the untreated NC is presented. Mean of quintuplicates ± SD. The NT and NC are in triplicates.
Figure 5
Figure 5
In Vivo knockdown of Vegfa by LVs encoding the VMD2-driven miR451-12 (A) A schematic vector map of the pCCL-based lentiviral transfer vector encoding the VMD2-driven RNAi effectors inserted back to back with the PGK-EGFP expression cassette. pA, bovine growth hormone polyadenylation signal; VMD2, vitelliform macular dystrophy-2 promoter. (B) Melanoma cells were transduced with LVs encoding minimal Vegfa target 12 reporters (see Figure S5A). Then they were transduced with the ultracentrifuged LVs encoding the VMD2-driven RNAi effectors, and the Fluc activity was measured after 3 days. Mean Fluc levels (RLU) of triplicates ± SD, normalized to melanoma cells transduced with the reporter only. See Figure S5C for flow cytometry evaluation. (C) The RPE cells of mice injected with the LV/VMD2-miR451-12 or LV/VMD2-miR451-S1 were harvested at day 14 p.i. Prior to FACS, RPE cells from three injected or two contralateral uninjected eyes were pooled. The two upper panels show pools of RPE cells from three eyes injected with the LV/VMD2-miR451-S1 or LV/VMD2-miR451-12, respectively. The lower panel shows a pool of RPE cells from two uninjected eyes. The EGFP+ cells were identified based on fluorescence measured in the EGFP detector (530/30 nm, x axis) and proportional fluorescence measured in the neighboring PE detector (585/42 nm, y axis). An equal level of fluorescence in the EGFP and PE detectors placing the cells in the diagonal of the plots was interpreted as autofluorescence, and these cells were excluded. The percentages of EGFP+ RPE cells in each pool are indicated. The full gating strategy is shown in Figure S7. (D) Twelve mice were injected in each group, producing four pools, but only three pools in each group yielded sufficient EGFP+ cells for purification of RNA. RNA was purified from the sorted pools, and Vegfa mRNA was quantified using RT-qPCR. Actb-normalized Vegfa FC relative to uninjected control eyes with the geometric mean indicated. Each data point represents a pool of FACS-sorted RPE cells. (D) The data was log transformaed and a one-way ANOVA was performed followed by the uncorrected Fisher's least significant difference (LSD) test between the LV/VMD2-miR451-S1 EGFP+ group and the LV/VMD2-miR451-12 EGFP+ group.
Figure 6
Figure 6
RPE-specific expression of the VMD2-driven miR451-12 in vivo (A and B) Brightfield fundoscopy and EGFP detection of the LV/VMD2-miR451-12-injected eye, which was used for the in situ detection of miR451-12 57 days p.i. The expected position of the cross section used in the analysis is indicated with the dashed line. Fifty-seven days p.i. (C) Formalin-fixed and paraffin-embedded cross section of the LV/VMD2-miR451-12-injected eye, harvested at day 57 p.i. EGFP signal and DAPI staining. (D) Cross section adjacent to the section in (C), which was used for chromogenic in situ detection of the miR451-12 with the miRNAscope probe detecting the agsh12 guide strand. Brightfield image with hematoxylin counterstain. (E) Magnification of the EGFP-positive section indicated in (C). (F) Magnification of the section indicated in (D). The arrows show the location of the red chromogenic signal indicating the detection of miR451-12. (G and H) Magnification of the section indicated in (F) with detection of the chromogenic or fluorescent signal of the miR451-12 probe. (I) Formalin-fixed and paraffin-embedded cross section of the LV/VMD2-miR451-S1-injected eye (NC), harvested at 57 days p.i., treated with the miRNAscope probe detecting the agsh12 guide strand. Brightfield image with hematoxylin counterstain. (I′) EGFP signal in the LV/VMD2-miR451-S1-injected eye, in the section adjacent to the one shown in (I). See also Figure S8.
Figure 7
Figure 7
Changes in gene expression caused by LVs encoding the U6-driven RNAi effectors (A) Log2 fold change (log2FC) distribution for the genes that were downregulated in the ARPE19 cells transduced with the LVs encoding the U6-driven RNAi effectors, compared with the cells transduced with the LV/U6-agshS1. The inset shows the number of downregulated genes compared with the cells transduced with the LV/U6-agshS1. (B) As in (A), but with upregulated genes. EDCF, empirical cumulative distribution function.
Figure 8
Figure 8
LVs encoding the U6-driven RNAi effectors produce a wide range of sequence-dependent and sequence-independent effects (A) Self-organizing map (SOM) analysis of the 3,000 most differentially expressed genes among differentially expressed genes in pairwise comparisons in the ARPE19 cells transduced with the LVs encoding the U6-driven RNAi effectors. Genes with similar expression profiles are grouped in the circular nodes. Nodes with similar profiles are organized in clusters. The polar area charts inside the nodes represent the expression profile of the genes in the node across the different samples. (B) Enrichment plot showing the enriched gene ontology biological processes (GO-BP) terms in the clusters from the SOM analysis. Captions for enriched pathways in selected clusters are shown (see Table S1). (C) Genes that contain heptamer seed site matches (HSMs, matching nt 2–8 of the RNAi effector strand) in their 3′UTR were identified for each predicted guide and passenger strand. The fraction of genes containing HSMs relative to both the number of genes in the SOM cluster and the total number of HSMs in the expressed genes was calculated for each SOM cluster and strand (normalized fraction). Arrows designate bars mentioned in the text.

References

    1. Fire A., Xu S., Montgomery M.K., Kostas S.A., Driver S.E., Mello C.C. Potent and specific genetic interference by double-stranded RNA in Caenorhabditis elegans. Nature. 1998;391:806–811. doi: 10.1038/35888. - DOI - PubMed
    1. Elbashir S.M., Harborth J., Lendeckel W., Yalcin A., Weber K., Tuschl T. Duplexes of 21-nucleotide RNAs mediate RNA interference in cultured mammalian cells. Nature. 2001;411:494–498. doi: 10.1038/35078107. - DOI - PubMed
    1. Bajan S., Hutvagner G. RNA-based therapeutics: from antisense oligonucleotides to miRNAs. Cells. 2020;9 doi: 10.3390/cells9010137. - DOI - PMC - PubMed
    1. Liu Y.P., Schopman N.C., Berkhout B. Dicer-independent processing of short hairpin RNAs. Nucleic Acids Res. 2013;41:3723–3733. doi: 10.1093/nar/gkt036. - DOI - PMC - PubMed
    1. Herrera-Carrillo E., Berkhout B. Dicer-independent processing of small RNA duplexes: mechanistic insights and applications. Nucleic Acids Res. 2017;45:10369–10379. doi: 10.1093/nar/gkx779. - DOI - PMC - PubMed

LinkOut - more resources