. 2022 Apr 19;204(4):e0003122.
doi: 10.1128/jb.00031-22. Epub 2022 Mar 31.

A Role for the RNA Polymerase Gene Specificity Factor σ54 in the Uniform Colony Growth of Uropathogenic Escherichia coli

Affiliations

A Role for the RNA Polymerase Gene Specificity Factor σ54 in the Uniform Colony Growth of Uropathogenic Escherichia coli

Amy Switzer et al. J Bacteriol. .

Abstract

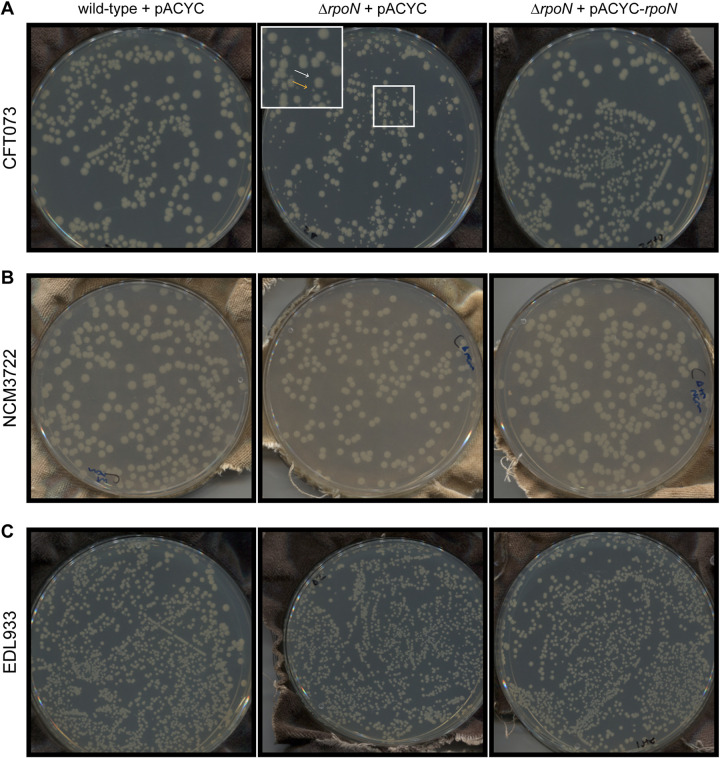
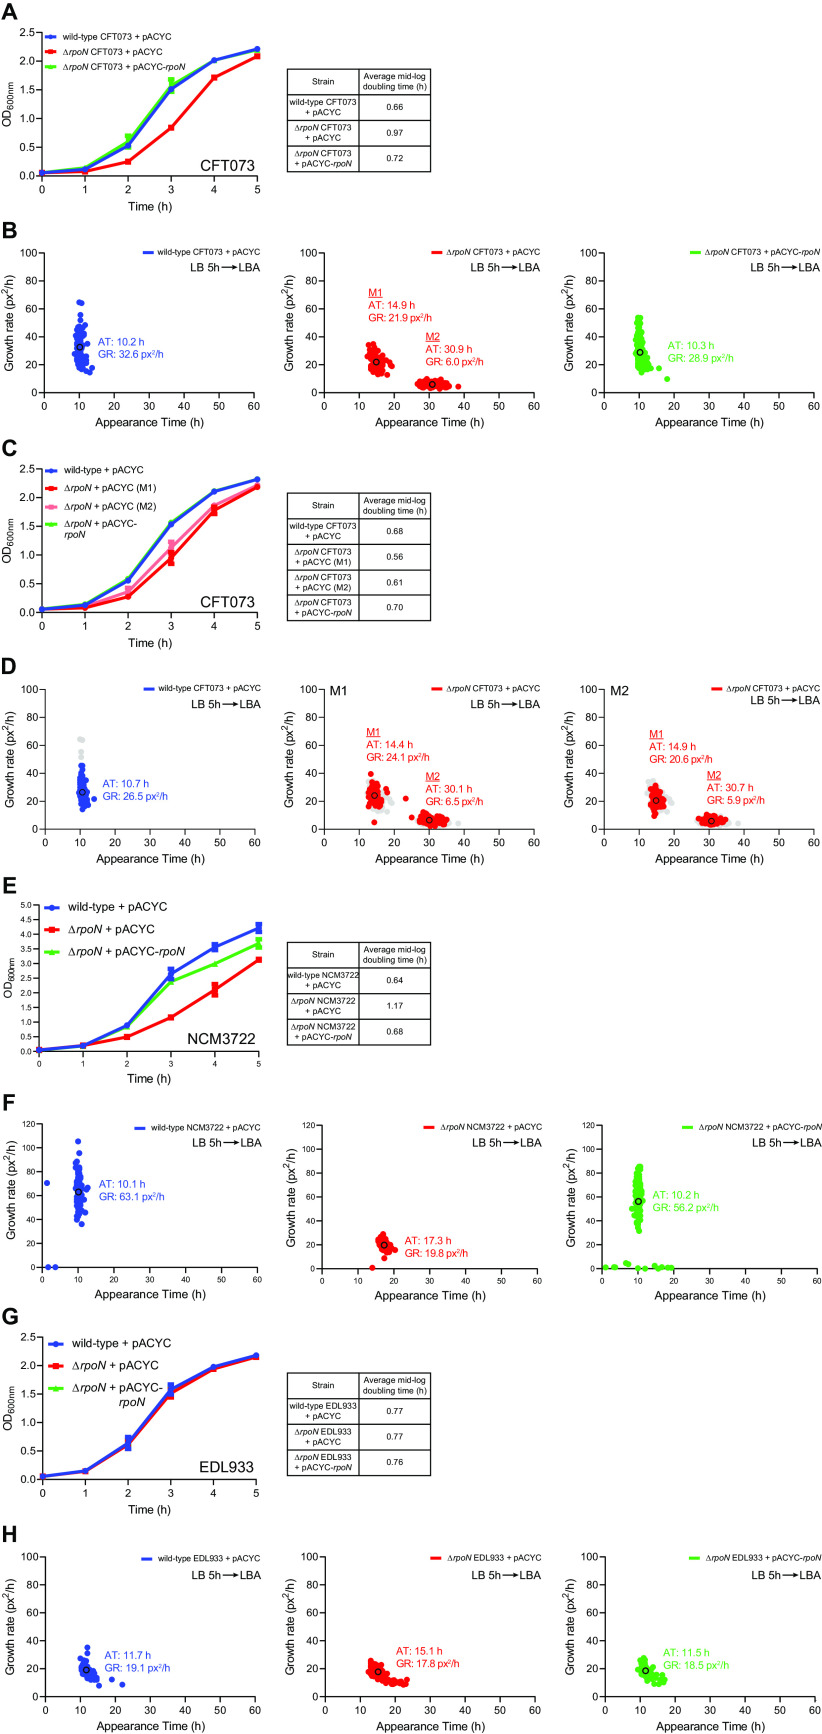
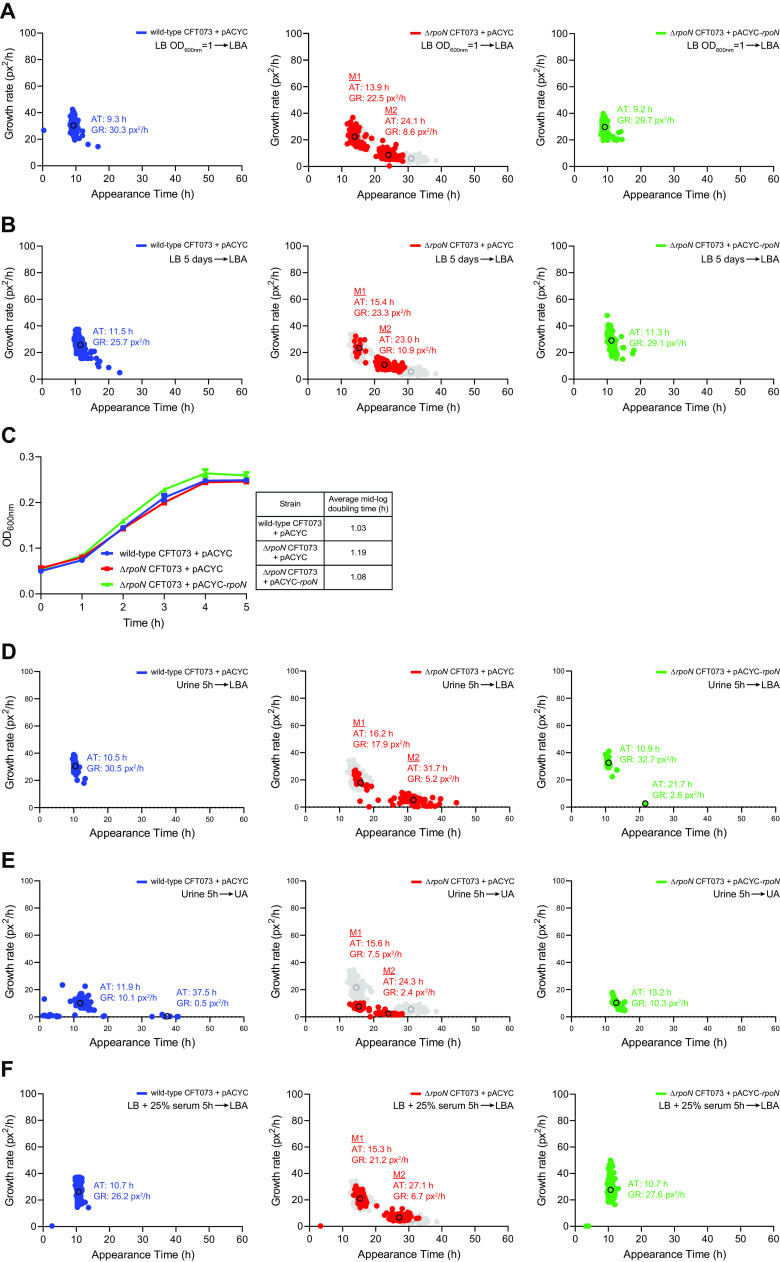
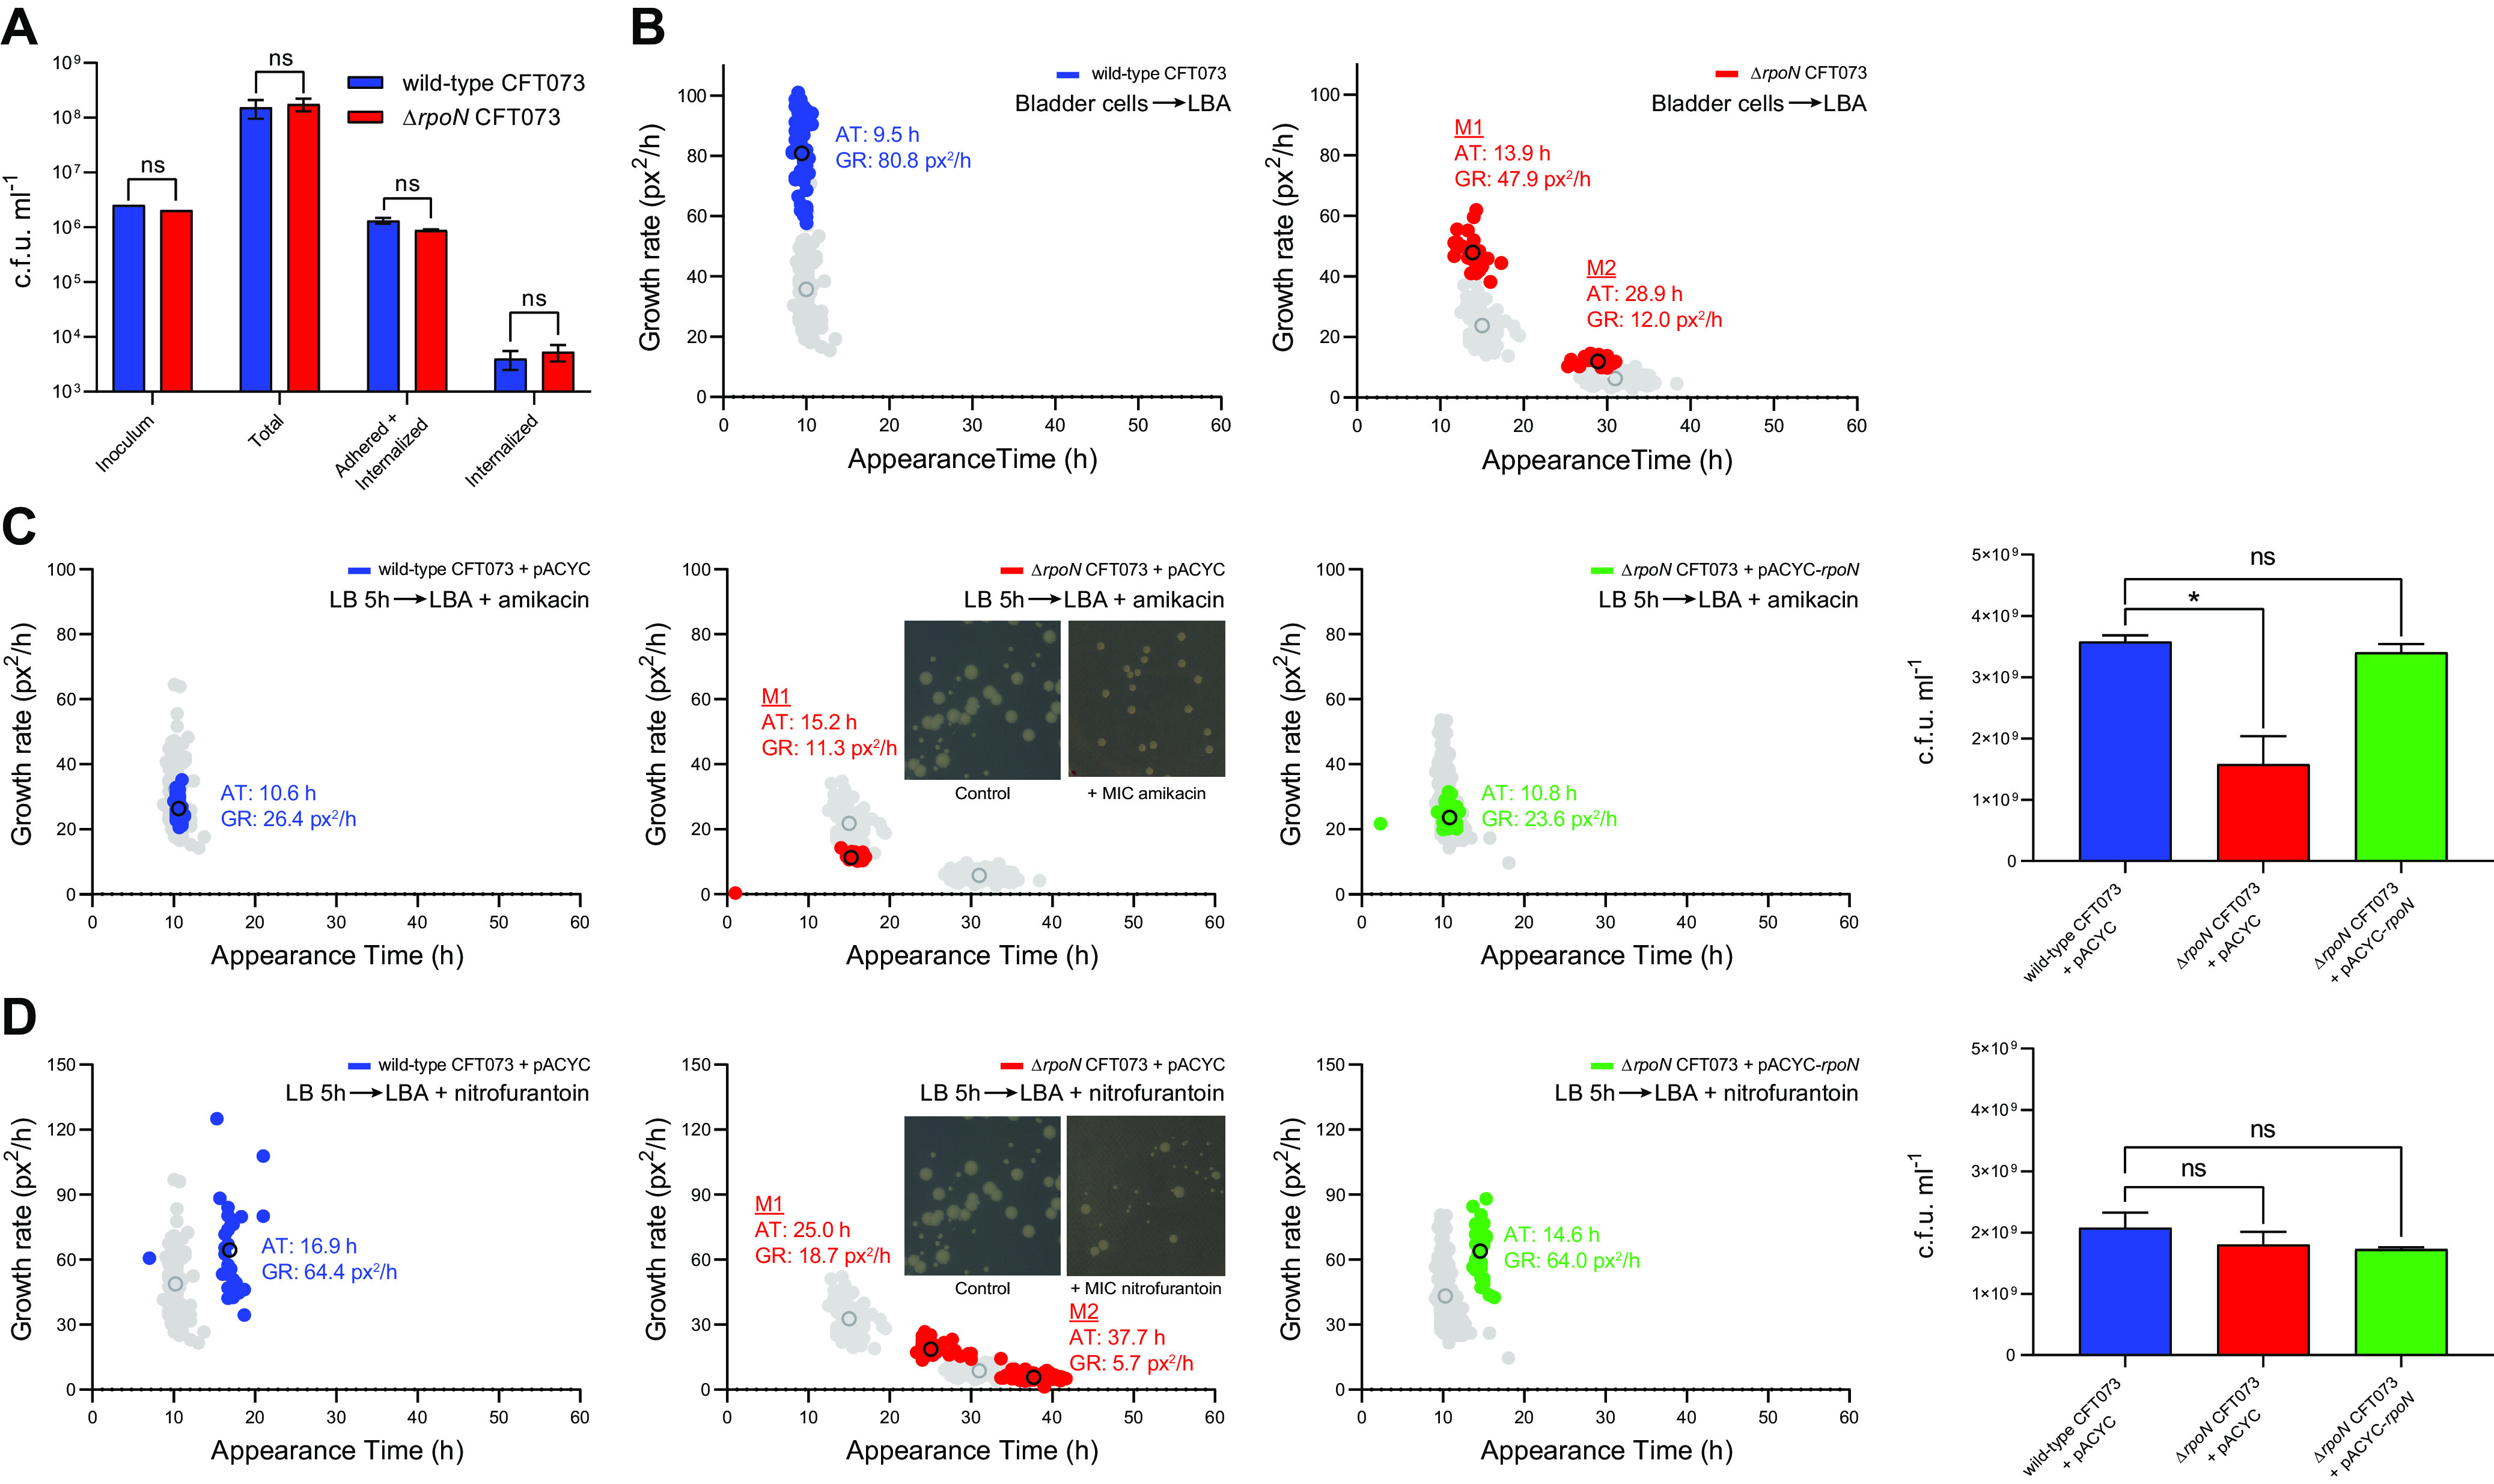
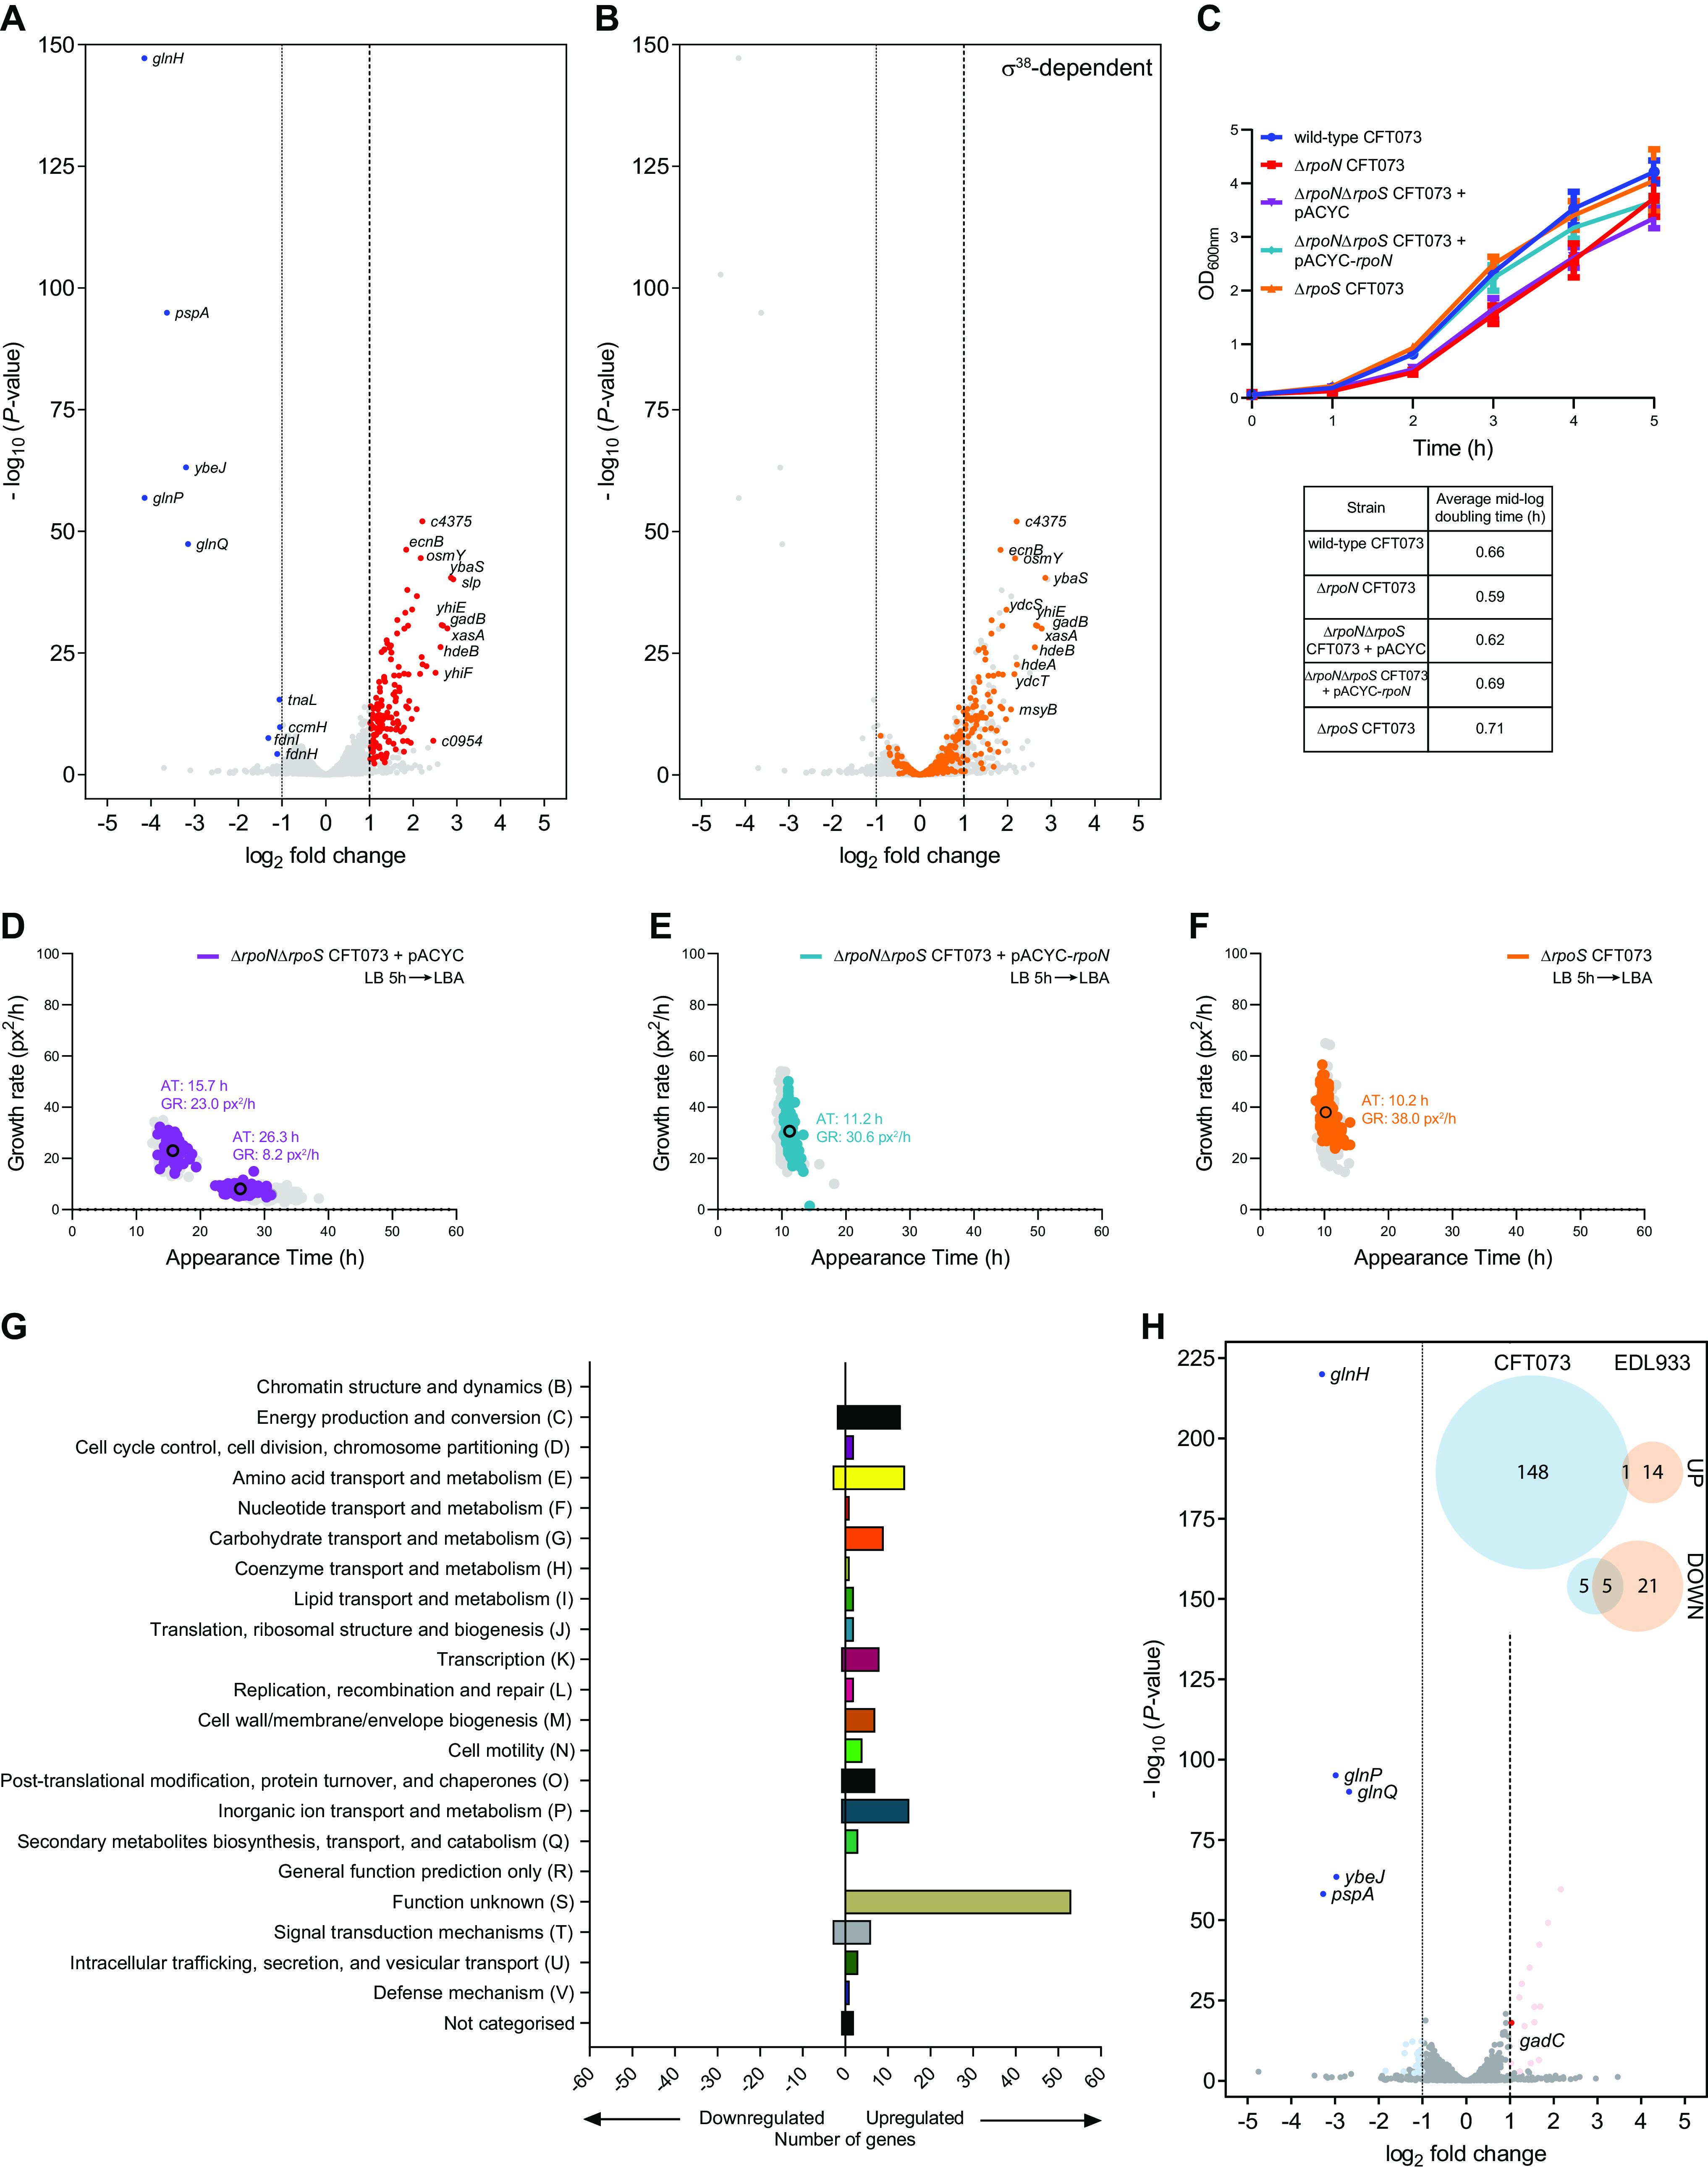
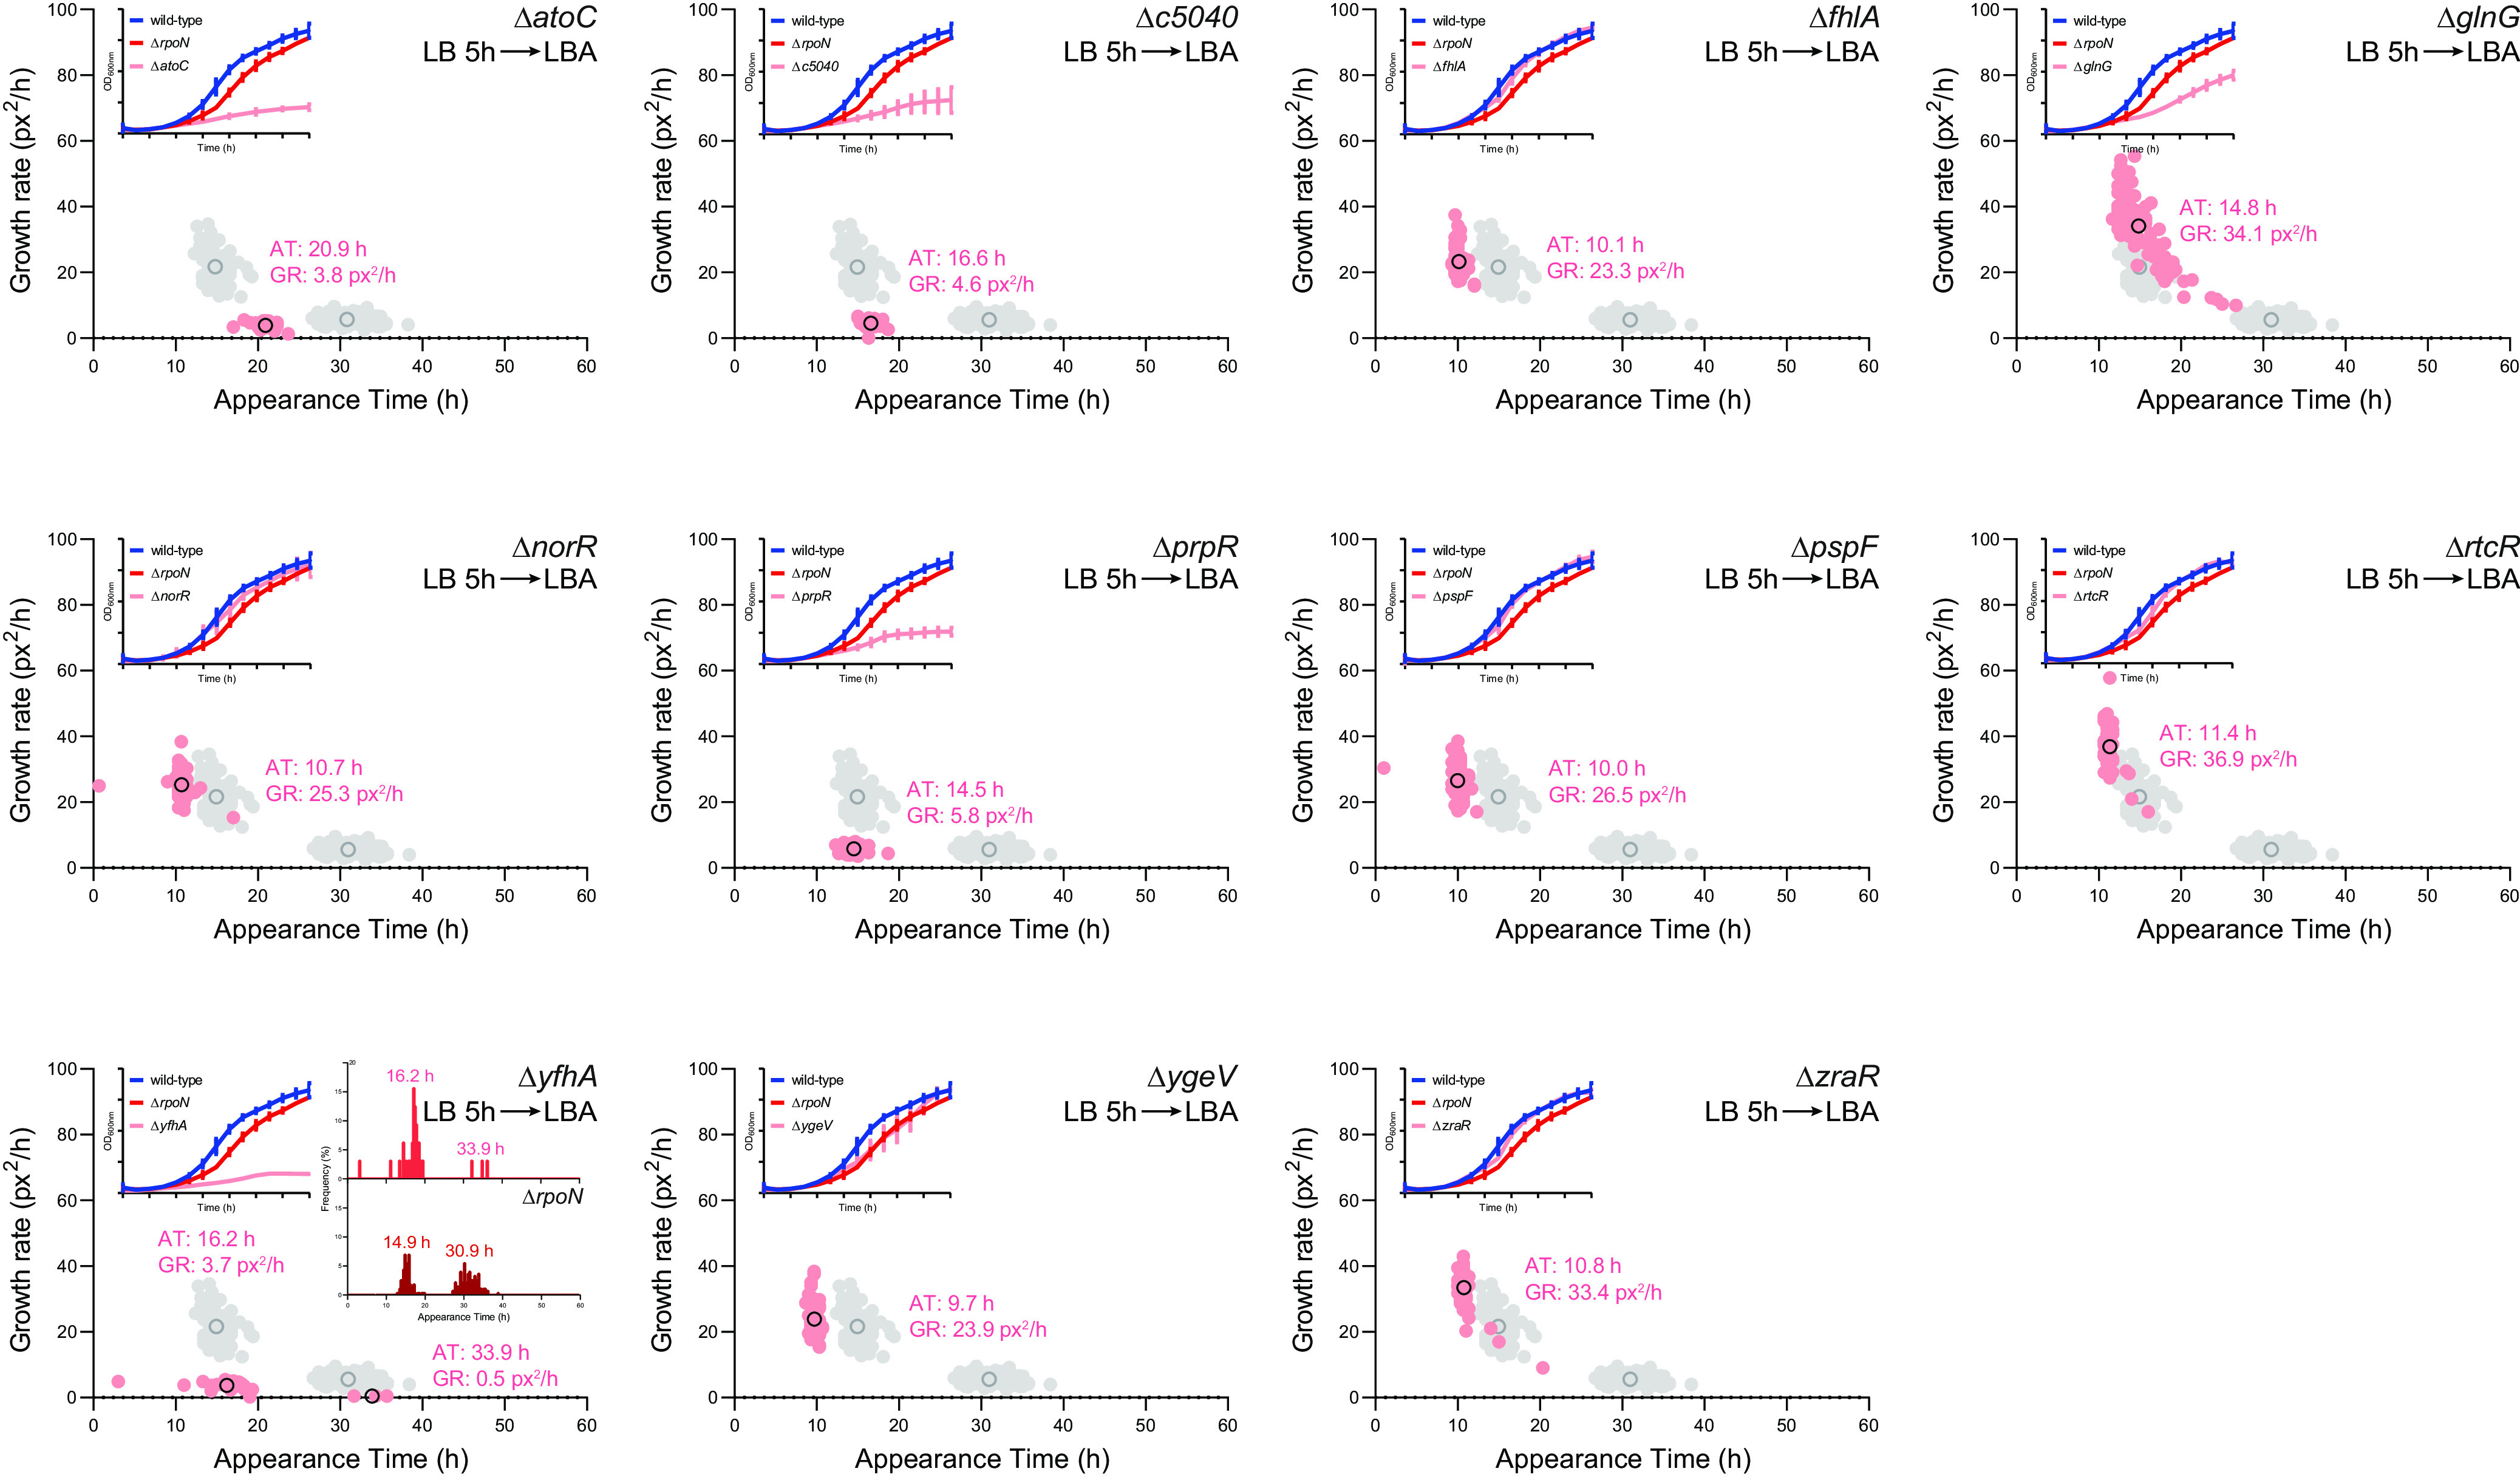
The canonical function of a bacterial sigma (σ) factor is to determine the gene specificity of the RNA polymerase (RNAP). In several diverse bacterial species, the σ54 factor uniquely confers distinct functional and regulatory properties on the RNAP. A hallmark feature of the σ54-RNAP is the obligatory requirement for an activator ATPase to allow transcription initiation. Different activator ATPases couple diverse environmental cues to the σ54-RNAP to mediate adaptive changes in gene expression. Hence, the genes that rely upon σ54 for their transcription have a wide range of different functions suggesting that the repertoire of functions performed by genes, directly or indirectly affected by σ54, is not yet exhaustive. By comparing the growth patterns of prototypical enteropathogenic, uropathogenic, and nonpathogenic Escherichia coli strains devoid of σ54, we uncovered that the absence of σ54 results in two differently sized colonies that appear at different times specifically in the uropathogenic E. coli (UPEC) strain. Notably, UPEC bacteria devoid of individual activator ATPases of the σ54-RNAP do not phenocopy the σ54 mutant strain. Thus, it seems that σ54's role as a determinant of uniform colony appearance in UPEC bacteria represents a putative non-canonical function of σ54 in regulating genetic information flow. IMPORTANCE RNA synthesis is the first step of gene expression. The multisubunit RNA polymerase (RNAP) is the central enzyme responsible for RNA synthesis in bacteria. The dissociable sigma (σ) factor subunit directs the RNAP to different sets of genes to allow their expression in response to various cellular needs. Of the seven σ factors in Escherichia coli and related bacteria, σ54 exists in a class of its own. This study has uncovered that σ54 is a determinant of the uniform growth of uropathogenic E. coli on solid media. This finding suggests a role for this σ54 in gene regulation that extends beyond its known function as an RNAP gene specificity factor.

Keywords: Escherichia coli; RNA polymerase; UPEC; microcolonies; sigma 54; sigma factors; transcription.


Conflict of interest statement

The authors declare no conflict of interest.

Figures

FIG 1
FIG 1
The growth properties of strains of E. coli lacking σ54. Images of colonies on LB agar plates incubated at 33°C for 48 h containing wild-type (left), ΔrpoN (middle) or ΔrpoN + rpoN (right) of E. coli strains (A) CFT073, (B) NCM3722, and (C) EDL933. The two differently sized colonies seen on plates containing the ΔrpoN CFT073 strain are indicated with white (big colony) and orange (small colony) arrows in the inset in (A).
FIG 2
FIG 2
The growth properties of different strains of E. coli lacking σ54. (A) The growth curves of wild-type (blue), ΔrpoN (red), and ΔrpoN + rpoN (green) CFT073 strains grown in LB liquid medium for 5 h. (B) Scanlag analysis of colony appearance time (AT; h) and growth rate (GR) in pixels2/h (px2/h) for CFT073 strains grown in LB liquid medium for 5 h of wild-type (left), ΔrpoN (red), and ΔrpoN + rpoN (green) and plated onto LB agar (LBA) plates. Black circles represent average population growth rate and appearance time with mean average values indicated. Liquid to solid growth conditions is indicated in the top right. (C) The growth curves in LB liquid medium from colonies picked from (B) and color-coded as indicated. The average doubling time for each colony type is indicated in table (D) Scanlag analysis as in (B) for bacteria plated from (C). Shown in gray is data from (B) for reference. (E) The growth curves of wild-type (blue), ΔrpoN (red), and ΔrpoN + rpoN (green) NCM3722 strains grown in LB liquid medium for 5 h. (F) Scanlag analysis of colony appearance time as in (B) for NCM3722 strains. (G) The growth curves of wild-type (blue), ΔrpoN (red), and ΔrpoN + rpoN (green) EDL933 strains grown in LB liquid medium for 5 h. (H) Scanlag analysis of colony appearance time as in (B) for EDL933 strains grown in LB liquid medium for 5 h. Where indicated, the error bars represent standard deviation (n = 3).
FIG 3
FIG 3
Heterogeneous colony appearance is an inherent property of ΔrpoN CFT073 bacteria. (A) Scanlag analysis (as in Fig. 2) of CFT073 bacteria grown in LB liquid medium to mid-exponential-phase before plating on LB agar (LBA) plates. Comparison of the M1 and M2 colonies from bacteria grown in LB liquid medium for 5 h before plating (gray). (B) As in (A) but with bacteria grown for 5 days in LB liquid media. (C) Growth curves of wild-type (blue), ΔrpoN (red), and ΔrpoN + rpoN (green) CFT073 strains grown in healthy female urine (HFU) for 5 h. (D) As in (A) but with bacteria from (C). (E) As in (D) but bacteria were plated onto agar plates containing 50% (vol/vol) HFU (UA). (F) As in (A) but bacteria were grown in LB liquid medium with 25% (vol/vol) human serum for 5 h before plating. Where indicated, the error bars represent standard deviation (n = 3).
FIG 4
FIG 4
Consequences of heterogeneous colony growth on virulence and fitness of CFT073 bacteria. (A) The viability of wild-type (blue) and ΔrpoN (red) CFT073 bacteria as measured by CFU of added, total, adhered and internalized, and internalized only bacteria (see the text for details). (B) Scanlag analysis shows colony appearance time (AT; h) and growth rate in pixels2/h (GR; px2/h) for internalized only wild-type (blue, middle) and ΔrpoN (red, right) CFT073 strains plated onto LB agar (LBA) plates. Black circles represent average population growth rate and appearance time with mean average values indicated. Liquid to solid growth conditions are indicated in the top right. Shown in gray for comparison are the colonies from bacteria grown in LB liquid medium for 5 h before plating on LBA. (C) Scanlag analysis of wild-type (blue), ΔrpoN (red), and ΔrpoN + rpoN (green) CFT073 bacteria following growth in LB liquid medium for 5 h followed by plating on LBA plates with MIC of amikacin. Shown in gray for comparison are the colonies from bacteria grown in LB liquid medium for 5 h before plating on LB agar containing no antibiotics. (D) As in (C), but bacteria were plated on LBA plates containing MIC of nitrofurantoin. The inset images show representative colonies for comparison (see the text). In (C) and (D), the bar graphs indicate viability as measured by CFU of wild-type (blue), ΔrpoN (red), and ΔrpoN + rpoN (green) CFT073 bacteria plated on LBA plates with MIC of amikacin or nitrofurantoin, respectively. Statistical significance was calculated using one-way ANOVA with a probability (P) value of <0.05 deemed statistically significant (*, P < 0.05; ns, not significant). Error bars represent standard deviation (n = 3).
FIG 5
FIG 5
Comparative analysis of the transcriptomes of wild-type and ΔrpoN CFT073 strains. (A) Volcano plot showing differentially expressed genes in the ΔrpoN CFT073 strain as a log2 change from the wild-type CFT073 strain extracted from LB liquid medium during mid-exponential growth. Significantly differentially expressed genes (DEGs) were defined as having an absolute log2 change ≥ 1, and a false discovery rate adjusted P < 0.05. Upregulated DEGs are shown in red, downregulated DEGs are shown in blue, and the largest fold changes are labeled with gene names. (B) As in (A) but known σ38-dependent genes are highlighted in orange. Gene names of σ38-dependent genes with the highest fold change are labeled. (C) Growth curves of wild-type (blue), ΔrpoN (red), ΔrpoNΔrpoS (purple), ΔrpoNΔrpoS + rpoN (cyan), and ΔrpoS (orange) CFT073 strains grown in LB liquid medium for 5 h. Error bars represent standard deviation (n = 3). (D to F) Scanlag analysis as in Fig. 2 of (D) ΔrpoNΔrpoS (purple), (E) ΔrpoNΔrpoS + rpoN (cyan), and (F) ΔrpoS (orange) CFT073 strains grown in LB liquid medium for 5 h before plating on LB agar (LBA) plates. Black circles represent the average population growth rate and appearance time with the mean growth rate indicated as a value. Shown in gray for comparison are the M1 and M2 colonies of ΔrpoN CFT073 (in (D)) and wild-type (in (E) and (F)) bacteria grown in LB liquid medium for 5 h before plating. (G) DEGs in the ΔrpoN CFT073 bacteria from (A) were categorized by clustering of orthologous groups (COG) annotation. (H) As in (A) but for DEGs in ΔrpoN EDL933 bacteria as a log2 change from wild-type EDL933 bacteria extracted of ΔrpoN CFT073 (in (D)) and wild-type (in (E) and (F)) LB liquid medium during mid-exponential growth. Upregulated DEGs are shown in pale red and downregulated DEGs shown in pale blue, with DEGs also present in (A) labeled and shown in bright red and bright blue, respectively. The Venn diagrams (inset) show upregulated and downregulated DEG numbers from ΔrpoN CFT073 bacteria (blue) compared to ΔrpoN EDL933 bacteria (orange) with numbers in overlapping circles representing identical genes in both strains.
FIG 6
FIG 6
Activator ATPases do not appear to contribute to σ54’s role as a determinant of uniform colony growth of E. coli CFT073. Scanlag analysis as in Fig. 2 following growth in LB liquid medium for 5 h of known activator ATPase mutants of CFT073 bacteria in order from top left: ΔatoC, Δc5040, ΔfhlA, ΔglnG, ΔnorR, ΔprpR, ΔpspF, ΔrtcR, ΔyfhA, ΔygeV, and ΔzraR. Black circles represent the average population growth rate and appearance time with the mean growth rate indicated as a value. Shown in gray for comparison are the M1 and M2 colonies of ΔrpoN CFT073 bacteria grown in LB liquid medium for 5 h before plating. The inset graphs show growth curves of each activator ATPase mutant strain (pink) grown in LB for 5h with growth curves of wild-type (blue) and ΔrpoN (red) CFT073 strains shown for comparison. Inset histograms for the ΔyfhA CFT073 strain show appearance times of ΔyfhA (top, pink) and ΔrpoN (bottom, red) for comparison (see the text) with average population appearance time written above each peak. Where indicated, the error bars represent standard deviation (n = 3).

Similar articles

References

    1. Paget MS. 2015. Bacterial sigma factors and anti-sigma factors: structure, function and distribution. Biomolecules 5:1245–1265. 10.3390/biom5031245. - DOI - PMC - PubMed
    1. Hirschman J, Wong PK, Sei K, Keener J, Kustu S. 1985. Products of nitrogen regulatory genes ntrA and ntrC of enteric bacteria activate glnA transcription in vitro: evidence that the ntrA product is a sigma factor. Proc Natl Acad Sci USA 82:7525–7529. 10.1073/pnas.82.22.7525. - DOI - PMC - PubMed
    1. Wigneshweraraj S, Bose D, Burrows PC, Joly N, Schumacher J, Rappas M, Pape T, Zhang X, Stockley P, Severinov K, Buck M. 2008. Modus operandi of the bacterial RNA polymerase containing the sigma54 promoter-specificity factor. Mol Microbiol 68:538–546. 10.1111/j.1365-2958.2008.06181.x. - DOI - PubMed
    1. Wigneshweraraj SR, Burrows PC, Bordes P, Schumacher J, Rappas M, Finn RD, Cannon WV, Zhang X, Buck M. 2005. The second paradigm for activation of transcription. Prog Nucleic Acids Res Mol Biol 79:339–369. 10.1016/S0079-6603(04)79007-8. - DOI - PubMed
    1. Reitzer L, Schneider BL. 2001. Metabolic context and possible physiological themes of sigma(54)-dependent genes in Escherichia coli. Microbiol Mol Biol Rev 65:422–444. table of contents. 10.1128/MMBR.65.3.422-444.2001. - DOI - PMC - PubMed

Publication types

MeSH terms

LinkOut - more resources