. 2022 Apr 26;13(2):e0319721.
doi: 10.1128/mbio.03197-21. Epub 2022 Mar 31.

The Mechanism of Pertussis Cough Revealed by the Mouse-Coughing Model

Affiliations

The Mechanism of Pertussis Cough Revealed by the Mouse-Coughing Model

Yukihiro Hiramatsu et al. mBio. .

Erratum in

Retraction in

Abstract

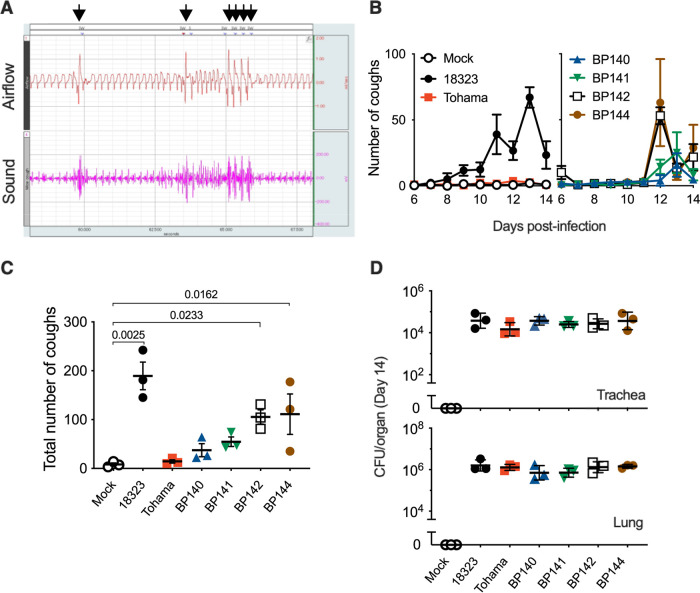
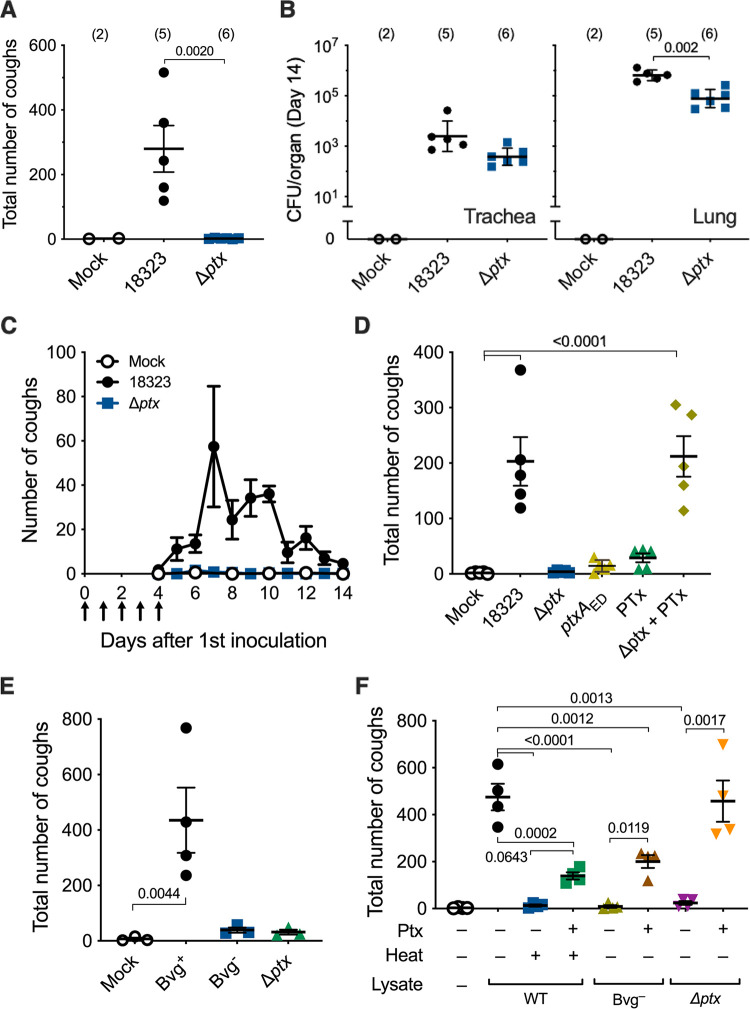
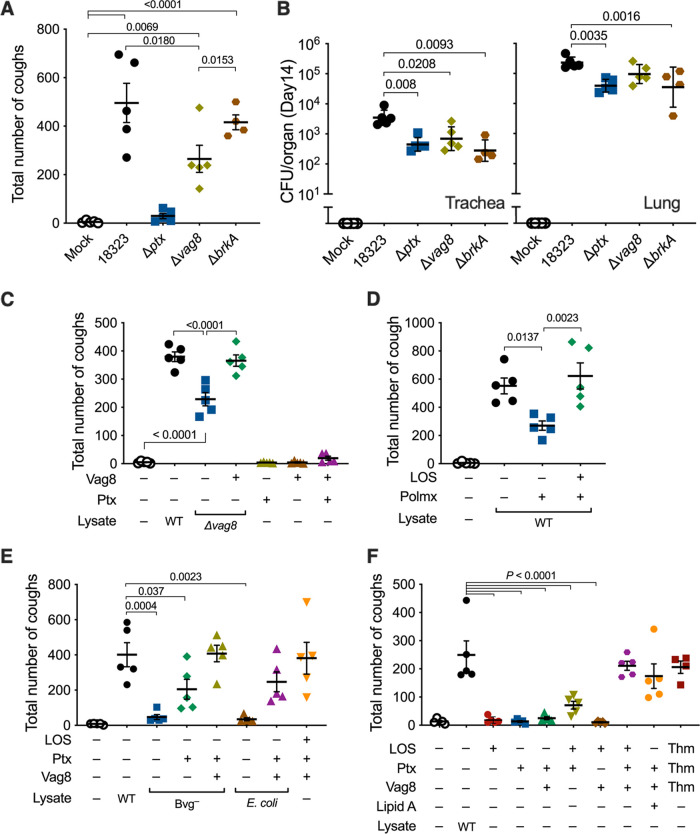
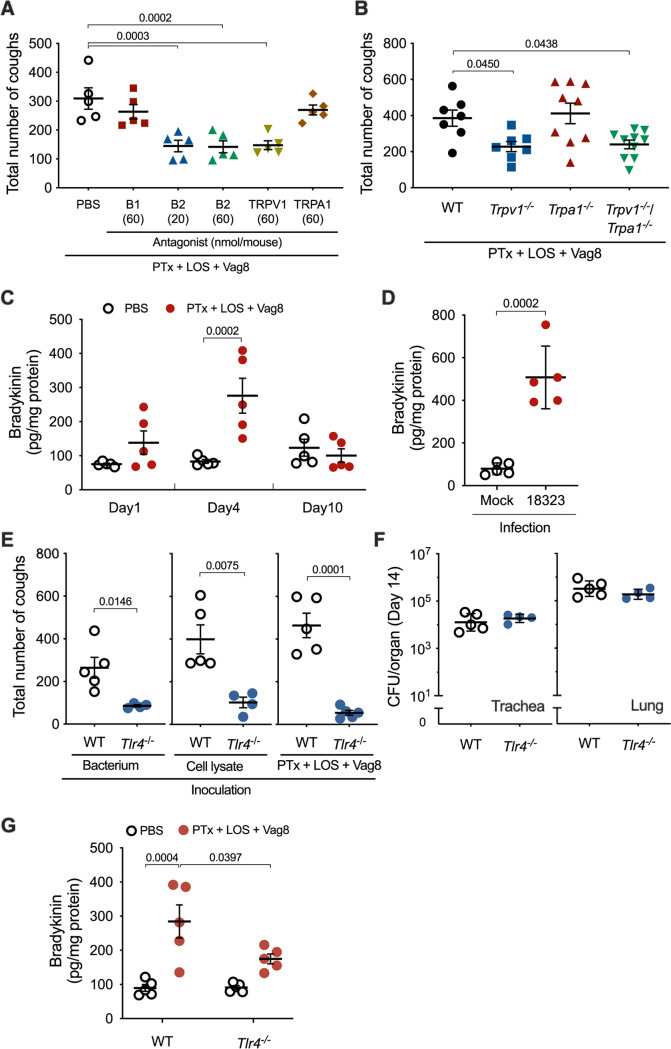
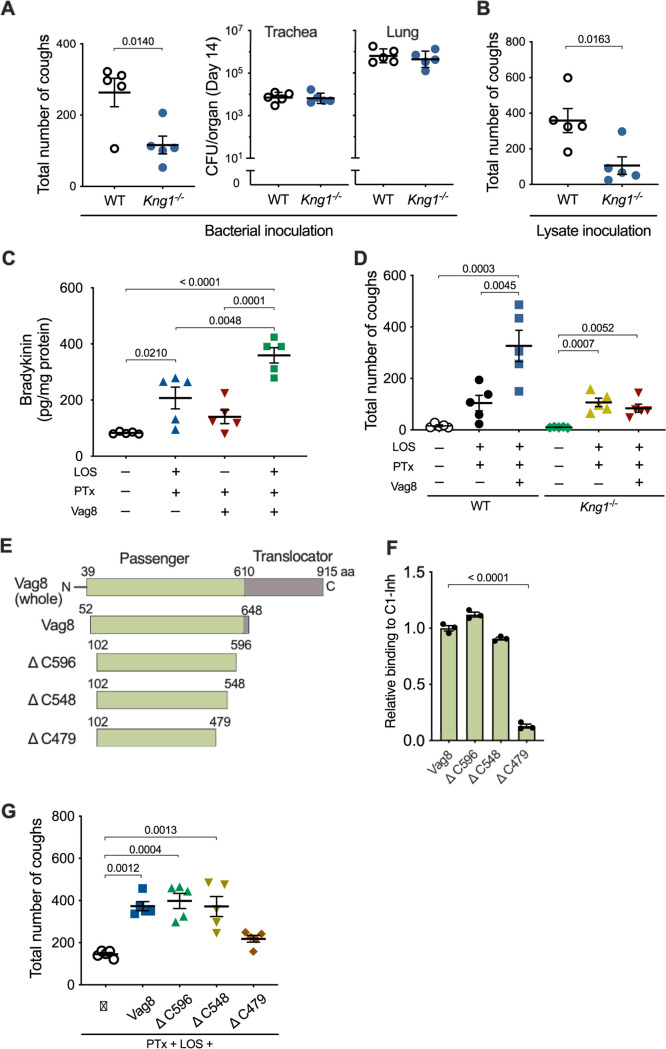
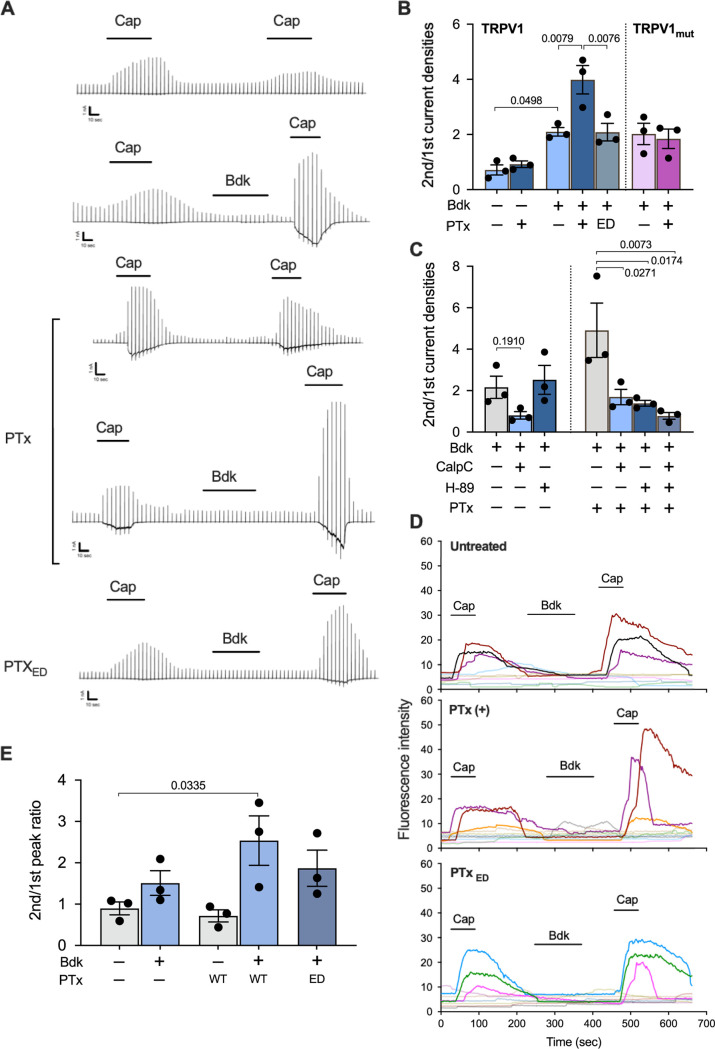
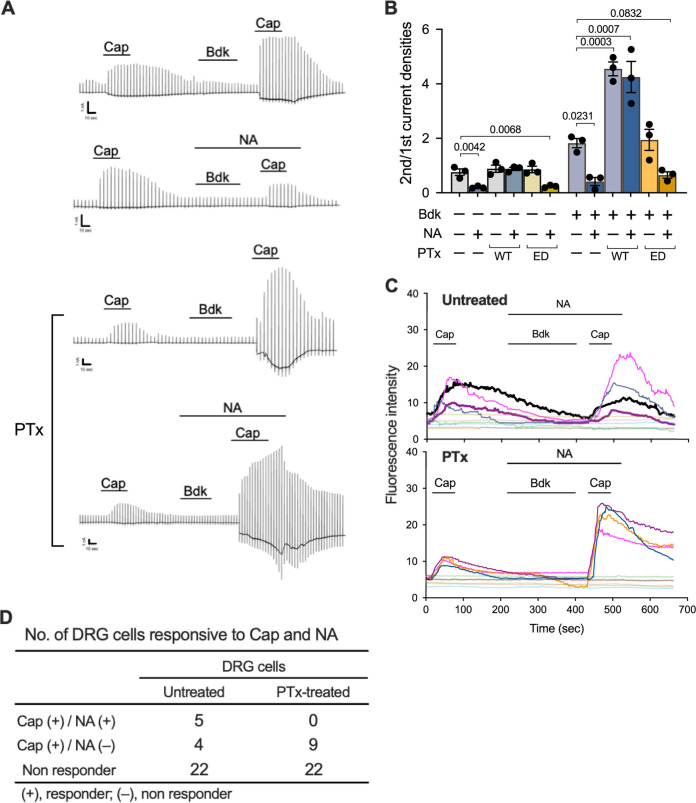
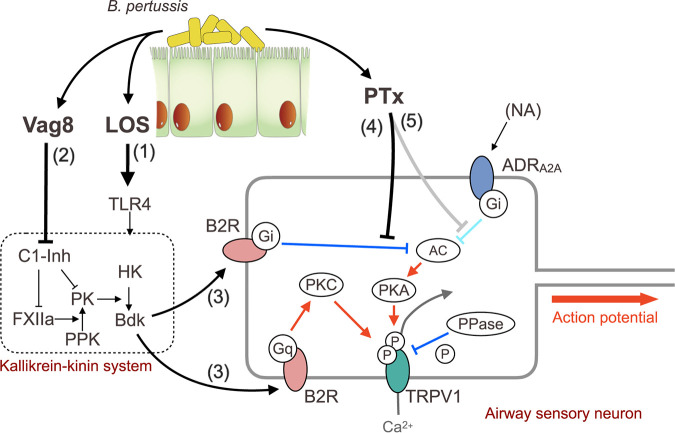
Pertussis, also known as whooping cough, is a contagious respiratory disease caused by the Gram-negative bacterium Bordetella pertussis. This disease is characterized by severe and uncontrollable coughing, which imposes a significant burden on patients. However, its etiological agent and the mechanism are totally unknown because of a lack of versatile animal models that reproduce the cough. Here, we present a mouse model that reproduces coughing after intranasal inoculation with the bacterium or its components and demonstrate that lipooligosaccharide (LOS), pertussis toxin (PTx), and Vag8 of the bacterium cooperatively function to cause coughing. Bradykinin induced by LOS sensitized a transient receptor potential ion channel, TRPV1, which acts as a sensor to evoke the cough reflex. Vag8 further increased bradykinin levels by inhibiting the C1 esterase inhibitor, the major downregulator of the contact system, which generates bradykinin. PTx inhibits intrinsic negative regulation systems for TRPV1 through the inactivation of Gi GTPases. Our findings provide a basis to answer long-standing questions on the pathophysiology of pertussis cough. IMPORTANCE The Gram-negative bacterium Bordetella pertussis causes a respiratory disease called whooping cough, or pertussis. This disease is characterized by paroxysmal coughing, the mechanism of which has not been intensively studied because of a lack of versatile animal models that reproduce the cough. In this study, we present a mouse model that reproduces coughing after intranasal inoculation with the bacterium or its components. Using this model, we demonstrate that lipooligosaccharide, Vag8, and pertussis toxin of the bacteria cooperatively function to cause coughing. Our results also indicate that bradykinin, an inflammatory mediator, and TRPV1, an ion channel linked to nociceptive signaling, are host factors involved in the coughing mechanism.

Keywords: Bordetella pertussis; TRPV1; Vag8; bradykinin; cough; pertussis toxin.


Conflict of interest statement

The authors declare no conflict of interest.

Figures

FIG 1
FIG 1
Coughing of mice inoculated with B. pertussis. (A) Waveforms of airflow and sounds of B. pertussis-induced coughing. Arrows indicate airflow waveforms (coughing) coinciding with a characteristic click-like sound. The data were obtained by the plethysmograph system. The downward deflection of the airflow waveforms indicates inspiration. (B to D) Cough production in C57BL/6J mice inoculated with the indicated strains of B. pertussis (n = 3). The number of coughs was counted for 5 min/mouse/day for 9 days from days 6 to 14 postinoculation (B), and the total number is expressed (C). The number of bacteria recovered from the tracheas and lungs was counted on day 14 (D). The experiments were repeated at least twice, and representative data are shown (B to D). Each plot represents the mean ± standard error of the mean (SEM) (B). Each horizontal bar represents the mean ± SEM (C) or geometric mean ± standard deviation (SD) (D). One-way ANOVA with Dunnett’s test to compare with mock inoculated (C) and with Tukey’s test (D) was used.
FIG 2
FIG 2
Involvement of PTx in B. pertussis-induced coughing. (A and B) Cough production in C57BL/6J mice inoculated with wild-type (18323), and Δptx strains of B. pertussis. SS medium without the bacteria was used for mock inoculation. The number of coughs was counted for 5 min/mouse/day for 9 days from days 6 to 14 postinoculation, and the total number is expressed (A). The number of bacteria recovered from the tracheas and lungs was counted on day 14 (B). (C to F) Cough production in mice inoculated with cell lysates from B. pertussis wild-type and mutant strains. Mice were intranasally inoculated with cell lysates of the B. pertussis 18323 wild type or indicated mutants with or without PTx (200 ng) on days 0 to 4 (arrows in panel C). The number of coughs was counted for 11 days from days 4 to 14 (C) and expressed as the sum from days 6 to 14 (D to F). PBS was used for mock inoculation. “Heat +” in panel F indicates cell lysates incubated at 56°C for 1 h. The experiments were repeated at least twice, and representative data are shown. Each of the horizontal bars and plots represents the mean ± SEM (A and C to F) or the geometric mean ± SD (B). One-way ANOVA with Dunnett’s test to compare with 18323 (A and B) or mock inoculation (D and E) and with Tukey’s test (F) was used. The number of mice in each test group is presented in parentheses (A and B) or as follows: n =5 in panels C and D, n = 3 or 4 in panel E, and n = 4 in panel F.
FIG 3
FIG 3
Involvement of Vag8 and LOS in B. pertussis-induced coughing. (A and B) Cough production in mice infected with B. pertussis. The numbers of coughs were counted for 5 min/mouse/day from days 6 to 14 postinoculation (A). The numbers of bacteria recovered from the tracheas and lungs on day 14 postinoculation were enumerated (B). (C to F) Cough production in mice inoculated with various preparations of bacterial components. The number of coughs was counted, and the sum of coughs from days 6 to 14 is shown. The inoculated preparations were as follows: cell lysates from B. pertussis 18323 wild-type (WT) (C to F), the Δvag8 mutant (C), Bvg-phase locked mutants (E), and E. coli DH5α (E) and cell lysates of the B. pertussis 18323 wild type that were pretreated with Detoxi-Gel (polymyxin B [Polmx +]) (D), PTx (C, E, and F), Vag8 (C, E, and F), and LOS (D to F) of the 18323 strain and synthetic lipid A of E. coli (F). PTx, Vag8, and LOS of the Tohama strain are indicated as “Thm” (F). PBS was used for mock inoculation. The experiments were performed at least twice, and representative data are shown. Each horizonal bar represents the mean ± SEM (A and C to F) or geometric mean ± SD (B). One-way ANOVA with Tukey’s test (A, C, and D) and with Dunnett’s test to compare with 18323 wild type (B, E, and F) was used for statistical analyses. The number of mice in each test group is as follows: n = 5 in panels A to E, and n = 4 or 5 in panel F.
FIG 4
FIG 4
Involvement of host factors B2R and TRPV1 in B. pertussis-induced coughing. (A) Effects of antagonists on cough reflex-related pathways in B. pertussis-induced coughing. Each mouse was inoculated with 20 or 60 nmol of antagonists against Bdk receptors (B1 and B2), TRPV1 and TRPA1, or PBS (300 μL) prior to inoculation with combinations of PTx, LOS, and Vag8. The sum of coughs from days 6 to 14 is shown. (B) Cough production in mice deficient in TRP ion channels. The sum of coughs from days 6 to 14 is shown. (C and D) Bdk concentrations in the BALF of mice. Mice were inoculated with the combination of PTx, LOS, and Vag8 (C) or B. pertussis 18323 (D), and the concentrations of Bdk in BALF on days 1, 4, and 10 (C) or 4 (D) were determined. (E and F) Cough production in mice deficient in TLR4. The mice were inoculated with B. pertussis 18323 (left panel), the cell lysate of the bacteria (center panel), or the combination of PTx, LOS, and Vag8 (right panel). The sum of coughs from days 6 to 14 is shown (E). The number of bacteria recovered from the tracheas and lungs was counted on day 14 postinoculation of the experiment of the left panel (F). (G) Bdk concentrations in the BALF of mice. The concentrations of Bdk were determined on day 4. The experiments were performed at least twice, and representative data are shown. Each horizontal bar represents the mean ± SEM (A, C, D, and G, n = 5; B, n = 7 to 10; E, n = 4 to 5) or geometric mean ± SD (F, n = 4 to 5). One-way ANOVA with Dunnett’s test to compare with PBS (A) or wild-type mice (B), two-way ANOVA with Sidak’s test (C and G), and an unpaired t test (D to F) were used for statistical analyses.
FIG 5
FIG 5
Role of Vag8 in cough production. (A, B, and D) Cough production of wild-type (WT) and Kng1−/− mice. Mice were inoculated with B. pertussis 18323 (A), the cell lysate of the bacteria (B), or combinations (D) of PTx, LOS, and Vag8. The sum of coughs from days 6 to 14 (A, left panel, B, and D) and the numbers of the bacteria recovered from the trachea and lungs on day 14 (A, right panel) are shown. (C) Bdk concentrations in the BALF of mice inoculated with PTx, LOS, and/or Vag8. (E) Schematic representations of Vag8 and recombinant proteins. The passenger domain of Vag8 (Vag8) and truncated derivatives are listed with their names and amino acid positions. (F) Binding of the Vag8 recombinant proteins to C1-Inh. Relative binding levels of the Vag8 recombinant proteins are expressed as OD450 values normalized to those for Vag8 in the ELISA-based binding assay. Bars represent the means ± SEM (n = 3). (G) Cough production of mice inoculated with Vag8 (500 ng, ca. 8 pmol) or the truncated derivatives (ΔC596, ΔC548, or ΔC479, 24 pmol) along with PTx and LOS. The sum of coughs from days 6 to 14 are shown. The data were obtained from one experiment. Each horizontal bar represents the mean ± SEM (A, left panel, B to D, and G) or geometric mean ± SD (A, right panel) (n = 5). An unpaired t test (A and B) and one-way ANOVA with Tukey’s test (C and D) or with Dunnett’s test to compare with Vag8 (F) or PTx plus LOS (G) were used for statistical analyses.
FIG 6
FIG 6
Role of PTx in Bdk-induced sensitization of TRPV1. (A) Current responses of HEK293T cells expressing B2R and wild-type TRPV1 to repetitive applications of Cap and an intervening application of Bdk. Representative traces of Cap-evoked currents are shown. Scales at the left bottom of each trace indicate 1 nA and 10 s on the ordinate and abscissa, respectively. Horizontal bars below the reagent names indicate the incubation period of each reagent. (B and C) Ratio of the second peak to the initial peak of the current densities induced by Cap. The cells expressing TRPV1 or TRPV1mut were preincubated with or without PTx or the enzymatically inactive derivative of PTx (PTxED) for 24 to 30 h prior to the recording (A to C). The cells were stimulated with Bdk and subsequently Cap in the presence of 1 μM CalpC and/or H-89 (C). Values represent the means ± SEM from three independent cells. (D) Intracellular calcium levels of DRG cells changed in response to repetitive applications of Cap. Isolated DRG cells pretreated with or without PTx or PTxED were subjected to calcium imaging with transient applications of Cap (1 μM for 1 min) and Bdk (100 nM for 3 min). Each line represents a single cell isolated from DRG. Nine to 10 independent cells were tested for each experiment. The results for Cap-sensitive neurons are strongly colored. (E) Fluorescence intensity ratios of the second peak to the initial peak increased in response to Cap. A series of experiments were conducted once (B to E). Values represent the means ± SEM from three independent cells. One-way ANOVA with Tukey’s test (B) and with Dunnett’s test to compare with Bdk+ (C, left), Bdk+/PTx+ (C, right), or Bdk/PTx (E) was used for statistical analyses.
FIG 7
FIG 7
Reversal of the inhibitory effect of NA on Cap-evoked and Bdk-sensitized TRPV1 by PTx. (A and B) Current responses of HEK293T cells expressing B2R, TRPV1, and ADRA2A to repetitive applications of Cap and intervening applications of Bdk in the presence or absence of NA. The cells were treated with PTx or PTxED or untreated prior to the whole-cell patch-clamp recording. Representative traces of Cap-evoked currents (A) and the ratio of the second peak to the initial peak of current densities induced by Cap (B) are shown. Scales at the left bottom of each trace indicate 1 nA and 10 s on the ordinate and abscissa, respectively. Horizontal bars below the reagent names indicate the incubation period of each reagent (A). A series of experiments were conducted once. Plotted data in panel B represent means ± SEM from three independent cells. One-way ANOVA with Dunnett’s test was used to compare with Bdk/NA/PTx (left) or Bdk+/NA/PTx (right). (C) Intracellular calcium levels of DRG cells changed in response to repetitive applications of Cap (1 μM, 1 min) and an intervening application of Bdk (100 nM, 3 min) in the presence of NA (100 nM, 5 min). Temporal changes in the calcium levels are shown. Each line represents a single cell isolated from DRG, and the results from 10 independent cells are depicted in each panel. The cells that responded to Cap are highlighted in different colors. The cells that responded to both Cap and NA are represented by thick lines with highlighted colors. The highlighted thin lines indicate cells responsive to Cap, but not responsive to NA. (D) Numbers of DRG cells that responded to Cap and NA. Thirty-one DRG cells were, respectively, examined in the PTx-untreated and PTx-treated test groups. A series of experiments were conducted once. Note that no cells responded to NA in the PTx treatment group, whereas 5 out of 31 cells responded to NA in the untreated group.
FIG 8
FIG 8
Action of LOS, Vag8, and PTx in cough production. Shown are the steps involved in the action of LOS, Vag8, and PTx to produce coughing. See the Discussion in the main text.

Comment in

References

    1. Tan T, Dalby T, Forsyth K, Halperin SA, Heininger U, Hozbor D, Plotkin S, Ulloa-Gutierrez R, von König CHW. 2015. Pertussis across the globe: recent epidemiologic trends from 2000 to 2013. Pediatr Infect Dis J 34:e222–e232. doi:10.1097/INF.0000000000000795. - DOI - PubMed
    1. Twillert I, van Han WGH, van Els CACM. 2015. Waning and aging of cellular immunity to B. pertussis. Pathog Dis :ftv071. doi:10.1093/femspd/ftv071. - DOI - PMC - PubMed
    1. Kilgore PE, Salim AM, Zervos MJ, Schmitt H-J. 2016. Pertussis: microbiology, disease, treatment, and prevention. Clin Microbiol Rev 29:449–486. doi:10.1128/CMR.00083-15. - DOI - PMC - PubMed
    1. Warfel JM, Beren J, Kelly VK, Lee G, Merkel TJ. 2012. Nonhuman primate model of pertussis. Infect Immun 80:1530–1536. doi:10.1128/IAI.06310-11. - DOI - PMC - PubMed
    1. Warfel JM, Beren J, Merkel TJ. 2012. Airborne transmission of Bordetella pertussis. J Infect Dis 206:902–906. doi:10.1093/infdis/jis443. - DOI - PMC - PubMed

Publication types

LinkOut - more resources