

Machine learning from Pseudomonas aeruginosa transcriptomes identifies independently modulated sets of genes associated with known transcriptional regulators
- PMID: 35357493
- PMCID: PMC9023270
- DOI: 10.1093/nar/gkac187
Machine learning from Pseudomonas aeruginosa transcriptomes identifies independently modulated sets of genes associated with known transcriptional regulators
Abstract
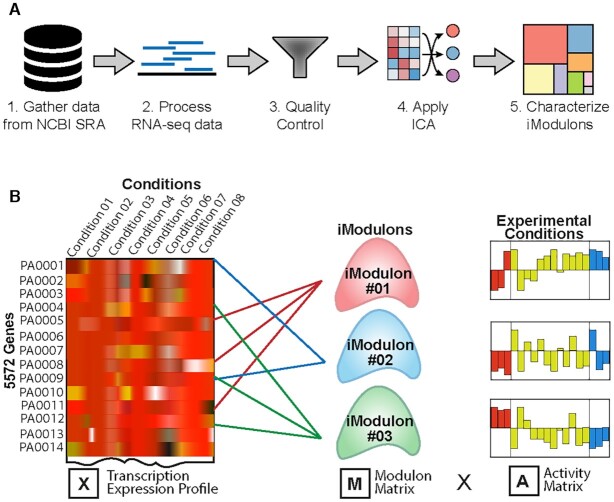
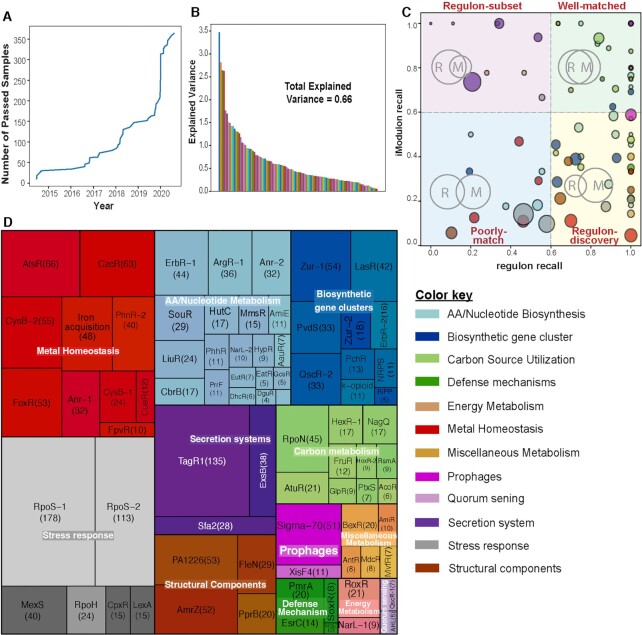
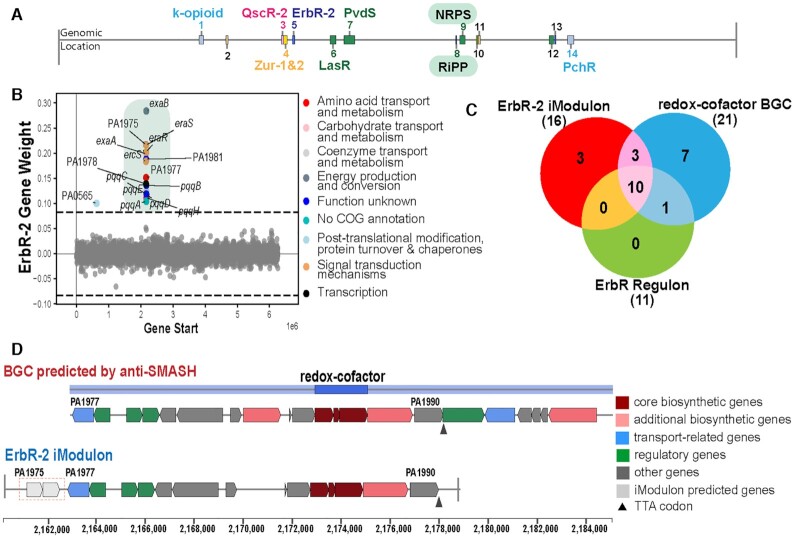
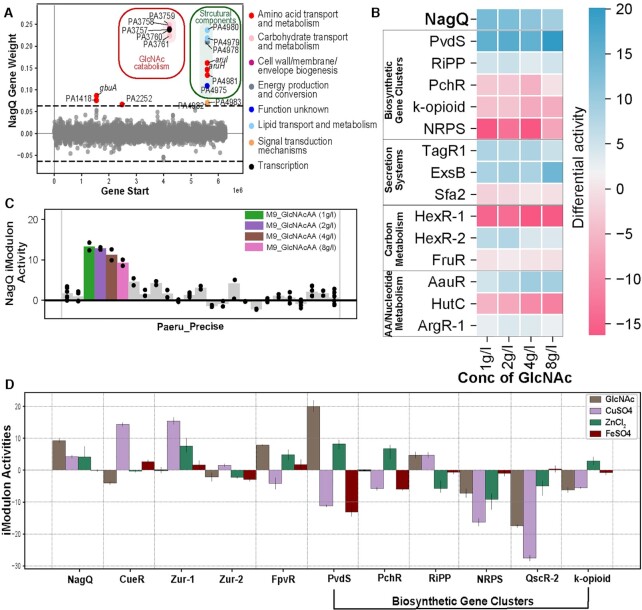
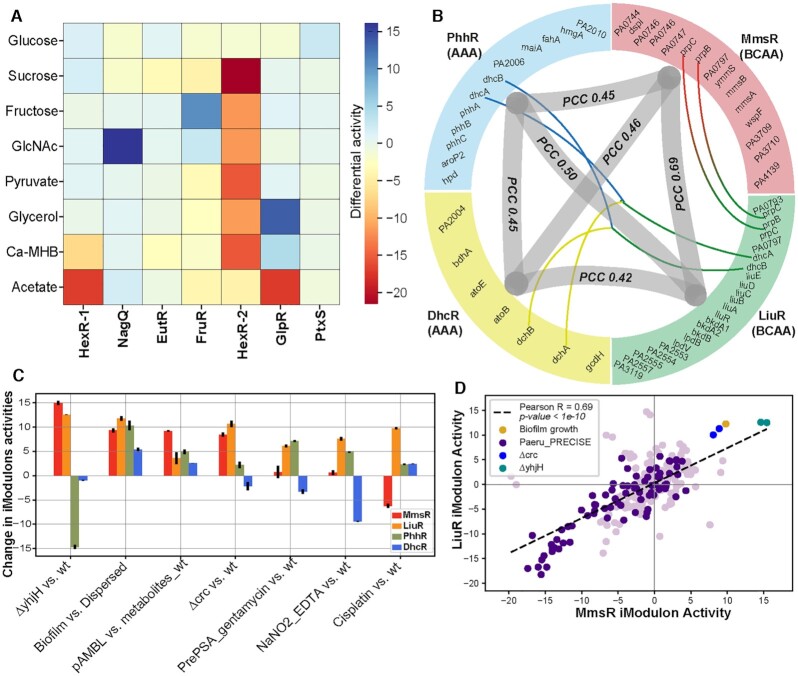
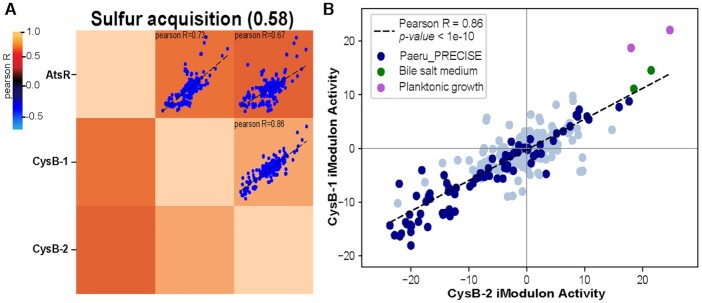
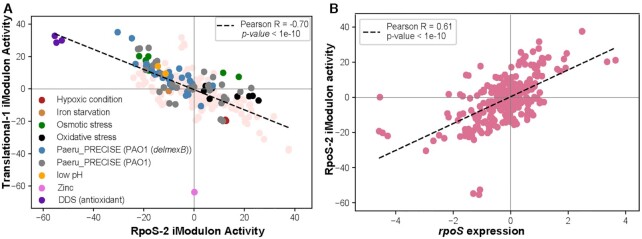
The transcriptional regulatory network (TRN) of Pseudomonas aeruginosa coordinates cellular processes in response to stimuli. We used 364 transcriptomes (281 publicly available + 83 in-house generated) to reconstruct the TRN of P. aeruginosa using independent component analysis. We identified 104 independently modulated sets of genes (iModulons) among which 81 reflect the effects of known transcriptional regulators. We identified iModulons that (i) play an important role in defining the genomic boundaries of biosynthetic gene clusters (BGCs), (ii) show increased expression of the BGCs and associated secretion systems in nutrient conditions that are important in cystic fibrosis, (iii) show the presence of a novel ribosomally synthesized and post-translationally modified peptide (RiPP) BGC which might have a role in P. aeruginosa virulence, (iv) exhibit interplay of amino acid metabolism regulation and central metabolism across different carbon sources and (v) clustered according to their activity changes to define iron and sulfur stimulons. Finally, we compared the identified iModulons of P. aeruginosa with those previously described in Escherichia coli to observe conserved regulons across two Gram-negative species. This comprehensive TRN framework encompasses the majority of the transcriptional regulatory machinery in P. aeruginosa, and thus should prove foundational for future research into its physiological functions.
© The Author(s) 2022. Published by Oxford University Press on behalf of Nucleic Acids Research.
Figures
Similar articles
-
Machine-learning from Pseudomonas putida KT2440 transcriptomes reveals its transcriptional regulatory network.Metab Eng. 2022 Jul;72:297-310. doi: 10.1016/j.ymben.2022.04.004. Epub 2022 Apr 27. Metab Eng. 2022. PMID: 35489688
-
Machine Learning of All Mycobacterium tuberculosis H37Rv RNA-seq Data Reveals a Structured Interplay between Metabolism, Stress Response, and Infection.mSphere. 2022 Apr 27;7(2):e0003322. doi: 10.1128/msphere.00033-22. Epub 2022 Mar 21. mSphere. 2022. PMID: 35306876 Free PMC article.
-
Machine learning uncovers the transcriptional regulatory network for the production host Streptomyces albidoflavus.Cell Rep. 2025 Mar 25;44(3):115392. doi: 10.1016/j.celrep.2025.115392. Epub 2025 Mar 8. Cell Rep. 2025. PMID: 40057950
-
The Pseudomonas aeruginosa AlgZR two-component system coordinates multiple phenotypes.Front Cell Infect Microbiol. 2014 Jun 20;4:82. doi: 10.3389/fcimb.2014.00082. eCollection 2014. Front Cell Infect Microbiol. 2014. PMID: 24999454 Free PMC article. Review.
-
Iron uptake regulation in Pseudomonas aeruginosa.Biometals. 2009 Feb;22(1):15-22. doi: 10.1007/s10534-008-9193-0. Epub 2009 Jan 8. Biometals. 2009. PMID: 19130263 Review.
Cited by
-
Thermodynamic modeling of RsmA - mRNA interactions capture novel direct binding across the Pseudomonas aeruginosa transcriptome.Front Mol Biosci. 2025 Feb 20;12:1493891. doi: 10.3389/fmolb.2025.1493891. eCollection 2025. Front Mol Biosci. 2025. PMID: 40051501 Free PMC article.
-
The hallmarks of a tradeoff in transcriptomes that balances stress and growth functions.Res Sq [Preprint]. 2023 Apr 12:rs.3.rs-2729651. doi: 10.21203/rs.3.rs-2729651/v1. Res Sq. 2023. Update in: mSystems. 2024 Jul 23;9(7):e0030524. doi: 10.1128/msystems.00305-24. PMID: 37090546 Free PMC article. Updated. Preprint.
-
Advanced transcriptomic analysis reveals the role of efflux pumps and media composition in antibiotic responses of Pseudomonas aeruginosa.Nucleic Acids Res. 2022 Sep 23;50(17):9675-9688. doi: 10.1093/nar/gkac743. Nucleic Acids Res. 2022. PMID: 36095122 Free PMC article.
-
Using genome-wide expression compendia to study microorganisms.Comput Struct Biotechnol J. 2022 Aug 10;20:4315-4324. doi: 10.1016/j.csbj.2022.08.012. eCollection 2022. Comput Struct Biotechnol J. 2022. PMID: 36016717 Free PMC article. Review.
-
Identification of Staphylococcus aureus virulence-modulating RNA from transcriptomics data with machine learning.Virulence. 2023 Dec;14(1):2228657. doi: 10.1080/21505594.2023.2228657. Virulence. 2023. PMID: 37431942 Free PMC article.
References
-
- Seshasayee A.S.N., Bertone P., Fraser G.M., Luscombe N.M.. Transcriptional regulatory networks in bacteria: from input signals to output responses. Curr. Opin. Microbiol. 2006; 9:511–519. - PubMed
