. 2022 Mar 31;117(1):17.
doi: 10.1007/s00395-022-00924-9.

Alkaline nucleoplasm facilitates contractile gene expression in the mammalian heart

Affiliations

Alkaline nucleoplasm facilitates contractile gene expression in the mammalian heart

Alzbeta Hulikova et al. Basic Res Cardiol. .

Abstract

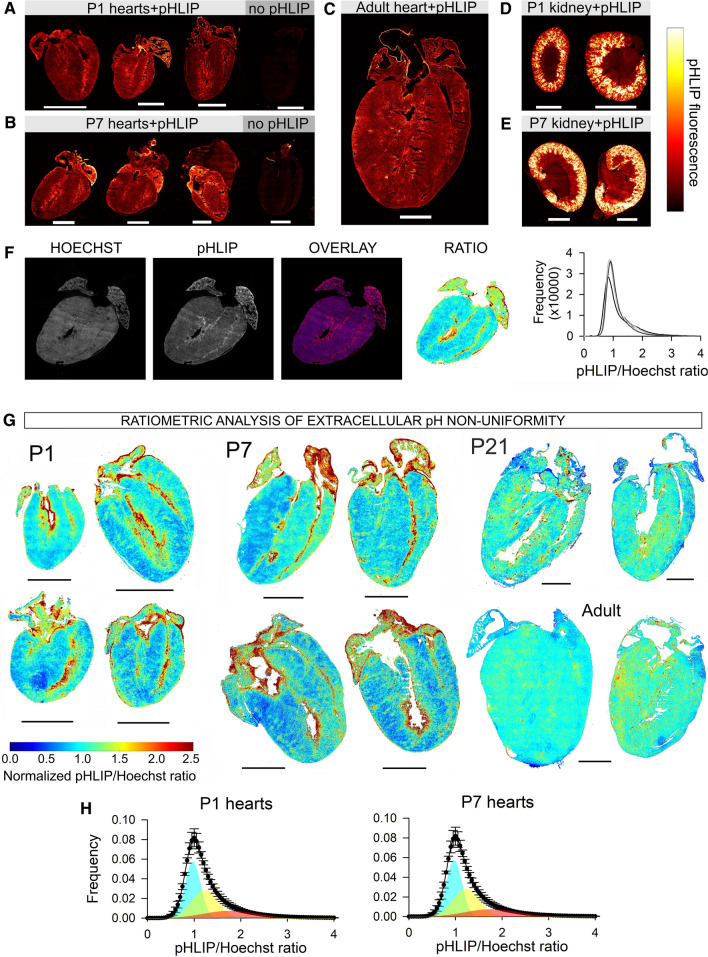
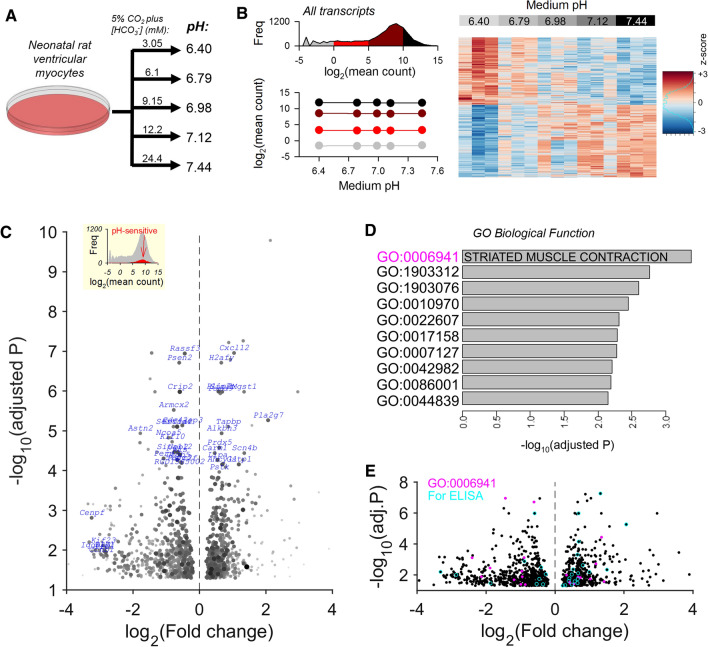
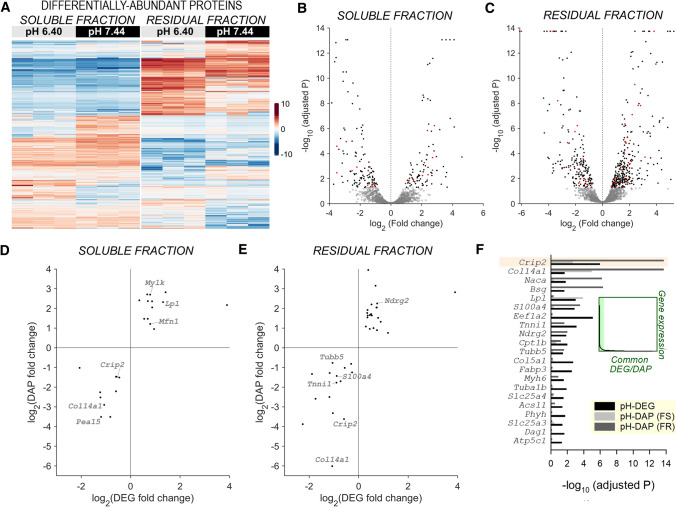
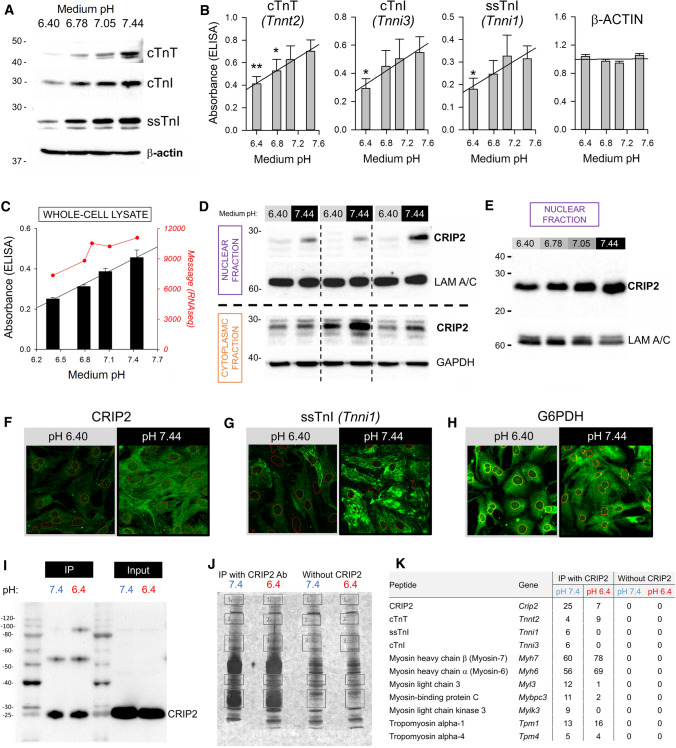
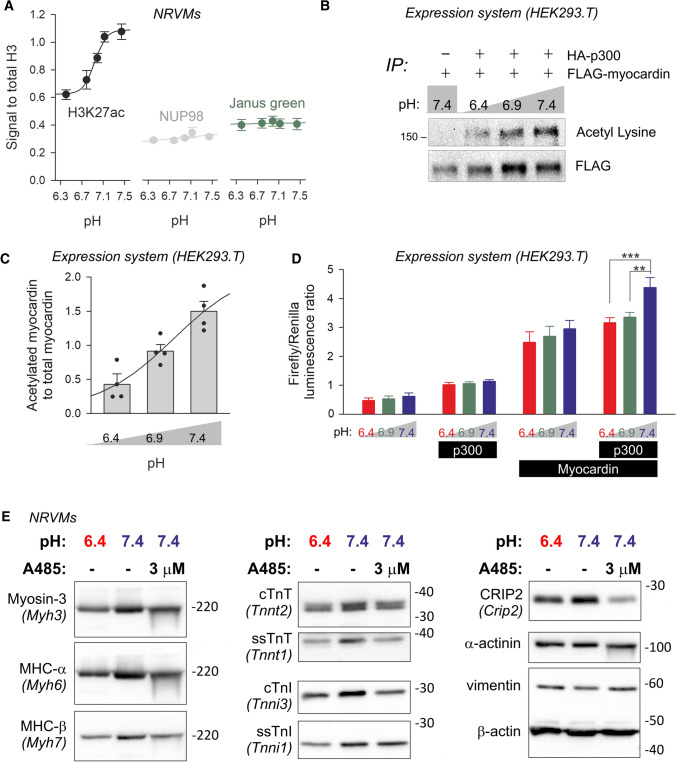
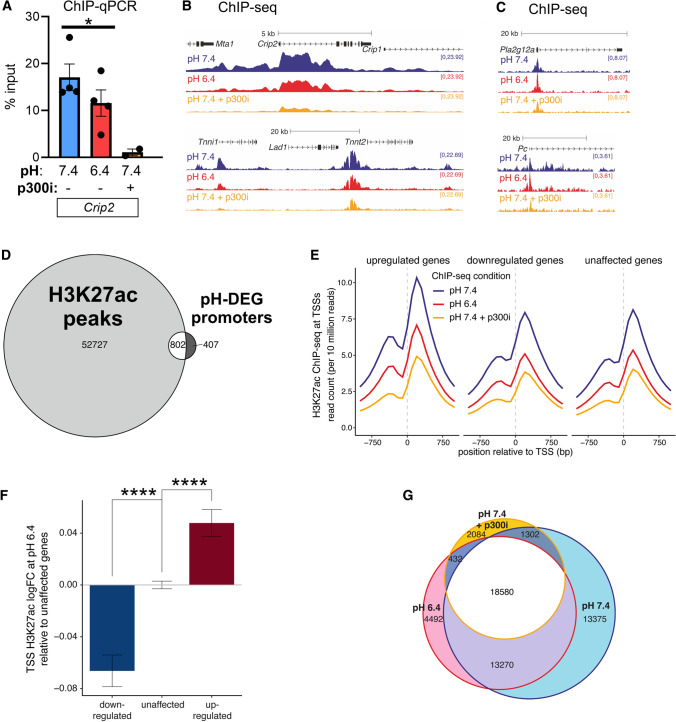
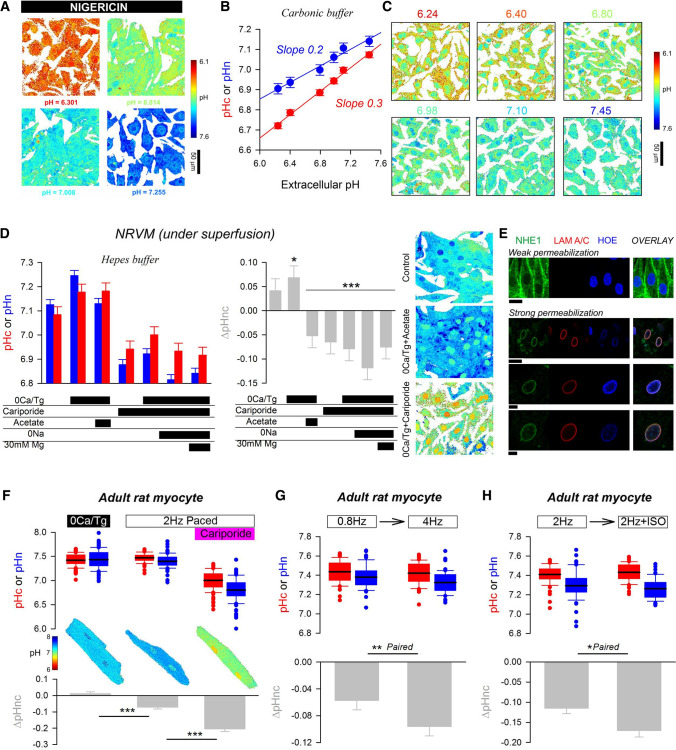
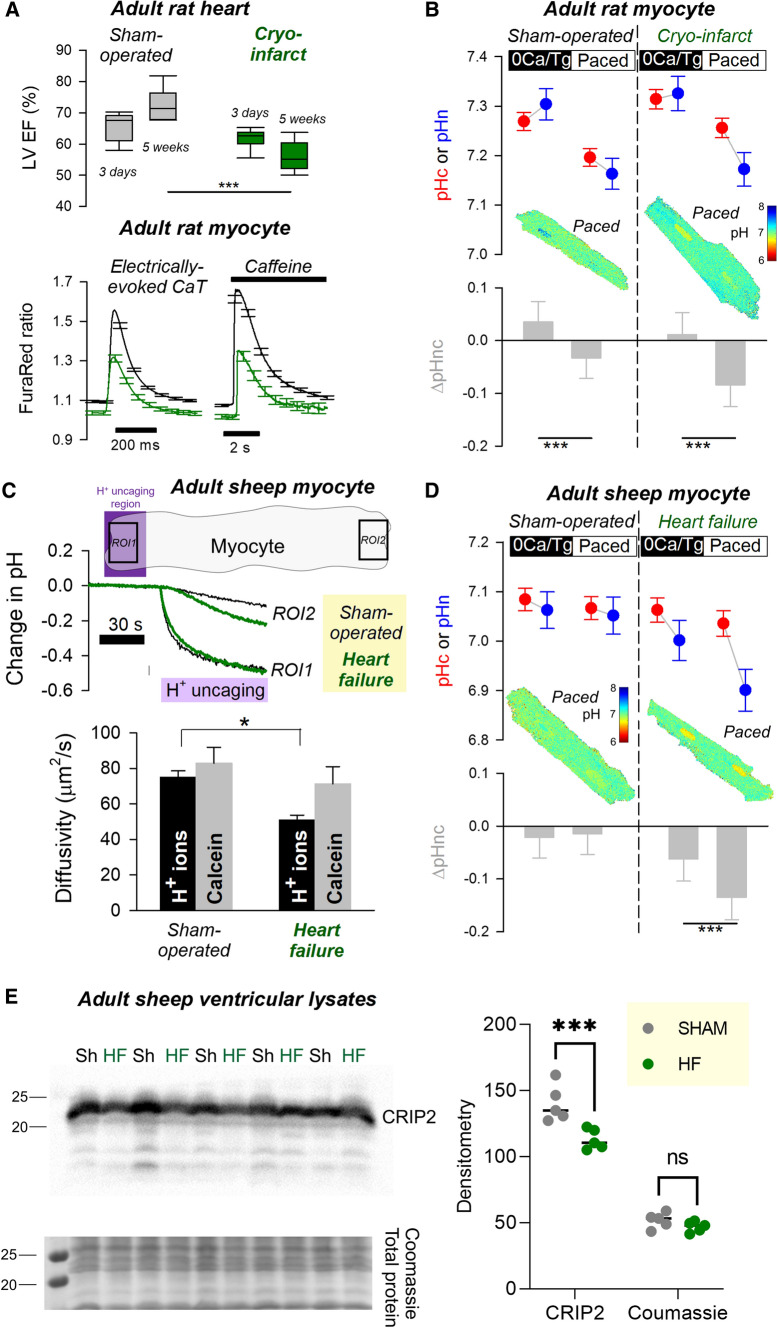
Cardiac contractile strength is recognised as being highly pH-sensitive, but less is known about the influence of pH on cardiac gene expression, which may become relevant in response to changes in myocardial metabolism or vascularization during development or disease. We sought evidence for pH-responsive cardiac genes, and a physiological context for this form of transcriptional regulation. pHLIP, a peptide-based reporter of acidity, revealed a non-uniform pH landscape in early-postnatal myocardium, dissipating in later life. pH-responsive differentially expressed genes (pH-DEGs) were identified by transcriptomics of neonatal cardiomyocytes cultured over a range of pH. Enrichment analysis indicated "striated muscle contraction" as a pH-responsive biological process. Label-free proteomics verified fifty-four pH-responsive gene-products, including contractile elements and the adaptor protein CRIP2. Using transcriptional assays, acidity was found to reduce p300/CBP acetylase activity and, its a functional readout, inhibit myocardin, a co-activator of cardiac gene expression. In cultured myocytes, acid-inhibition of p300/CBP reduced H3K27 acetylation, as demonstrated by chromatin immunoprecipitation. H3K27ac levels were more strongly reduced at promoters of acid-downregulated DEGs, implicating an epigenetic mechanism of pH-sensitive gene expression. By tandem cytoplasmic/nuclear pH imaging, the cardiac nucleus was found to exercise a degree of control over its pH through Na+/H+ exchangers at the nuclear envelope. Thus, we describe how extracellular pH signals gain access to the nucleus and regulate the expression of a subset of cardiac genes, notably those coding for contractile proteins and CRIP2. Acting as a proxy of a well-perfused myocardium, alkaline conditions are permissive for expressing genes related to the contractile apparatus.

Keywords: Acidity; CRIP2; Cardiomyocyte; Contraction; Nucleus.


Conflict of interest statement

OAA and YKR are founders of pHLIP, Inc. They have shares in the company, but the company did not fund any part of the work. TAM and NTC are shareholders in and consultants for Dark Blue Therapeutics Ltd.

Figures

Fig. 1
Fig. 1
The early postnatal myocardium maintains significant non-uniformity of extracellular pH that dissipates in later life. A P1 mice were injected with Cy5.5-pHLIP and hearts were excised one day later (controls received no injection). Images show fluorescence in coronal sections. Experiments were also performed on P7 (B) and adult (C) mice. D Fluorescence images of coronal sections of kidneys from P1 and E P7 mice. F Ratiometric imaging; hearts were dually stained with Cy5.5-pHLIP and Hoechst-33342. Ratiometric map shows pHLIP/Hoechst fluorescence. Frequency histogram of ratio obtained from 5 slices through the mid-luminal region of the heart. G Ratiometric images from P1, P7, P21 and adult hearts. Acidic niches (high ratio) are evident in early life. Scale bar 1.6 mm. H Frequency histograms of ratio from P1 (N = 6) and P7 (N = 6) are positively skewed and best fitted to three Gaussian distributions
Fig. 2
Fig. 2
Transcriptomics identify a subset of pH-responsive cardiac genes and pathways. A Protocol for determining the pH-responsive transcriptome in neonatal ventricular myocytes (NRVMs). Lysates were collected after 48 h of culture in serum-free medium at one of five pH levels. B Analysis of RNAseq performed on total RNA isolated from NRVMs. Histogram of transcripts by expression level, stratified into four groups according to abundance, demonstrating no overall trend in gene expression. Heatmap of differentially expressed genes (DEGs) analysed by DESeq2 using a model with multiple levels of a condition (pH). C Volcano plot of pH-responsive DEGs. Genes in blue are a selection of DEGs with a high combination of significance and fold-change, and abundance greater than the median of all DEGs. Fold-change relates to the ratio of signal at acidic and alkaline pH. D Gene enrichment analysis identified gene ontology (GO) biological functions associated with pH-responsiveness. GO:0006941: striated muscle contraction; GO:1903312: negative regulation of mRNA metabolic process; GO:1903076: regulation of protein localization to plasma membrane; GO:0010970: transport along microtubule; GO:0022607: cellular component assembly; GO:0017158: regulation of calcium ion-dependent exocytosis; GO:0007127: meiosis I; GO:0042982: amyloid precursor protein metabolic process; GO:0086001: cardiac muscle cell action potential; GO:0044839: cell cycle G2/M phase transition. E Volcano plot of pH-responsive DEGs indicating genes of the “striated muscle contraction” ontology (magenta) and genes selected for verification by ELISA inb subsequent experiments (cyan)
Fig. 3
Fig. 3
Unbiased proteomic experiments verify the most pH-responsive proteins. A Proteomic analysis by label-free mass spectrometry of fractionated NRVM lysates prepared after 48 h of culture in serum-free medium at pH 6.40 or 7.44. Heatmap shows differentially abundant proteins (DAPs). B Volcano plot of DAPs in the soluble fraction and C residual fraction. DAPs indicated in red were also identified as DEGs by RNAseq. D DAPs in the soluble fraction and their corresponding DEGs that showed a coordinated response to pH. Size of circle is proportional to the log2 of the mean expression level of corresponding DEG. E Analysis repeated for DAPs in the residual fraction. F Significance (adjusted P-value) for the most abundant pH-responsive DAPs/DEGs, ranked by transcript abundance
Fig. 4
Fig. 4
Validating the pH-sensitivity of troponin and Crip2 genes. A Western blot of whole-cell lysates collected from NRVMs after 48 h of culture in serum-free medium at one of four test pH levels for cardiac troponin-T (cTnT; Tnnt2), cardiac troponin-I (cTnI; Tnni3) and slow skeletal troponin-I (ssTnI; Tnni1). β-actin was re-developed using the same membrane as that used for ssTnI. B ELISA absorbance for cTnT, cTnI and ssTnI, and β-actin as a function of pH, normalized to mean signal (average from 4 isolations). **P < 0.01 and *P < 0.05 by ANOVA. C CRIP2 protein quantified by whole-cell ELISA, showing similar pH-dependence to transcript level (4 repeats). D Western blot of whole-cell lysates collected from NRVMs after 48 h of culture in serum-free medium at either pH 6.4 or 7.44. Each pair represents an independent isolation (i.e. biological repeat). Fractionated lysates showing pH-sensitivity of CRIP2 in the nucleus and cytoplasm, using lamin A/C and GAPDH as loading controls. E CRIP2 western blot of nuclear fractions of NRVM lysates confirm robust pH-responsiveness. F Immunofluorescence imaging of NRVM monolayers for CRIP2, G ssTnI (a pH-responsive DEG/DAP) and H G6PDH (a pH-insensitive protein). Red outlines indicate nuclear regions (Hoechst-33342). (I) Blot for NRVM lysates prepared after immunoprecipitation with CRIP2 antibody, following incubation at pH 6.4 or 7.4. IP blot compared to input. J Silver-stained gel produced from CRIP2 immunoprecipitation, highlighting gel areas selected for mass spectrometry. K Results of mass spectrometry analysis, highlighting proteins involved in contraction. Only proteins that were absent in the negative control (without CRIP2 antibody) but present in the IP are listed
Fig. 5
Fig. 5
A mechanism of pH-responsive cardiac gene expression involves the pH-sensitivity of p300/CBP. A 48 h of incubation of NRVMs in low pH reduces the H3K27ac mark, a readout of p300 activity (5 repeats; significant linear effect of pH; p < 0.01). The normalizing control was Janus green and NUP98 (Nucleoporin 98 And 96 Precursor). B Acetylation state of immunoprecipitated myocardin co-expressed in HEK293T cells with HA-p300. Final 4 h of culture was performed at pH 6.4, 6.9 or 7.4 by varying [HCO3] at constant CO2. C Quantification of the reduction of p300-dependent myocardin acetylation (4 repeats; significant linear trend by pH; P < 0.0007 by mixed-effects modelling regression analysis). D Firefly-to-Renilla luminescence ratio measured in HEK293T cells expressing myocardin and p300 (as indicated) with a Renilla reporter and firefly reporter of Tnnt2. To assess acute effects of pH, the final 4 h of incubation was at pH 6.4, 6.9 or 7.4. Alkaline pH had a significant stimulatory effect on transcriptional activity when p300 and myocardin were co-expressed (4 repeats; *P < 0.05, **P < 0.01 by two-way ANOVA; significant effect of pH). (E.) Western blots for pH-sensitive myosin heavy chain-family proteins (myosin heavy chain α and β, myosin-3), troponin isoforms (ss-slow skeletal, c-cardiac), CRIP2 and loading control (β actin). β-actin was re-developed using the same membrane as that used for cTnI. α-actinin and vimentin were used as a cardiomyocyte and fibroblast marker, respectively, to determine that the culture had not been enriched in fibroblasts as a result of treatment. Vimentin was re-developed using the same membrane as that used for Myh6. Lysates were prepared after 48 h of incubation at pH 6.4 or 7.4 in the presence or absence of p300 inhibitor A485 (3 µM). Repeats 2 and 3 are shown in Fig. S3, and densitometric quantification is given in Fig. S5
Fig. 6
Fig. 6
Acidic conditions disrupt H3K27ac at promoters of genes including those coding for contractile proteins. A ChIP-qPCR for H3K27ac at the promoter region of Crip2. Measurements from NRVMs after 48 h of incubation at pH 6.4 or 7.4 in the presence or absence of p300 inhibitor A485 (3 µM). Mean ± SEM of 5 biological repeats. B ChIP-seq tracks for H3K27ac at the indicated genomic loci for down-regulated pH-DEGs (Crip2 and Tnni1) and C up-regulated pH-DEGs (Pla2g12a and Pc). D ChIP-seq analysis of NRVMs identified the presence of H3K27ac peaks at promoter regions of the majority (two-thirds) of pH-DEGs. E Metaplot demonstrating the mean distribution of H3K27ac across the transcriptional start site (TSS) of genes grouped according to their transcriptional response to acidosis: downregulation, upregulation, or unaffected. Each line represents the mean H3K27ac level under the indicated condition. F Difference in mean log fold-change in H3K27ac levels at TSS' of genes that are downregulated or upregulated at low pH, relative to unaffected genes. Mann–Whitney test, ****P < 0.0001. G Overlap of H3K27ac peaks identified from ChIP-seq in NRVMs treated as indicated
Fig. 7
Fig. 7
Characterising the relationship between nuclear and cytoplasmic pH. A The protonophore nigericin collapses pH gradients across the intracellular compartment of NRVM monolayers, verifying the calibration of nuclear and cytoplasmic dyes. B Relationship between pHe, pHc and pHn in NRVMs under incubation conditions following 48 h of treatment in media of pH between 6.24 and 7.44. Each datapoint is mean ± SEM of 583–828 cells/5 isolations. C Exemplar images of monolayers showing degree of pHn regulation that becomes more prominent in acidic media. D Measurements of pHn/pHc in NRVMs following pharmacological treatments: thapsigargin (10 µM; 10 min) and superfusion with Ca2+-free buffer (0Ca/Tg, > 10 min); superfusion with cariporide (30 µM; > 10 min); superfusion with 40 mM acetate (osmotically-compensated; > 10 min), superfusion with Na+-free solution (replaced with NMDG) with either 1 or 30 mM Mg2+ (> 10 min). Mean ± SEM from 1730 to 2897 cells/4 isolations. (E) Immunofluorescence images of NRVMs stained for NHE1 and lamin A/C, also stained with Hoechst 33,342. Sarcolemmal NHE1 staining, with no lamin A/C signal after weak permeabilization (0.1% Triton X-100, 1 min). Nuclear NHE1 and lamin A/C immunofluorescence after stronger permeabilization (0.5% Triton X-100, 20–30 min) with DNaseI treatment (60 min) to reduce staining artefact due to chromatin. Scale bar is 10 µm. F Adult rat ventricular myocytes superfused with Hepes-buffered solution. pHc and pHn measured > 10 min after either Ca2+-depletion (0Ca/Tg), 2 Hz pacing, or 2 Hz pacing in presence of 30 µM cariporide. Box plots of > 100 cells/4 hearts (thick line shows mean; error bar span 90th percentile). G Effect of increasing pacing frequency and H stimulation (> 5 min) with 1 µM isoprenaline (ISO) in paired experiments (> 50 cells/4 isolations) under superfusion with Hepes buffer
Fig. 8
Fig. 8
Remodelling of nuclear pH control in models of heart disease. A Left ventricular (LV) ejection fraction (EF) measured by cine-MRI at 3 days and 5 weeks after surgery (sham, N = 6 or cryo-injury, N = 6) and electrically evoked Ca2+ transients and 10 mM caffeine-evoked Ca2+ release in FuraRed loaded myocytes isolated at 5 weeks post-surgery (> 50 cells from six isolations each). Amplitude of Ca2+ responses was significantly reduced in cryo-infarcted hearts (CaT: 0.302 ± 0.01 v 0.477 ± 0.013; P = 0.0002; SR load: 0.354 ± 0.17 v 0.644 ± 0.013; P < 0.0001). B pHn and pHc in rat myocytes from cryo-injured hearts (or sham controls), imaged under superfusion with carbonic buffer either following Ca2+-depletion (0Ca/Tg) or 2 Hz pacing. Mean ± SEM of > 117 cells/6 isolations. Hierarchical testing by two-way ANOVA. Type III analysis table: significant effect of 0Ca2+/pacing P = 0.002. C Photolytic H+ uncaging protocol to measure H+ diffusivity. Best-fit to data gives H+ diffusivity. Calcein diffusivity measured by FRAP protocol. D pHn and pHc in sheep myocytes from tachypaced failing hearts or sham controls, imaged under superfusion with carbonic buffer either following Ca2+-depletion (0Ca/Tg) or 2 Hz pacing. Mean ± SEM of > 120 cells/5 isolations. Hierarchical testing by two-way ANOVA. Type III analysis table: significant effect of 0Ca2+/pacing P = 0.002; significant interaction between 0Ca2+/pacing and heart (sham/failure) P = 0.003. E Western blot showing Crip2 downregulation in heart failure lysates compared to sham (Sh) from five sham and five HF animals. Quantification and analysis by two-way ANOVA. Significance: P = 0.003
Fig. 9
Fig. 9
Schematic for a proposed model by which pH influences cardiac gene expression

References

    1. Almulla HA, Bush PG, Steele MG, Ellis D, Flatman PW. Loading rat heart myocytes with Mg2+ using low-[Na+] solutions. J Physiol. 2006;575:443–454. doi: 10.1113/jphysiol.2006.109850. - DOI - PMC - PubMed
    1. Baartscheer A, Schumacher CA, van Borren MM, Belterman CN, Coronel R, Fiolet JW. Increased Na+/H+-exchange activity is the cause of increased [Na+]i and underlies disturbed calcium handling in the rabbit pressure and volume overload heart failure model. Cardiovasc Res. 2003;57:1015–1024. doi: 10.1016/S0008-6363(02)00809-X. - DOI - PubMed
    1. Beck M, Hurt E. The nuclear pore complex: understanding its function through structural insight. Nat Rev Mol Cell Biol. 2017;18:73–89. doi: 10.1038/nrm.2016.147. - DOI - PubMed
    1. Bkaily G, Nader M, Avedanian L, Jacques D, Perrault C, Abdel-Samad D, D'Orleans-Juste P, Gobeil F, Hazzouri KM. Immunofluorescence revealed the presence of NHE-1 in the nuclear membranes of rat cardiomyocytes and isolated nuclei of human, rabbit, and rat aortic and liver tissues. Can J Physiol Pharmacol. 2004;82:805–811. doi: 10.1139/y04-119. - DOI - PubMed
    1. Blane A, Fanucchi S. Effect of pH on the structure and Dna Binding of the FOXP2 Forkhead domain. Biochemistry. 2015 doi: 10.1021/acs.biochem.5b00155. - DOI - PubMed

Publication types