. 2022 Apr 20;13(8):1296-1314.
doi: 10.1021/acschemneuro.2c00057. Epub 2022 Mar 31.

O-GlcNAcase Inhibitor ASN90 is a Multimodal Drug Candidate for Tau and α-Synuclein Proteinopathies

Affiliations

O-GlcNAcase Inhibitor ASN90 is a Multimodal Drug Candidate for Tau and α-Synuclein Proteinopathies

Bruno Permanne et al. ACS Chem Neurosci. .

Abstract

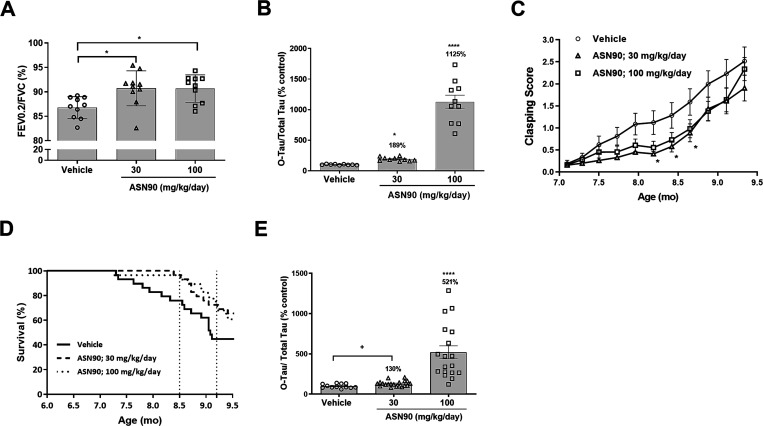
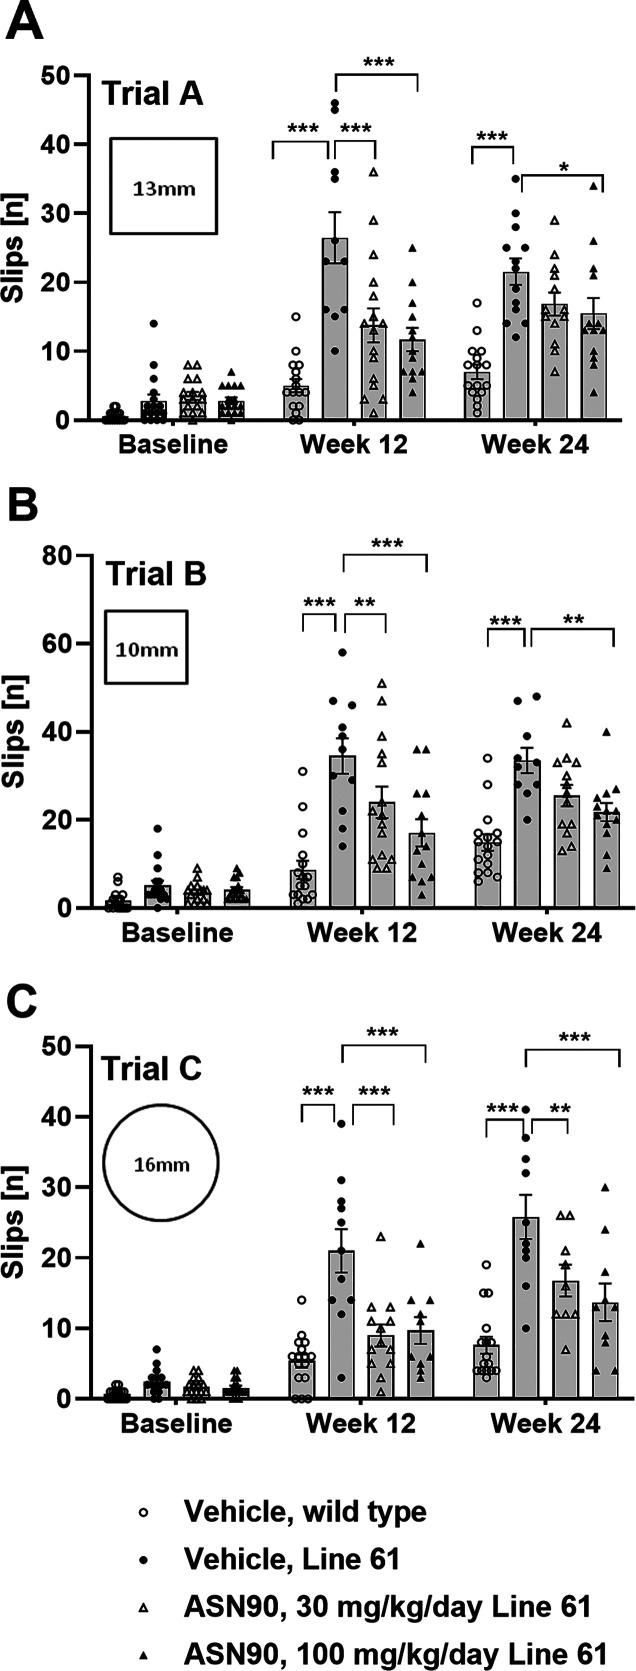
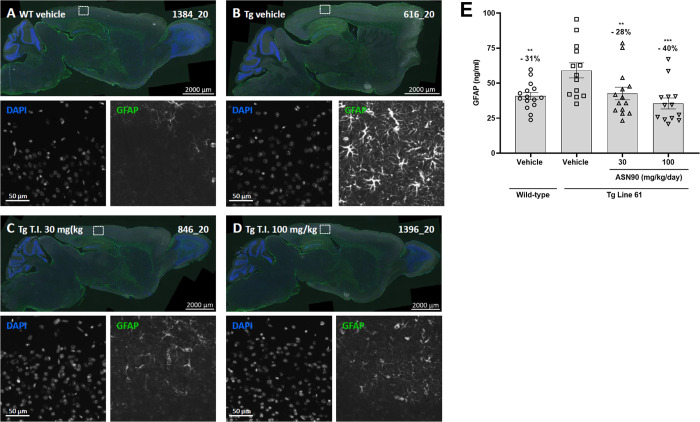
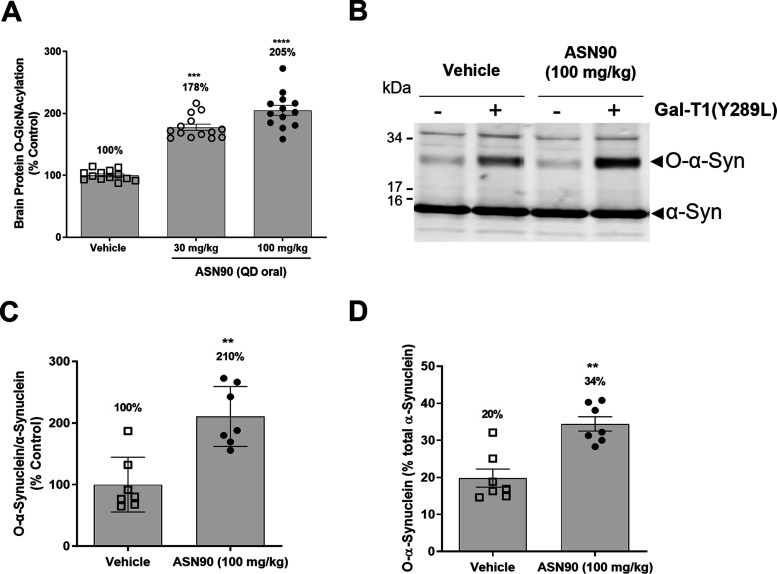
Neurodegenerative proteinopathies are characterized by the intracellular formation of insoluble and toxic protein aggregates in the brain that are closely linked to disease progression. In Alzheimer's disease and in rare tauopathies, aggregation of the microtubule-associated tau protein leads to the formation of neurofibrillary tangles (NFT). In Parkinson's disease (PD) and other α-synucleinopathies, intracellular Lewy bodies containing aggregates of α-synuclein constitute the pathological hallmark. Inhibition of the glycoside hydrolase O-GlcNAcase (OGA) prevents the removal of O-linked N-acetyl-d-glucosamine (O-GlcNAc) moieties from intracellular proteins and has emerged as an attractive therapeutic approach to prevent the formation of tau pathology. Like tau, α-synuclein is known to be modified with O-GlcNAc moieties and in vitro these have been shown to prevent its aggregation and toxicity. Here, we report the preclinical discovery and development of a novel small molecule OGA inhibitor, ASN90. Consistent with the substantial exposure of the drug and demonstrating target engagement in the brain, the clinical OGA inhibitor ASN90 promoted the O-GlcNAcylation of tau and α-synuclein in brains of transgenic mice after daily oral dosing. Across human tauopathy mouse models, oral administration of ASN90 prevented the development of tau pathology (NFT formation), functional deficits in motor behavior and breathing, and increased survival. In addition, ASN90 slowed the progression of motor impairment and reduced astrogliosis in a frequently utilized α-synuclein-dependent preclinical rodent model of PD. These findings provide a strong rationale for the development of OGA inhibitors as disease-modifying agents in both tauopathies and α-synucleinopathies. Since tau and α-synuclein pathologies frequently co-exist in neurodegenerative diseases, OGA inhibitors represent unique, multimodal drug candidates for further clinical development.

Keywords: Alzheimer’s disease; O-GlcNAcase inhibitor; Parkinson’s disease; drug development; microtubule-associated protein tau; proteinopathies; α-synuclein.


Conflict of interest statement

The authors declare the following competing financial interest(s): All authors are or were employees of Asceneuron and hold shares, founder warrants or stock options of the company.

Figures

Figure 1
Figure 1
ASN90 is a potent, substrate-competitive, and reversible OGA inhibitor. (A) Chemical structure of ASN90 and its less active (R)-enantiomer ASN89. (B) ASN90 potently inhibits recombinant human O-GlcNAcase as quantified with a fluorogenic substrate (IC50 = 10.2 nM). ASN89 is about 2 orders of magnitude less potent (IC50 = 1017 nM). (C) In wild-type HEK293 cells, the potency of ASN90 was measured by quantifying the accumulation of total protein O-GlcNAcylation (EC50 = 320 nM). A similar cellular potency was obtained when measuring tau O-GlcNAcylation with an antibody specifically recognizing tau O-GlcNAcylated at Serine 400 in HEK293 cells expressing human 2N4R tau (EC50 = 314 nM). Data (n = 3) are displayed as mean+/– SD. (D) Enzyme velocity (ΔF/min) was measured at increasing 4MU-NAG substrate concentrations and several fixed concentrations of ASN90. Increasing ASN90 concentrations affect the Km but not Vmax indicative of substrate competition. (E) The Lineweaver–Burk plot confirms competitive inhibition since all lines intercept the Y axis at the same point (Y = 1/Vmax). (F) The shift of in vitro potency (IC50) of ASN90 upon dilution of preformed enzyme/inhibitor complexes is indicative of a reversible enzyme inhibition. Data are displayed as the mean +/– SD (n = 3).
Figure 2
Figure 2
ASN90 PK/PD relationship and enzyme occupancy in wild-type rats after single-oral administration. ASN90 dose-dependently increased protein O-GlcNAcylation in both the rat brain (A) and rat PBMC (B) 4 h after a single-oral administration. Data are expressed in % vehicle control of protein O-GlcNAcylation (**p < 0.01, ***p < 0.001, ****p < 0.0001 versus vehicle groups, one-way ANOVA followed by Dunnett’s post hoc test, n = 6/group). (C) Plot of the rat brain and PBMC protein O-GlcNAcylation against log(dose) for ED50 calculation. (D) Highly significant correlation between the brain and PBMC pharmacodynamic response revealed by linear regression analysis (R2 = 0.99). (E) Relationship between ASN90 plasma concentrations and brain OGA enzyme occupancy in rats using the PET radioligand [18F]-LSN3316612, which specifically binds to OGA. The plasma concentration required to achieve 50% of OGA enzyme occupancy (Occ50) was 55.4 ng/mL. (F) Calculated relationship between protein O-GlcNAcylation at a steady state obtained from a separate PK/PD study (expressed as a fold increase in O-protein) and enzyme occupancy obtained from the PET study. The pharmacodynamic response (O-protein accumulation) started at about 35% calculated enzyme occupancy. The further accumulation of O-protein at >98% calculated target engagement at t = 4 h is likely reflective of the cumulative nature of the stabilization of protein O-GlcNAcylation at greater ASN90 drug trough levels.
Figure 3
Figure 3
Pharmacodynamic response in P301S tau mice after 4 days of dosing with ASN90. ASN90 was orally administrated for 4 days at 100 mg/kg/day, and brain protein O-GlcNAcylation (A), O-tau (B), and tau phosphorylation at position Ser202/Thr205 (AT8) (C), Ser396 (D), and Ser356 (E) were quantified in the soluble cortex fraction of the animals at 4, 8, and 24 h after administration of the last dose. Corresponding plasma drug levels were 10,036 ng/mL (4 h), 2275 ng/mL (8 h), and 28 ng/mL (24 h). Data are displayed as mean +/– SEM after normalization to total tau levels (*p < 0.05 vs vehicle; **p < 0.01 vs vehicle; ****p < 0.0001 vs vehicle; one-way ANOVA followed by Dunnett’s post hoc test, n = 6/group).
Figure 4
Figure 4
Chronic treatment (3.5 months) with ASN90 reduced NFT-like pathology in transgenic P301S tau mice. NFT-like pathology (positive neurons/mm2) present in the dentate gyrus (granular cell layer) was quantified by immunohistochemistry (IHC) with phospho-tau antibodies AT100 (A) and AT8 (C) and by using standard Gallyas silver staining (E). Representative images of NFT-like pathology determined by AT100 and AT8 IHC and by Gallyas silver staining are shown in panels (B), (D), and (F), respectively. Data are displayed as mean +/– SEM (*p < 0.05 vs vehicle; ***p < 0.001 vs vehicle ****p < 0.0001 vs vehicle; one-way ANOVA followed by Dunnett’s post hoc test). Scale bar: 50 μm.
Figure 5
Figure 5
Acute treatment with ASN90 improves breathing function, and chronic treatment provides functional and survival benefits in P301L tau transgenic mice. (A) ASN90 significantly improved upper airway dysfunction in 7 month old P301L tau Tg mice as illustrated by a significant increase in the Tiffeneau index (FEV0.2/FVC), at 30 and 100 mg/kg/day ASN90 compared to vehicle-treated animals. Data are displayed as mean +/– SEM (*p < 0.05 vs vehicle; one-way ANOVA followed by Dunnett’s post hoc). (B) Tau O-GlcNAcylation (O-tau) in the same P301L mice treated for 4 days (steady state) with 30 and 100 mg/kg ASN90. Data are displayed as mean +/– SEM after normalization to total tau (*p < 0.05 versus vehicle; ****p < 0.0001 versus vehicle; non-parametric Kruskal–Wallis followed by Dunn’s post hoc test). Please note that the brains were collected at t = 2.5 h, which is earlier than the standard time point for PK studies (t = 4 h). (C) Evolution of weekly clasping scores throughout chronic ASN90 treatment per treatment group. An age-related increase in the clasping score in relation to known pathology progression was observed (p < 0.0001). A significant decrease in the clasping score was demonstrated in the ASN90 30 mg/kg/day treatment versus the vehicle group by Dunnett’s post-hoc test at ages of 8.19, 8.42, and 8.65 months (p = 0.0248, 0.0265, and 0.0274, respectively). The data represent the average clasping scores per week and are displayed as means +/– SEM (*p < 0.05 vs vehicle; two-way repeated measure ANOVA followed by Dunnett’s multiple comparison post hoc test). (D) Kaplan–Meier survival curves after chronic treatment of hTauP301L mice with ASN90. Vertical dotted lines illustrate interim survival analyses performed at 8.5 and 9.2 months of age, and results are displayed in Table S4. Treatment effects on survival rates (%) were demonstrated between ASN90 treatment (30 and 100 mg/kg/day) and vehicle groups using a log-rank (Mantel–Cox) test. (E) Tau O-GlcNAcylation (O-tau) in P301L mice (midbrain) treated for 6 months with 30 and 100 mg/kg ASN90. Data are displayed as mean +/– SEM after normalization to total tau levels (****p < 0.0001 versus vehicle; non-parametric Kruskal–Wallis followed by Dunn’s post hoc test; +p = 0.015 versus vehicle; unpaired t test).
Figure 6
Figure 6
Beneficial effects of ASN90 treatment on locomotor activity of Line 61 α-synuclein transgenic mice. (A–C) Locomotor function of Line 61 mice treated with 30 and 100 mg/kg/day ASN90 was evaluated by using beam walk tests at baseline (pre-dose) and after 12 and 24 weeks of treatment. Each graph displays the number of slips [n] per group evaluated on three different types of beam (trials A, B, and C). Data are displayed as a bar graph of mean +/– SEM (n values in each column reflect the number of mice willing to traverse the beam in each trial). For statistical analysis, vehicle-treated wild-type animals and ASN90-treated Line 61 (30 and 100 mg/kg/day) were compared to the vehicle-treated Line 61 group using mixed-effect analysis followed by Bonferroni’s multiple comparison test. (*p < 0.05; **p < 0.01; ***p < 0.001).
Figure 7
Figure 7
Reduction of astrogliosis in ASN90-treated Line 61 mice. Representative images of brain sagittal sections of (A) vehicle-treated wild-type mice, (B) vehicle-treated Line 61 mice, and (C) 30 mg/kg ASN90 and (D) 100 mg/kg ASN90-treated Line 61 mice. Enhanced astrogliosis (GFAP immunofluorescence) is seen in the cerebral isocortex of Line 61 mice and reduced by ASN90 treatment. Nuclei are labeled using DAPI counterstaining. Single-channel magnifications show the region indicated by the rectangle in the overview image. (E) Biochemical quantification of astrogliosis using a GFAP immunoassay reveals a dose-dependent reduction in the cortex soluble-fraction from Line 61 mice upon ASN90 treatment. Data are displayed as mean +/– SEM (**p < 0.01, ***p < 0.001 vs Tg Line 61 vehicle group, one-way ANOVA followed by the Holm–Sidak post hoc test).
Figure 8
Figure 8
ASN90 increases total O-protein and O-GlcNAcylated α-synuclein. (A) A dose-dependent increase in global protein O-GlcNAcylation was detected in the brains of ASN90-treated Line 61 mice at 30 and 100 mg/kg/day. The data are expressed in % O-GlcNAcylation relative to the average signal obtained in the vehicle group and displayed as mean +/– SEM (***p < 0.001, ****p < 0.0001 vs vehicle, non-parametric Kruskal–Wallis followed by Dunn’s post hoc test). (B) Western blot immunostaining of α-synuclein after chemoenzymatic mass tagging. Note the increased staining of an additional α-synuclein band at higher molecular mass (approximately 30 kDa) in the presence of GalT1(Y289L) in the samples. The unmodified α-synuclein band at 15 kDa serves as internal reference. (C, D) Densitometric analysis of α-synuclein O-GlcNAcylation in ASN90-treated Line 61 mice. (C) The ratio of the 30 kDa/15 kDa α-synuclein bands reveals a 2-fold increase in O-GlcNAcylated α-synuclein migrating at 30 kDa in the brains of 100 mg/kg ASN90-treated Line 61 mice as compared to vehicle control animals. Data are expressed as % of the signal obtained in the vehicle group and displayed as mean +/– SEM (**p = 0.0041, Mann–Whitney test). (D) Expressing O-GlcNAcylated α-synuclein as % of total α-synuclein (total α-synuclein represented by the combined immunoreactivities of the 15 and 30 kDa α-synuclein bands) showed that, in vehicle-treated animals, 20% of α-synuclein is O-GlcNAcylated, which raises to 34% upon chronic treatment with ASN90 [1.7-fold increase in good agreement with panel (C)]. Data are expressed as % of total α-synuclein and displayed as mean +/– SEM (**p = 0.0041, Mann–Whitney test). Samples from seven mice of each group were randomly chosen for chemoenzymatic mass tagging and the subsequent quantifications shown in panels (C, D).

Similar articles

Cited by

References

    1. Torres C. R.; Hart G. W. Topography and polypeptide distribution of terminal N-acetylglucosamine residues on the surfaces of intact lymphocytes. Evidence for O-linked GlcNAc. J. Biol. Chem. 1984, 259, 3308–3317. 10.1016/S0021-9258(17)43295-9. - DOI - PubMed
    1. Haltiwanger R. S.; Holt G. D.; Hart G. W. Enzymatic addition of O-GlcNAc to nuclear and cytoplasmic proteins. Identification of a uridine diphospho-N-acetylglucosamine:peptide beta-N-acetylglucosaminyltransferase. J. Biol. Chem. 1990, 265, 2563–2568. 10.1016/S0021-9258(19)39838-2. - DOI - PubMed
    1. Dong D. L.; Hart G. W. Purification and characterization of an O-GlcNAc selective N-acetyl-beta-D-glucosaminidase from rat spleen cytosol. J Biol Chem 1994, 269, 19321–19330. 10.1016/S0021-9258(17)32170-1. - DOI - PubMed
    1. Pinho T. S.; Verde D. M.; Correia S. C.; Cardoso S. M.; Moreira P. I. O-GlcNAcylation and neuronal energy status: Implications for Alzheimer’s disease. Ageing Res Rev 2018, 46, 32–41. 10.1016/j.arr.2018.05.003. - DOI - PubMed
    1. Sánchez R. G.; Parrish R. R.; Rich M.; Webb W. M.; Lockhart R. M.; Nakao K.; Ianov L.; Buckingham S. C.; Broadwater D. R.; Jenkins A.; de Lanerolle N. C.; Cunningham M.; Eid T.; Riley K.; Lubin F. D. Human and rodent temporal lobe epilepsy is characterized by changes in O-GlcNAc homeostasis that can be reversed to dampen epileptiform activity. Neurobiol Dis 2019, 124, 531–543. 10.1016/j.nbd.2019.01.001. - DOI - PMC - PubMed

Publication types