. 2022 Apr;376(6588):eabl4178.
doi: 10.1126/science.abl4178. Epub 2022 Apr 1.

Complete genomic and epigenetic maps of human centromeres

Nicolas Altemose  1 Glennis A Logsdon #  2 Andrey V Bzikadze #  3 Pragya Sidhwani #  4 Sasha A Langley #  1 Gina V Caldas #  1 Savannah J Hoyt  5   6 Lev Uralsky  7   8 Fedor D Ryabov  9 Colin J Shew  10 Michael E G Sauria  11 Matthew Borchers  12 Ariel Gershman  13 Alla Mikheenko  14 Valery A Shepelev  8 Tatiana Dvorkina  14 Olga Kunyavskaya  14 Mitchell R Vollger  2 Arang Rhie  15 Ann M McCartney  15 Mobin Asri  16 Ryan Lorig-Roach  16 Kishwar Shafin  16 Julian K Lucas  16 Sergey Aganezov  17 Daniel Olson  18 Leonardo Gomes de Lima  12 Tamara Potapova  12 Gabrielle A Hartley  5   6 Marina Haukness  16 Peter Kerpedjiev  19 Fedor Gusev  8 Kristof Tigyi  16   20 Shelise Brooks  21 Alice Young  21 Sergey Nurk  15 Sergey Koren  15 Sofie R Salama  16   20 Benedict Paten  16   22 Evgeny I Rogaev  7   8   23   24 Aaron Streets  25   26 Gary H Karpen  1   27 Abby F Dernburg  1   20   28 Beth A Sullivan  29 Aaron F Straight  4 Travis J Wheeler  18 Jennifer L Gerton  12   30 Evan E Eichler  2   20 Adam M Phillippy  15 Winston Timp  13   31 Megan Y Dennis  10 Rachel J O'Neill  5   6 Justin M Zook  32 Michael C Schatz  17 Pavel A Pevzner  33 Mark Diekhans  16 Charles H Langley  34 Ivan A Alexandrov  8   14   35 Karen H Miga  16   22
Affiliations

Complete genomic and epigenetic maps of human centromeres

Nicolas Altemose et al. Science. 2022 Apr.

Abstract

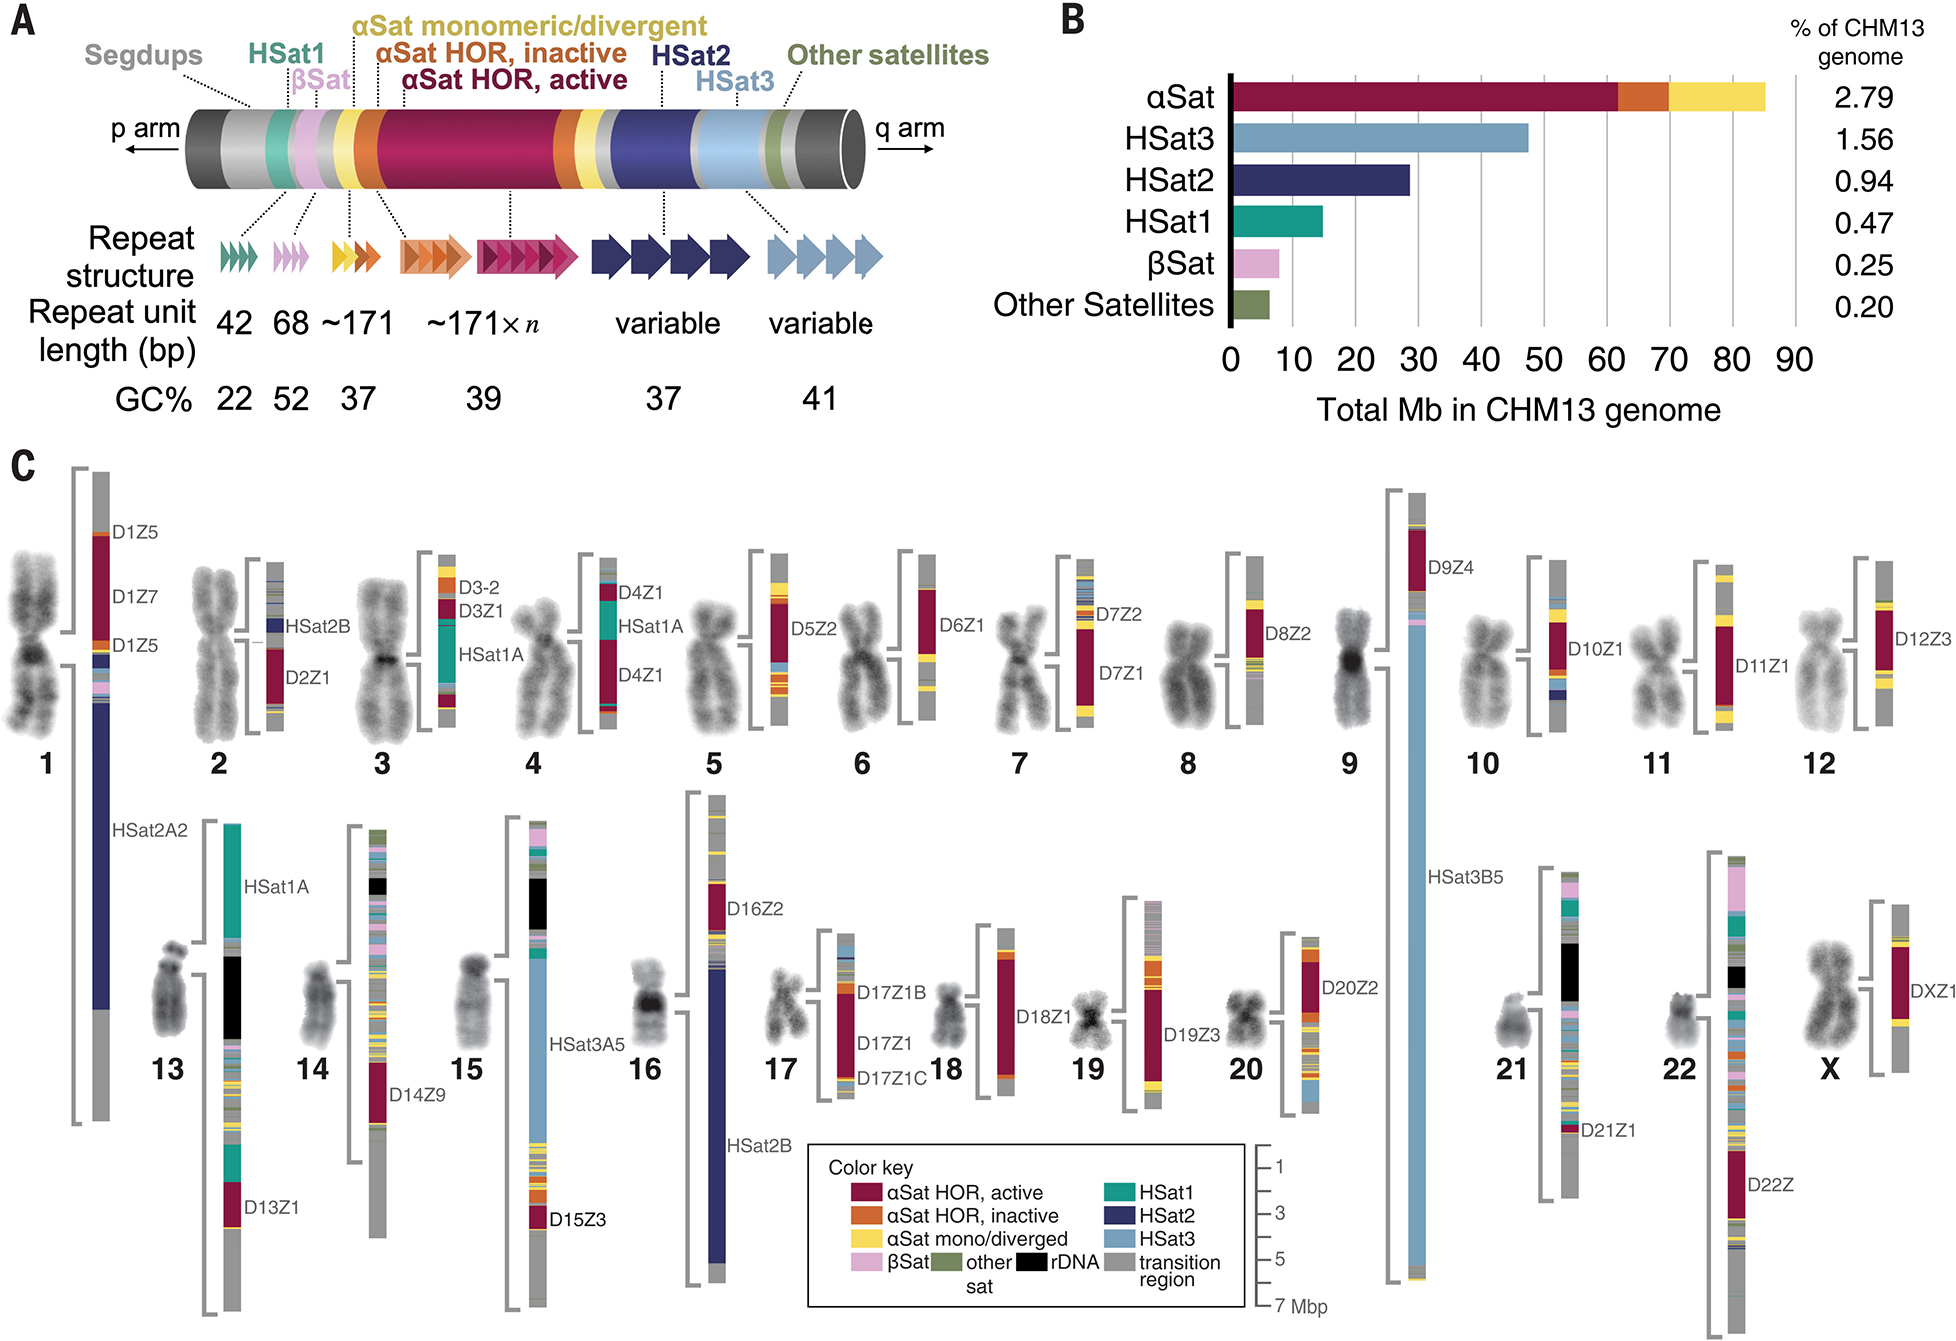
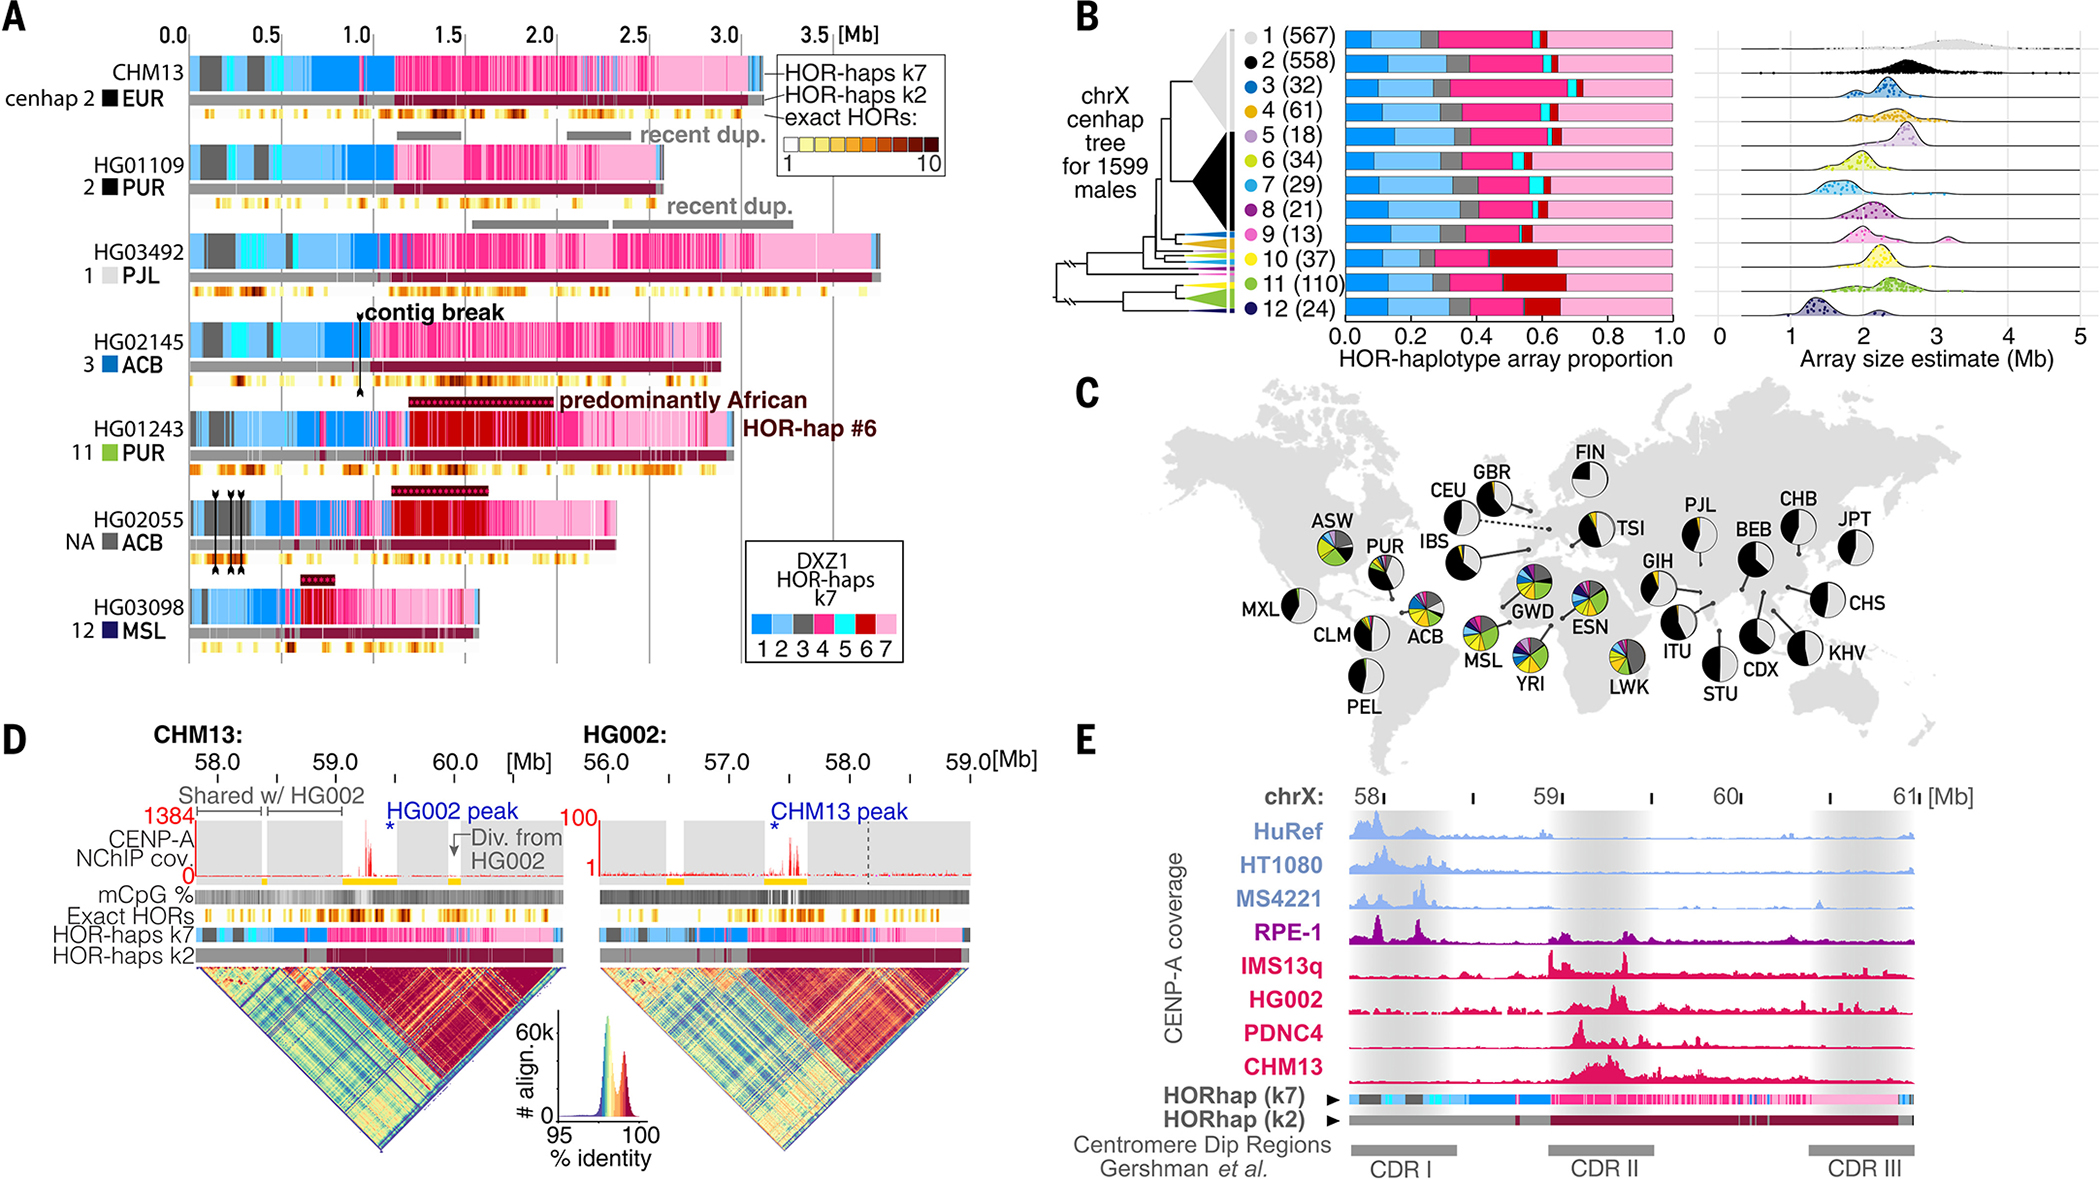
Existing human genome assemblies have almost entirely excluded repetitive sequences within and near centromeres, limiting our understanding of their organization, evolution, and functions, which include facilitating proper chromosome segregation. Now, a complete, telomere-to-telomere human genome assembly (T2T-CHM13) has enabled us to comprehensively characterize pericentromeric and centromeric repeats, which constitute 6.2% of the genome (189.9 megabases). Detailed maps of these regions revealed multimegabase structural rearrangements, including in active centromeric repeat arrays. Analysis of centromere-associated sequences uncovered a strong relationship between the position of the centromere and the evolution of the surrounding DNA through layered repeat expansions. Furthermore, comparisons of chromosome X centromeres across a diverse panel of individuals illuminated high degrees of structural, epigenetic, and sequence variation in these complex and rapidly evolving regions.


Conflict of interest statement

Competing interests: S.K. and K.H.M. have received travel funds to speak at symposia organized by Oxford Nanopore Technologies. W.T. has two patents (,748,091 and 8,394,584) licensed to Oxford Nanopore Technologies. S.A. is an employee of Oxford Nanopore Technologies. P.K. owns and receives income from Reservoir Genomics. E.E.E. is a scientific advisory board (SAB) member of Variant Bio. K.H.M. is a SAB member of Centaura. No other competing interests are declared from other authors.

Figures

Fig. 1.
Fig. 1.. Overview of all peri/centromeric regions in CHM13.
(A) Schematic of a generalized human peri/centromeric region, identifying major sequence components and their properties (not to scale). HSat2,3 repeat unit lengths vary by genomic region. (B) Barplots of the total lengths of each major satellite family genome-wide. (C) Micrographs of representative 4′,6-diamidino-2-phenylindole (DAPI)–stained chromosomes from CHM13 metaphase spreads, next to a color-coded map of peri/centromeric satellite DNA arrays [available as a browser track (database S1)]. Large satellite arrays are labeled.
Fig. 2.
Fig. 2.. Structural rearrangements, genes, and TEs in peri/centromeric regions.
(A) The peri/centromeric region of chr1 (cylindrical schematic at top), zooming into the transition region between the large αSat and HSat2 arrays (tracks 1 to 4). Track 1, satellite families (color key at bottom left), with vertical placement indicating the strand with canonical satellite repeat polarity. Track 2, positions of TEs overlapping αSat or HSat1,2,3, colored by TE type. Track 3, annotated transcription start sites, colored by gene type. Track 4, HSat2,3 subfamily assignments [as in (11)] and αSat SF assignments, with large arrays labeled. (B) As in (A) but for chr17, with the previously unresolved HSat3B1 array indicated with an asterisk. (C) Gene annotations between the αSat and HSat3 arrays on chr17. (D) Heatmap showing the major and minor localizations of each αSat HOR SF (top; red) and each HSat2,3 subfamily (bottom; blue). “N” indicates localizations not described in (11). Dash “–” indicates the chr1 HSat3B2 array deleted in CHM13. HSat3A3 and 3A6 are predominantly found on chrY (not in CHM13). (E) Barplots illustrate the number of inversion breakpoints (strand switches) or the number and type of TEs detected per megabase within different satellite families. div, divergent αSat (dHORs + monomeric).
Fig. 3.
Fig. 3.. Genome-wide evidence of layered expansions in centromeric αSat arrays.
(A) (Top) HOR structural variant positions across the active αSat arrays on chr7 and chr10 (gray, canonical HORs; other colors, structural variants). (Bottom) Percentages of HOR structural variant types on HiFi sequencing reads from 16 HPRC cell lines. Variant nomenclature is described in (42); canonical HOR percentages are listed on the plot. (B) Repeat periodicities identified with NTRprism for the HSat3B1 array on chr17. (C) Comparison of the age and divergence of LINE TEs embedded in different αSat SF layers. (D) (i) Four centromeres in which an active HOR array of distinct origin appears to have expanded within a now-inactive HOR array. (ii) and (iii) Monomeric SFs (rainbow colors) surrounding active HOR arrays on eight chromosomes, with major HOR-haps shown (k = 2 to 3). Red, younger, emphasized below with red rectangles; gray, older, emphasized below with asterisks. (E) Zoomed-in view of chr3 αSat HOR arrays, divided into finer symmetrical HOR-haps (k = 7). (F) (Left) Minimum evolution tree showing the phylogenetic relationships between all HORs, colored by fine (k = 7) HOR-hap assignments. Red and gray ellipses group major HOR-hap divisions into younger and older variants, respectively (42). (Right) Phylogenetic tree built from HOR-hap consensus sequences derived from branches in the left tree, rooted with a reconstructed ancestral cen3 active HOR sequence (ANC) (42). Branch lengths indicate base substitutions per position.
Fig. 4.
Fig. 4.. Inner kinetochore associates with recently expanded αSat HORs.
(A) Active αSat HOR array on chr12 (coordinates at top). Track 1, CENP-A NChIP-seq marker-assisted mapping coverage. Track 2, reference-free region-specific marker enrichment (black indicates no markers in bin) (42). Track 3, percent of CpG sites methylated. Tracks 4 and 5, HOR-haps (k = 5 or 2 clusters, respectively). Track 6, number of HOR units (out of 10 per bin) that have at least one identical copy in the array. (Bottom) Self-alignment dotplot (exact-match word size 2000), with arrows pointing to a zone of recent duplication. (Inset) Smaller dotplot of the entire array (word size 500, allowing for detection of older duplications), with positions of two large macro-repeats indicated with blue lines. (B) As in (A) but for chr4. (Inset) Highlighting of a secondary CENP-A enrichment site and minor CDR on the other side of the interrupting HSat1A array. (C) As in (A) but for chr6, with CENP-A enrichment over an older HOR-hap region. (D) Rooted HOR-hap consensus phylogenetic trees as in Fig. 3F, with CENP-A–enriched region(s) indicated with arrows.
Fig. 5.
Fig. 5.. Substantial genetic and epigenetic variation in and around the chrX centromere.
(A) Comparing the active αSat HOR array on chrX (DXZ1) between (top) CHM13 and six HPRC cell line HiFi read assemblies. Tracks indicate HOR-haps (top, k = 7; bottom, k = 2) and recent HOR duplication events (bottom, as in Fig. 4A). (B) (Left) Phylogenetic tree illustrating the relationships of 12 cenhaps defined by using short-read data from 1599 XY genomes from (70, 73) plus HG002, CHM13, and HuRef. Triangle vertical length is proportional to the number of individuals in that cenhap (98 individuals, labeled NA and colored dark gray, belong to small clades not among the 12 major cenhaps). (Middle) Barplots illustrating the average HOR-hap compositions for all individuals within each cenhap, colored as in (A). (Right) Ridgeline plots indicating the distribution of estimated total array sizes for all individuals within each cenhap, with individual values represented as jittered points. (C) Populations represented among the 1599 XY genomes, with pie charts indicating the proportion of cenhap assignments within each population, with the same colors used as in the tree in (B). Population descriptions are in (42). (D) Comparison of the DXZ1 assembly for CHM13 and HG002, which are both in cenhap 2. Tracks are as in (A), with the addition of a top track to indicate regions that align closely (gray) or are diverged (yellow) between the two individuals. Vertical dotted line indicates the homologous site of a CHM13 expansion on the HG002 array. (Bottom) StainedGlass dotplots representing the percent identity of self-alignments within the array, with a color-key and histogram below (88). (E) A comparison of CENP-A coverage (NChIP-seq or CUT&RUN) in eight cell lines relative to the CHM13 chrX centromere assembly. Each track is normalized to its maximum peak height in the array. Below are CDR positions from (26).

Comment in

References

    1. Eichler EE, Clark RA, She X, An assessment of the sequence gaps: Unfinished business in a finished human genome. Nat. Rev. Genet. 5, 345–354 (2004). doi: 10.1038/nrg1322 - DOI - PubMed
    1. Nurk S et al., The complete sequence of a human genome. Science 376, 44 (2022). - PMC - PubMed
    1. Miga KH, Completing the human genome: The progress and challenge of satellite DNA assembly. Chromosome Res. 23, 421–426 (2015). doi: 10.1007/s10577-015-9488-2 - DOI - PubMed
    1. McKinley KL, Cheeseman IM, The molecular basis for centromere identity and function. Nat. Rev. Mol. Cell Biol. 17, 16–29 (2016). doi: 10.1038/nrm.2015.5 - DOI - PMC - PubMed
    1. Wevrick R, Willard HF, Physical map of the centromeric region of human chromosome 7: Relationship between two distinct alpha satellite arrays. Nucleic Acids Res. 19, 2295–2301 (1991). doi: 10.1093/nar/19.9.2295 - DOI - PMC - PubMed

Publication types

Grants and funding