. 2022 Apr;376(6588):eabj5089.
doi: 10.1126/science.abj5089. Epub 2022 Apr 1.

Epigenetic patterns in a complete human genome

Affiliations

Epigenetic patterns in a complete human genome

Ariel Gershman et al. Science. 2022 Apr.

Abstract

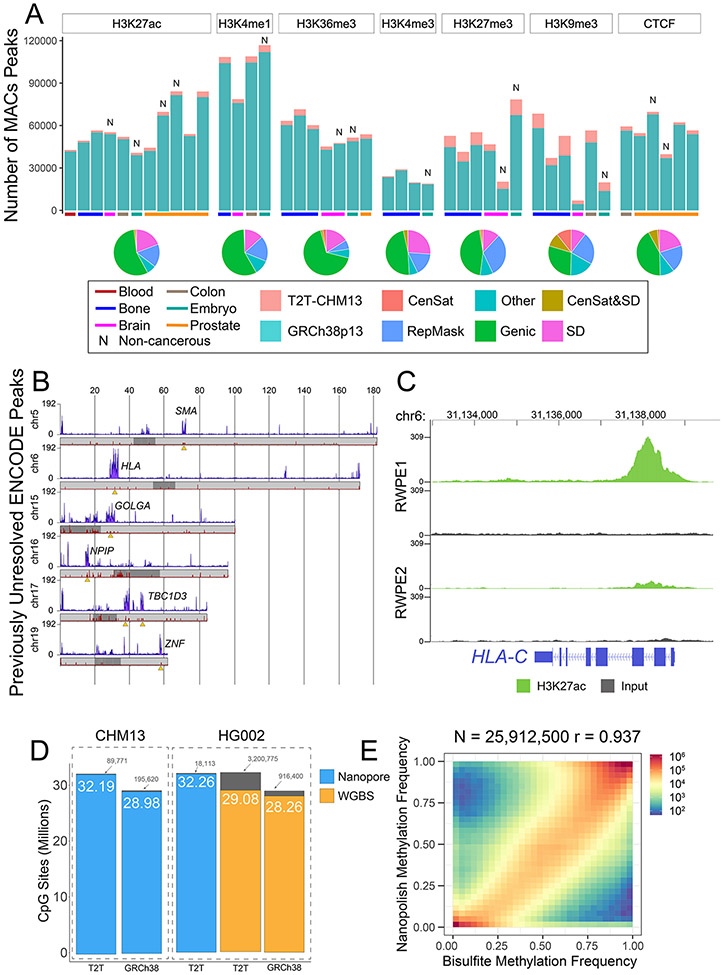
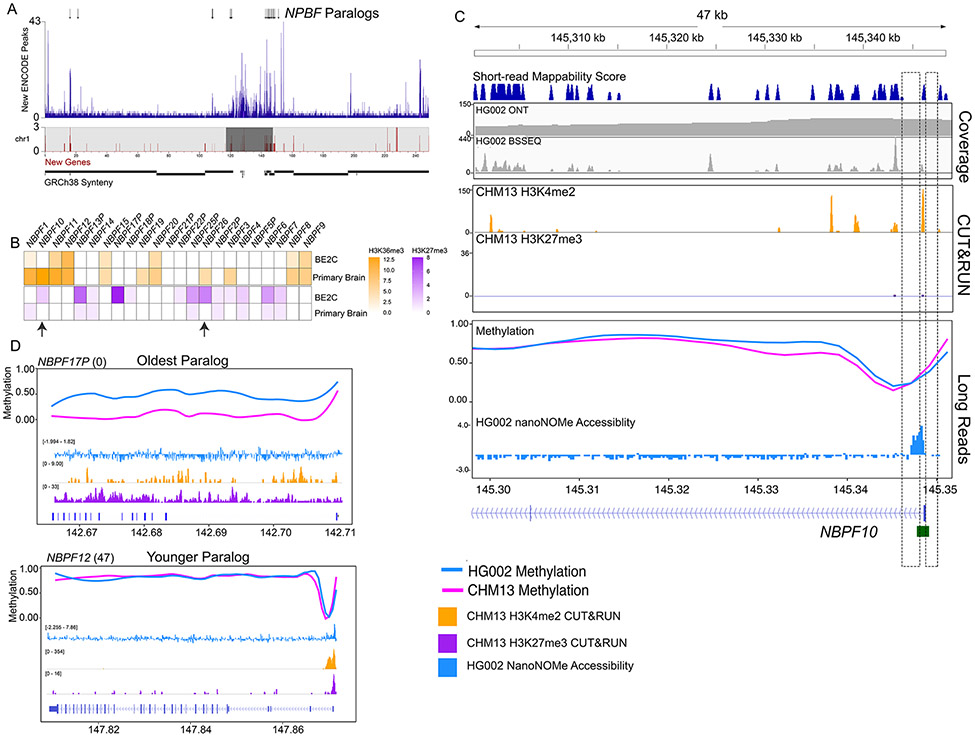
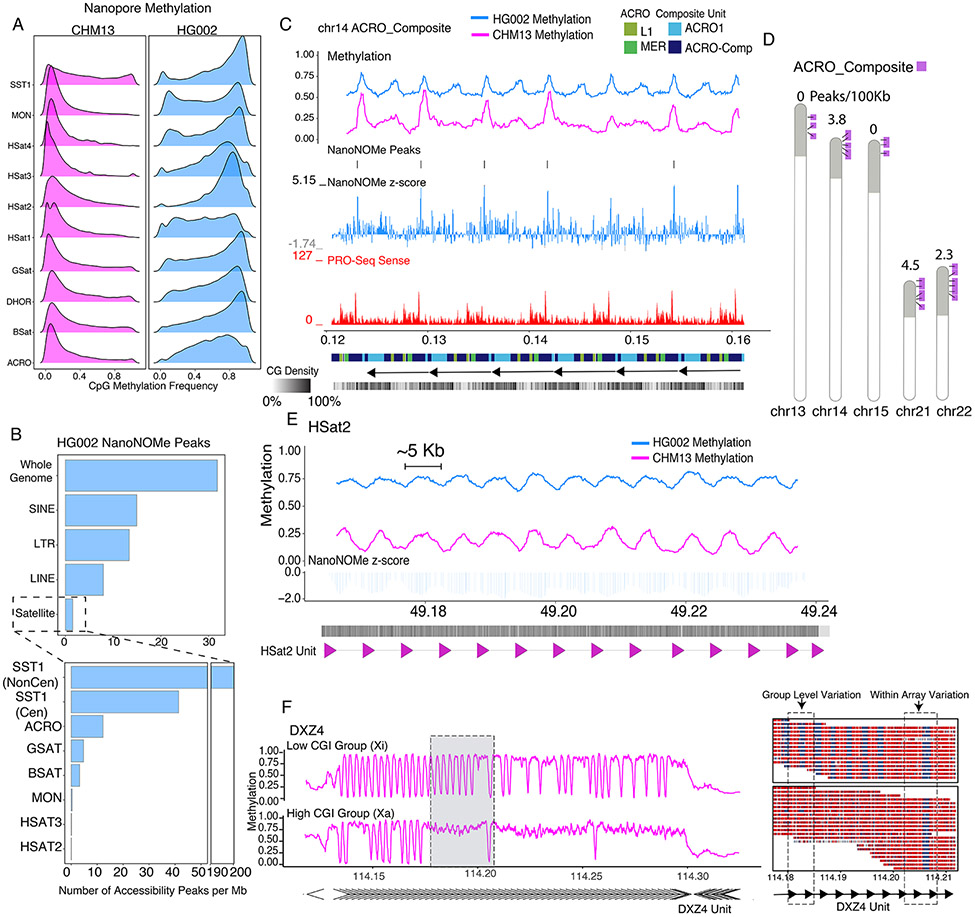
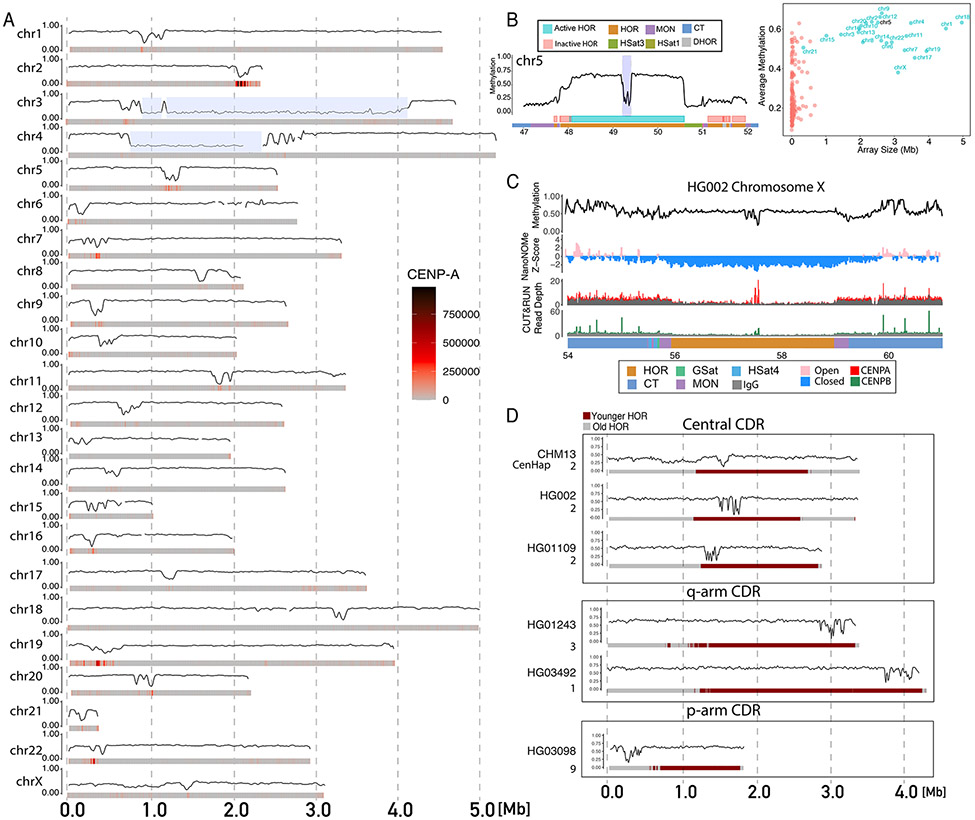
The completion of a telomere-to-telomere human reference genome, T2T-CHM13, has resolved complex regions of the genome, including repetitive and homologous regions. Here, we present a high-resolution epigenetic study of previously unresolved sequences, representing entire acrocentric chromosome short arms, gene family expansions, and a diverse collection of repeat classes. This resource precisely maps CpG methylation (32.28 million CpGs), DNA accessibility, and short-read datasets (166,058 previously unresolved chromatin immunoprecipitation sequencing peaks) to provide evidence of activity across previously unidentified or corrected genes and reveals clinically relevant paralog-specific regulation. Probing CpG methylation across human centromeres from six diverse individuals generated an estimate of variability in kinetochore localization. This analysis provides a framework with which to investigate the most elusive regions of the human genome, granting insights into epigenetic regulation.


Figures

Figure 1.
Figure 1.. Epigenetics in previously unresolved genome regions.
A) (Top) Bar plots of the number of peaks called per ENCODE sample using dynamic k-mer mapping to GRCh38 (blue) or T2T-CHM13 (salmon). (Bottom) Pie charts indicating the genomic localization of peaks found only in T2T-CHM13. B) Number of T2T-CHM13 unique ENCODE peaks across chromosomes 5, 6, 15, 16, 17, and 19 in 50kb bins (purple). Chromosome ideograms show the density of previously unannotated genes (red) with the centromere annotated as dark gray. Orange triangles denote regions of interest with a high density of previously uncalled peaks. C) ENCODE ChIP-seq read coverage at the HLA-C gene locus on chromosome 6. D) Number of CpGs with methylation profiled comparing sequencing method and reference assembly. E) Correlation of HG002 WGBS and Nanopolish methylation calls aligned to T2T-CHM13.
Figure 2.
Figure 2.. Paralog specific epigenetic regulation of the NBPF gene family.
A) Location of T2T-CHM13 previously uncalled ENCODE peaks across chromosome 1 in 50kb bins (purple). Chromosome ideograms contain the density of previously unannotated genes (red) and centromere annotations (dark gray). NBPF paralogs are indicated by black arrows (top) B) Heatmap illustrating number of peaks for H3K36me3 (orange) and H3K27me3 (purple) per NBPF paralog in ENCODE cell line BE2C (neuroblastoma) and brain tissue (Primary Brain Microvascular Tissue). Arrows indicate NBPF10 and NBPF26. C) Epigenetic data at the NBPF10 promoter and first intron (chr1:145,300,425-145,348,763). Short-read mappability score from 0-200 calculated as a 200bp region with a score of 200 being the most mappable and 0 being the least mappable. Coverage tracks (Illumina WGBS and ONT) and CUT&RUN tracks display read pileups. Long read methylation tracks show base-level methylation frequency with 0 as unmethylated and 1 as fully methylated. The long read HG002 accessibility track is a 200bp binned Z-score of nanoNOMe GpC methylation frequency. Dashed boxes highlight the promoter region which is largely unmappable with short-reads. D) (Top) Younger NBPF12 gene paralog displaying CHM13 and HG002 nanopore methylation, CHM13 H3K4me2 and H3K27me3 CUT&RUN coverage, and HG002 nanoNOMe. (Bottom) Older NBPF17P gene paralog displaying CHM13 and HG003 nanopore methylation, CHM13 H3K4me2 and H3K27me3 CUT&RUN, and HG002 nanoNOMe. Numbers in parenthesis refer to the number of PacBio Iso-seq transcripts mapped to this paralog.
Figure 3.
Figure 3.. Context specific epigenetics in high identity tandem repeats.
A) Nanopore methylation frequency of satellite repeat classes in CHM13 and HG002. B) HG002 NanoNOMe statistically significant peak calls(18) per 1Mb of sequence in all major repeat classes compared to the whole genome (Top) and within different satellite repeats (Bottom). C) Nanopore CpG Methylation profiles, HG002 NanoNOMe accessibility peaks and Z-score (negative is inaccessible, positive is accessible), and non-kmer filtered (multimapping) PRO-Seq coverage at the ACRO_Composite repeat (chr14:121,193-162,142). Annotation tracks below are the RepeatMasker V2 annotation from (44), monomeric annotations of the ACRO_Composites and a GC density track. D) Ideogram showing the arrayed locations of the ACRO_Composite across the acrocentric chromosomes (purple) within the acrocentric short arms (gray shaded). Listed above each chromosome is the nanoNOMe ACRO_composite peak density in peaks/100kb. E) Nanopore CpG Methylation profiles and HG002 NanoNOMe accessibility Z-score of the HSat2 repeat (chr16:49,163,529-49,239,753). Annotation bars below represent CpG density and HSat2 repeat units on the bottom. F) The DXZ4 locus on CHM13 clustered into two haplotypes (low CGI methylation and high CGI methylation), based solely on promoter methylation state. (Left) Methylation frequency plot of each haplotype. (Right) Single reads from the gray highlighted region on the left with boxes highlighting CGI cluster group level epigenetic variability and intra-array level epigenetic variable between neighboring monomeric units.
Figure 4:
Figure 4:. Epigenetic maps within human centromeres.
A) Smoothed methylation frequency in 10kb bins of the active HOR array for all CHM13 chromosomes. CENP-A enrichment from CUT&RUN data shown as a heatmap under each plot. Chromosomes 3 and 4 have a HSat1 repeat (blue highlight) that breaks up the live HOR array. B) (Left) CHM13 methylation in the centromeric region of chromosome 5. Smoothed methylation frequency is plotted in 10 kb bins. HOR arrays are annotated as blue (“active”) and pink (“inactive”). (Right) Scatter plot of average methylation within each HOR array versus size in Mbp. C) Methylation, nanoNOMe accessibility, CENP-A and CENP-B CUT&RUN data across the chromosome X centromeric array on HG002. Smoothed methylation and accessibility are plotted in 15kb bins, CUT&RUN is plotted as raw read counts with input shaded gray. Bottom bar annotates satellite regions indicating the location of the HOR, MON, GSat, HSat4 and CT regions. D) Methylation in the active HOR array across diverse individuals. Coriell cell line sample ID and cenhap group annotated to left. HORs are annotated as red (younger) and gray (older) computed on the basis of sequence divergence.

Comment in

References

    1. ENCODE Project Consortium, An integrated encyclopedia of DNA elements in the human genome. Nature. 489, 57–74 (2012). - PMC - PubMed
    1. Dekker J et al., The 4D nucleome project. Nature. 549, 219–226 (2017). - PMC - PubMed
    1. Roadmap Epigenomics Consortium et al., Integrative analysis of 111 reference human epigenomes. Nature. 518, 317–330 (2015). - PMC - PubMed
    1. Nurk S et al., The complete sequence of a human genome. bioRxiv (2021), p. 2021.05.26.445798.
    1. Jost D, Vaillant C, Epigenomics in 3D: importance of long-range spreading and specific interactions in epigenomic maintenance. Nucleic Acids Res. 46, 2252–2264 (2018). - PMC - PubMed

Publication types