. 2022 Apr;376(6588):eabk3112.
doi: 10.1126/science.abk3112. Epub 2022 Apr 1.

From telomere to telomere: The transcriptional and epigenetic state of human repeat elements

Affiliations

From telomere to telomere: The transcriptional and epigenetic state of human repeat elements

Savannah J Hoyt et al. Science. 2022 Apr.

Abstract

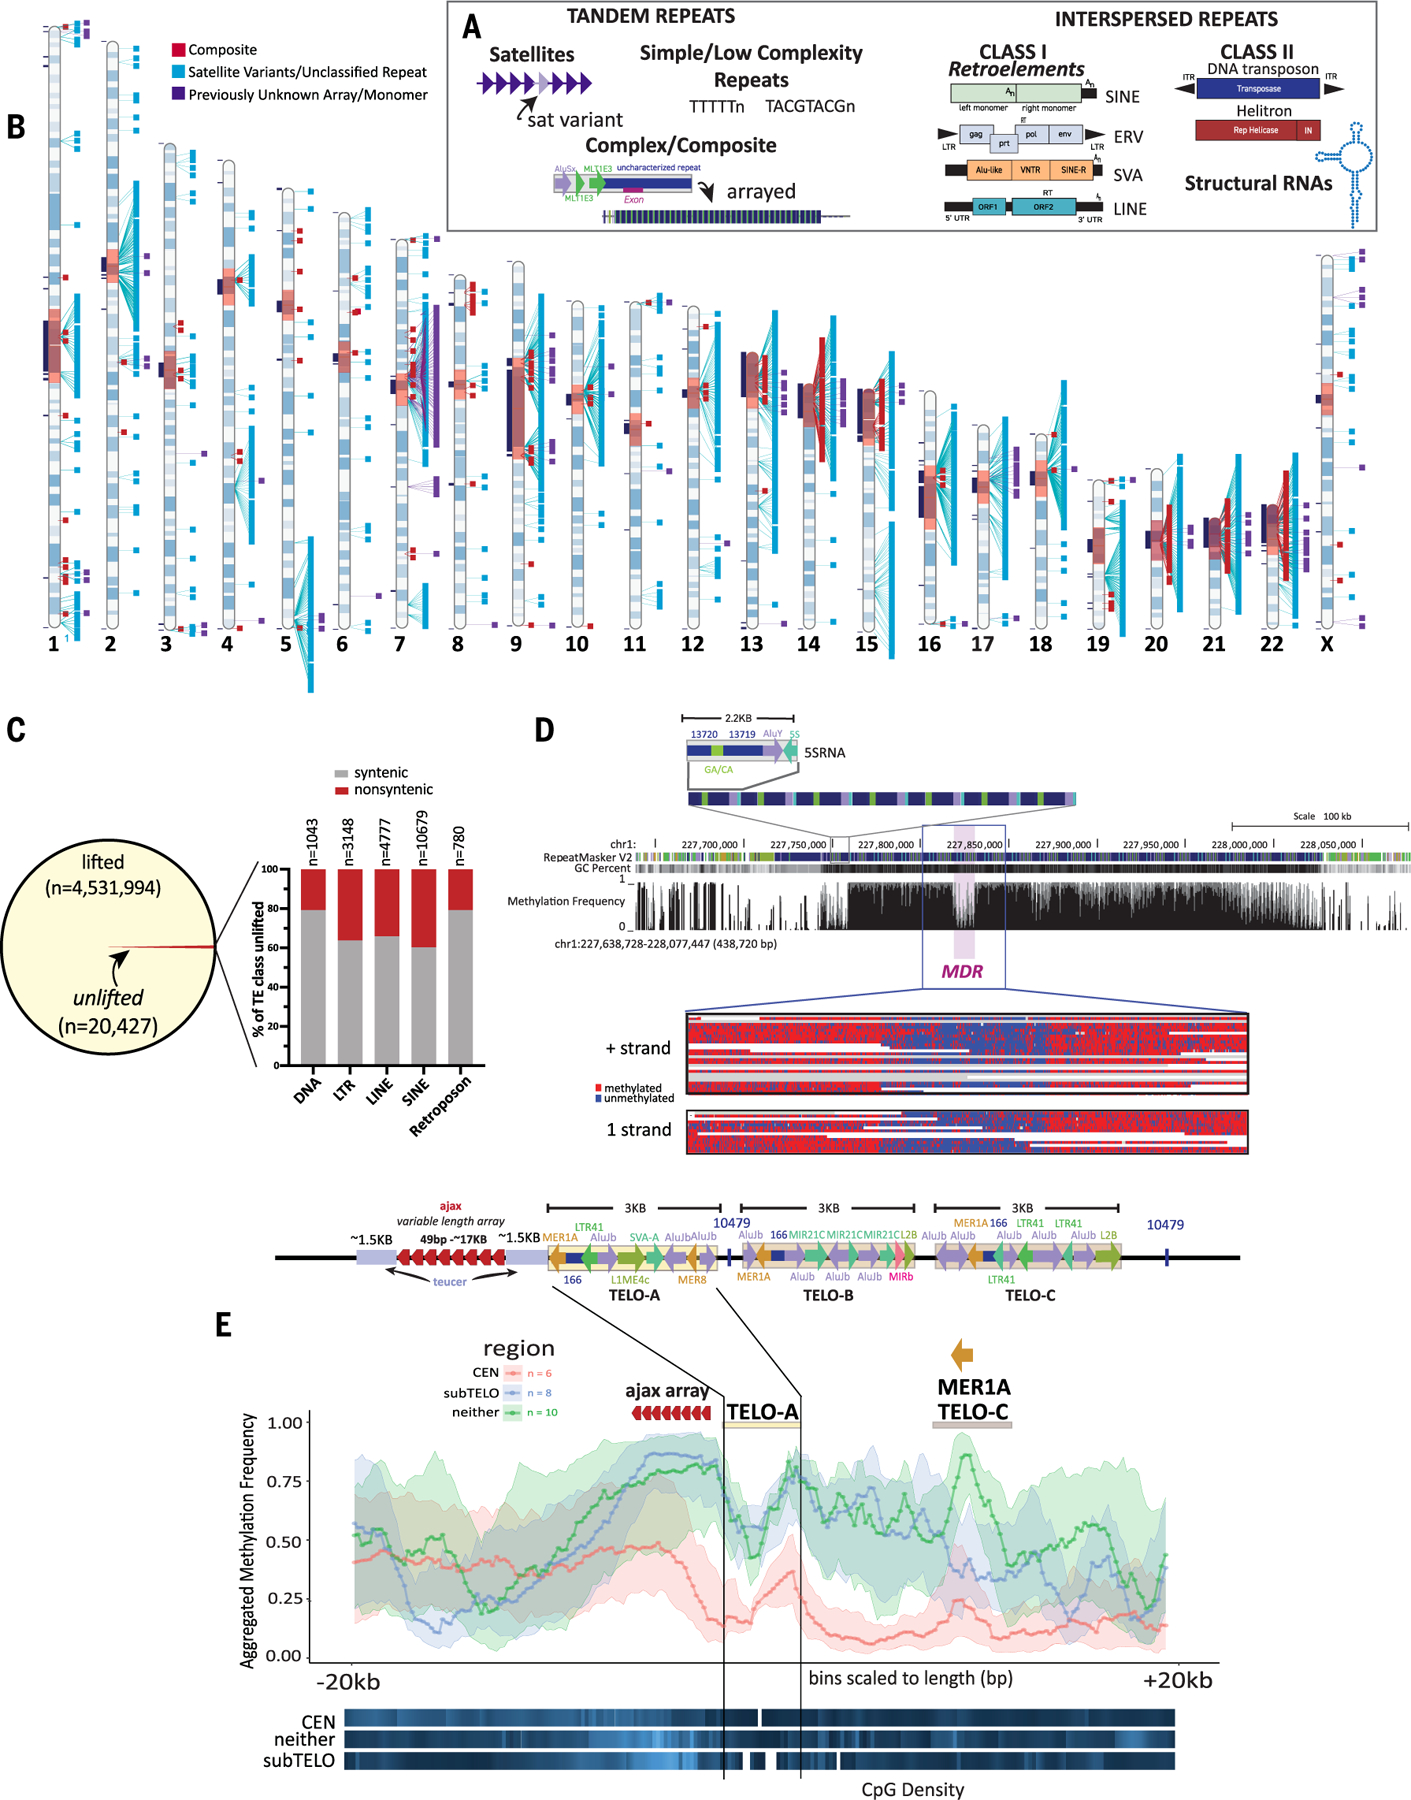
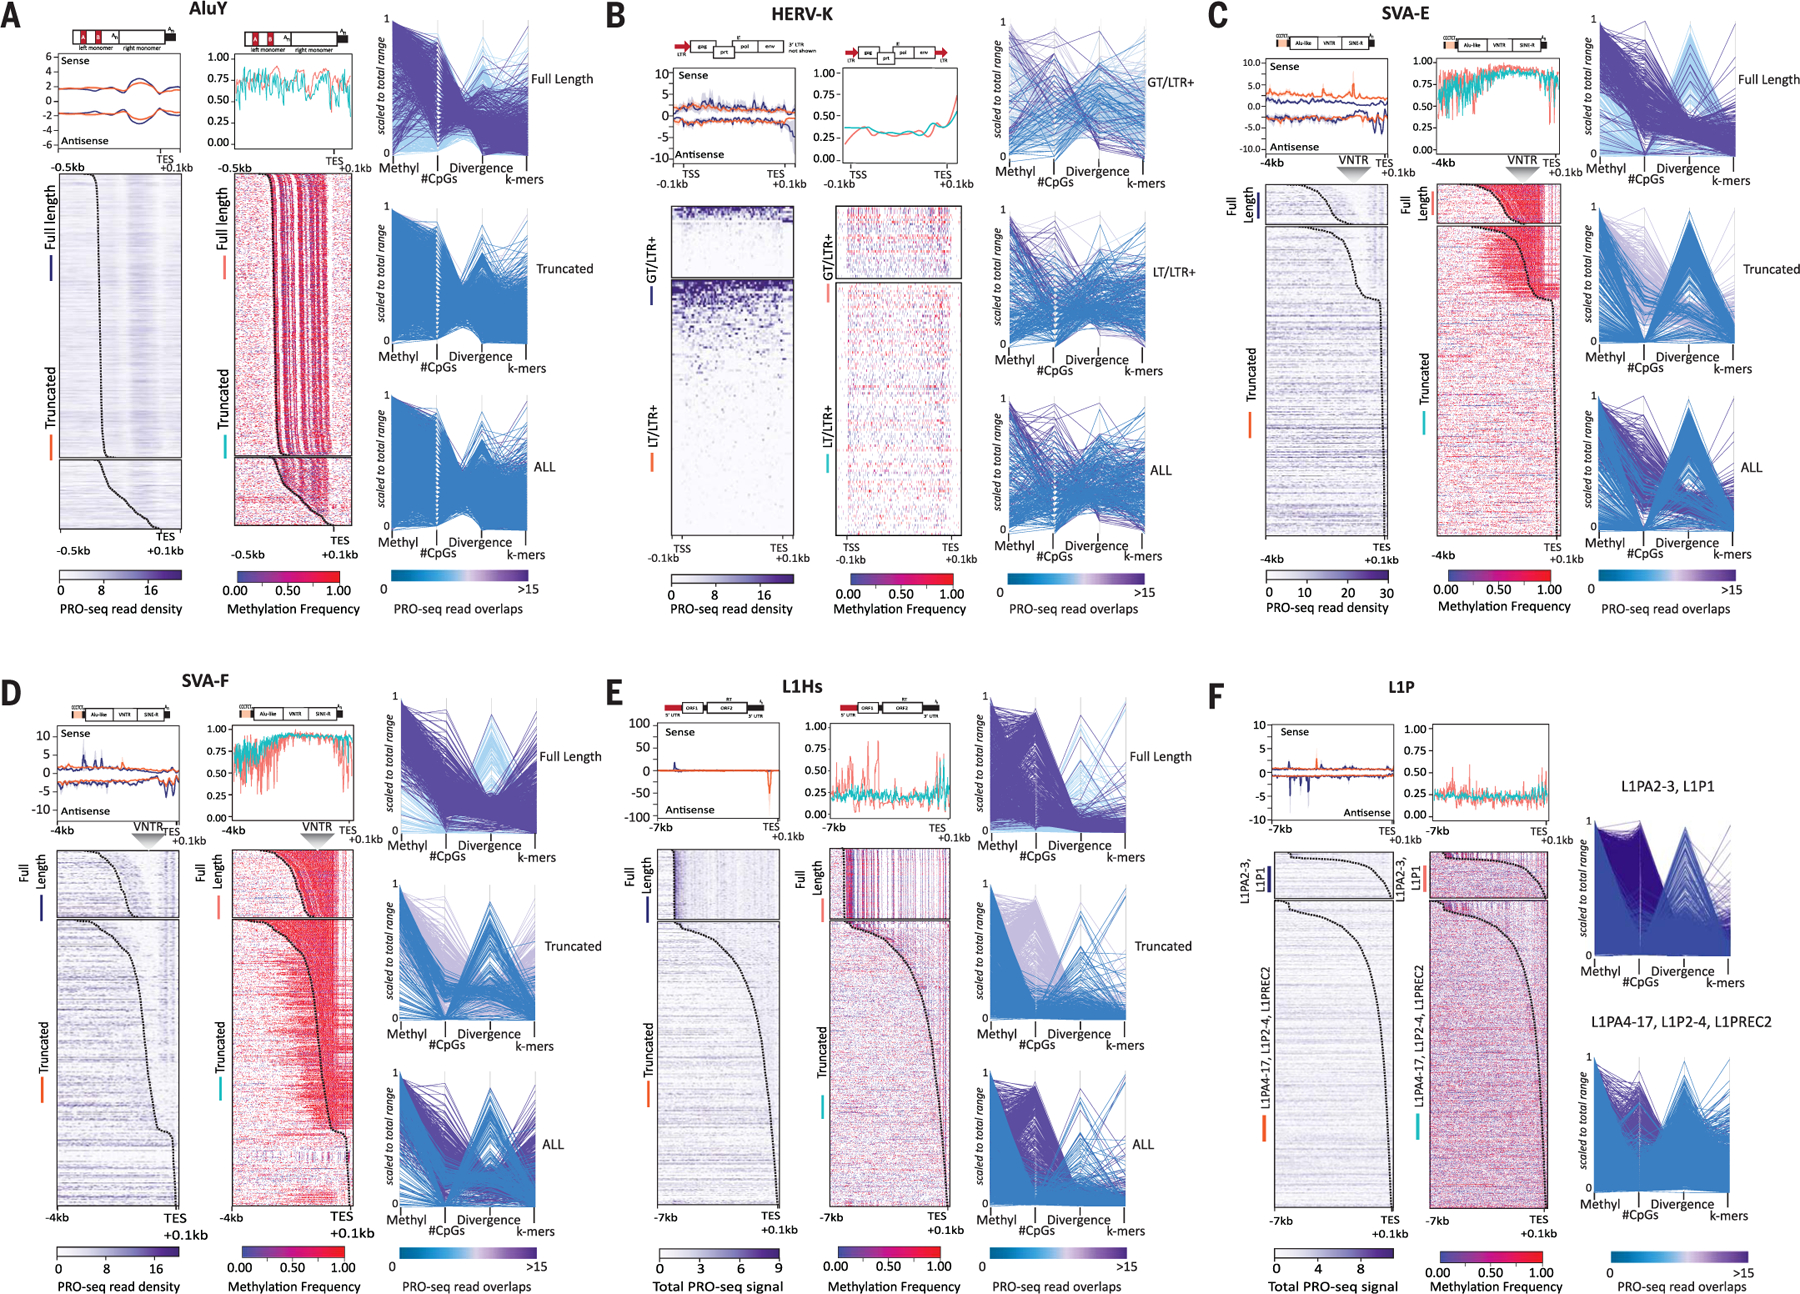
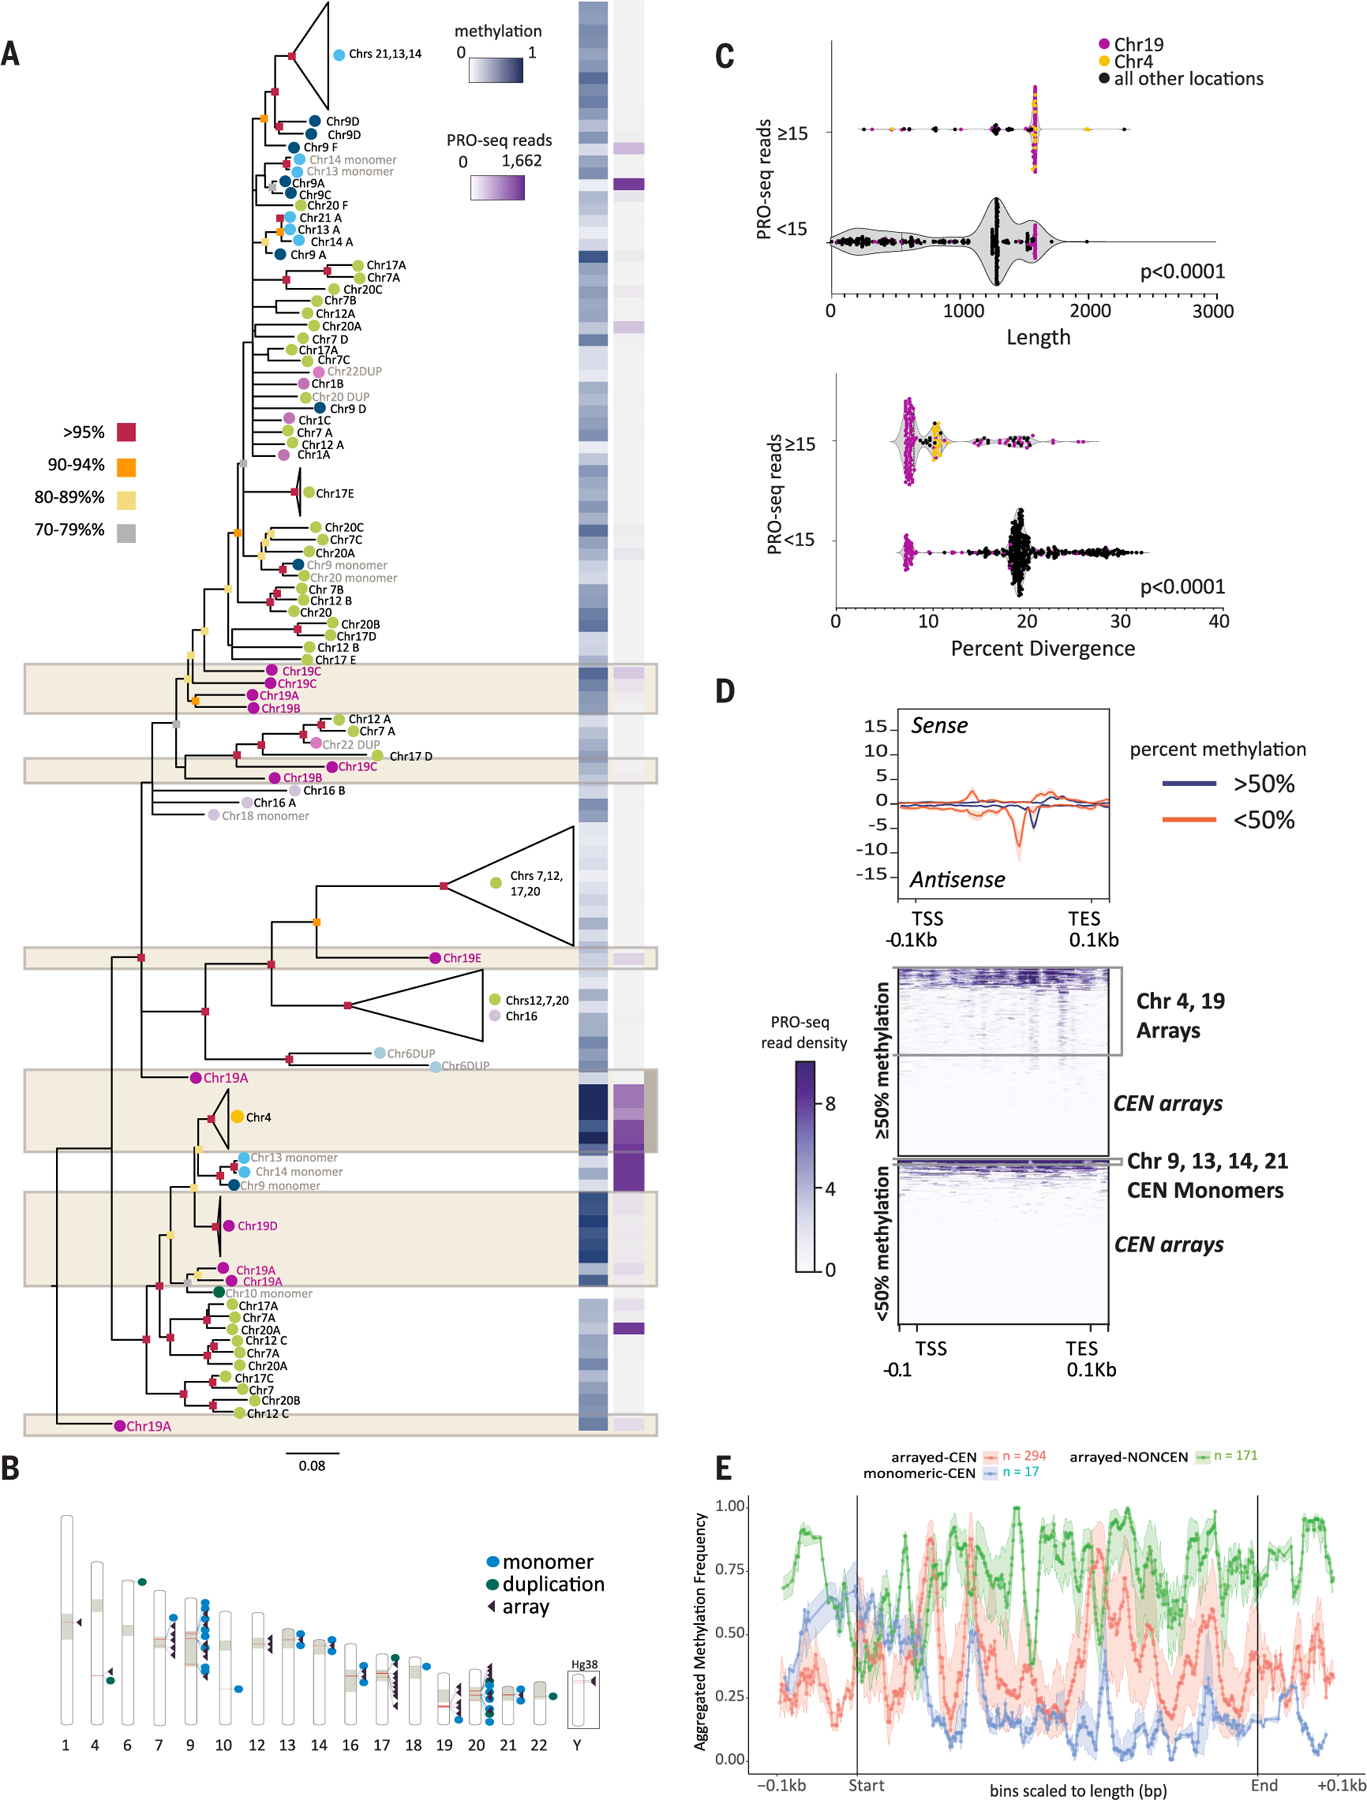
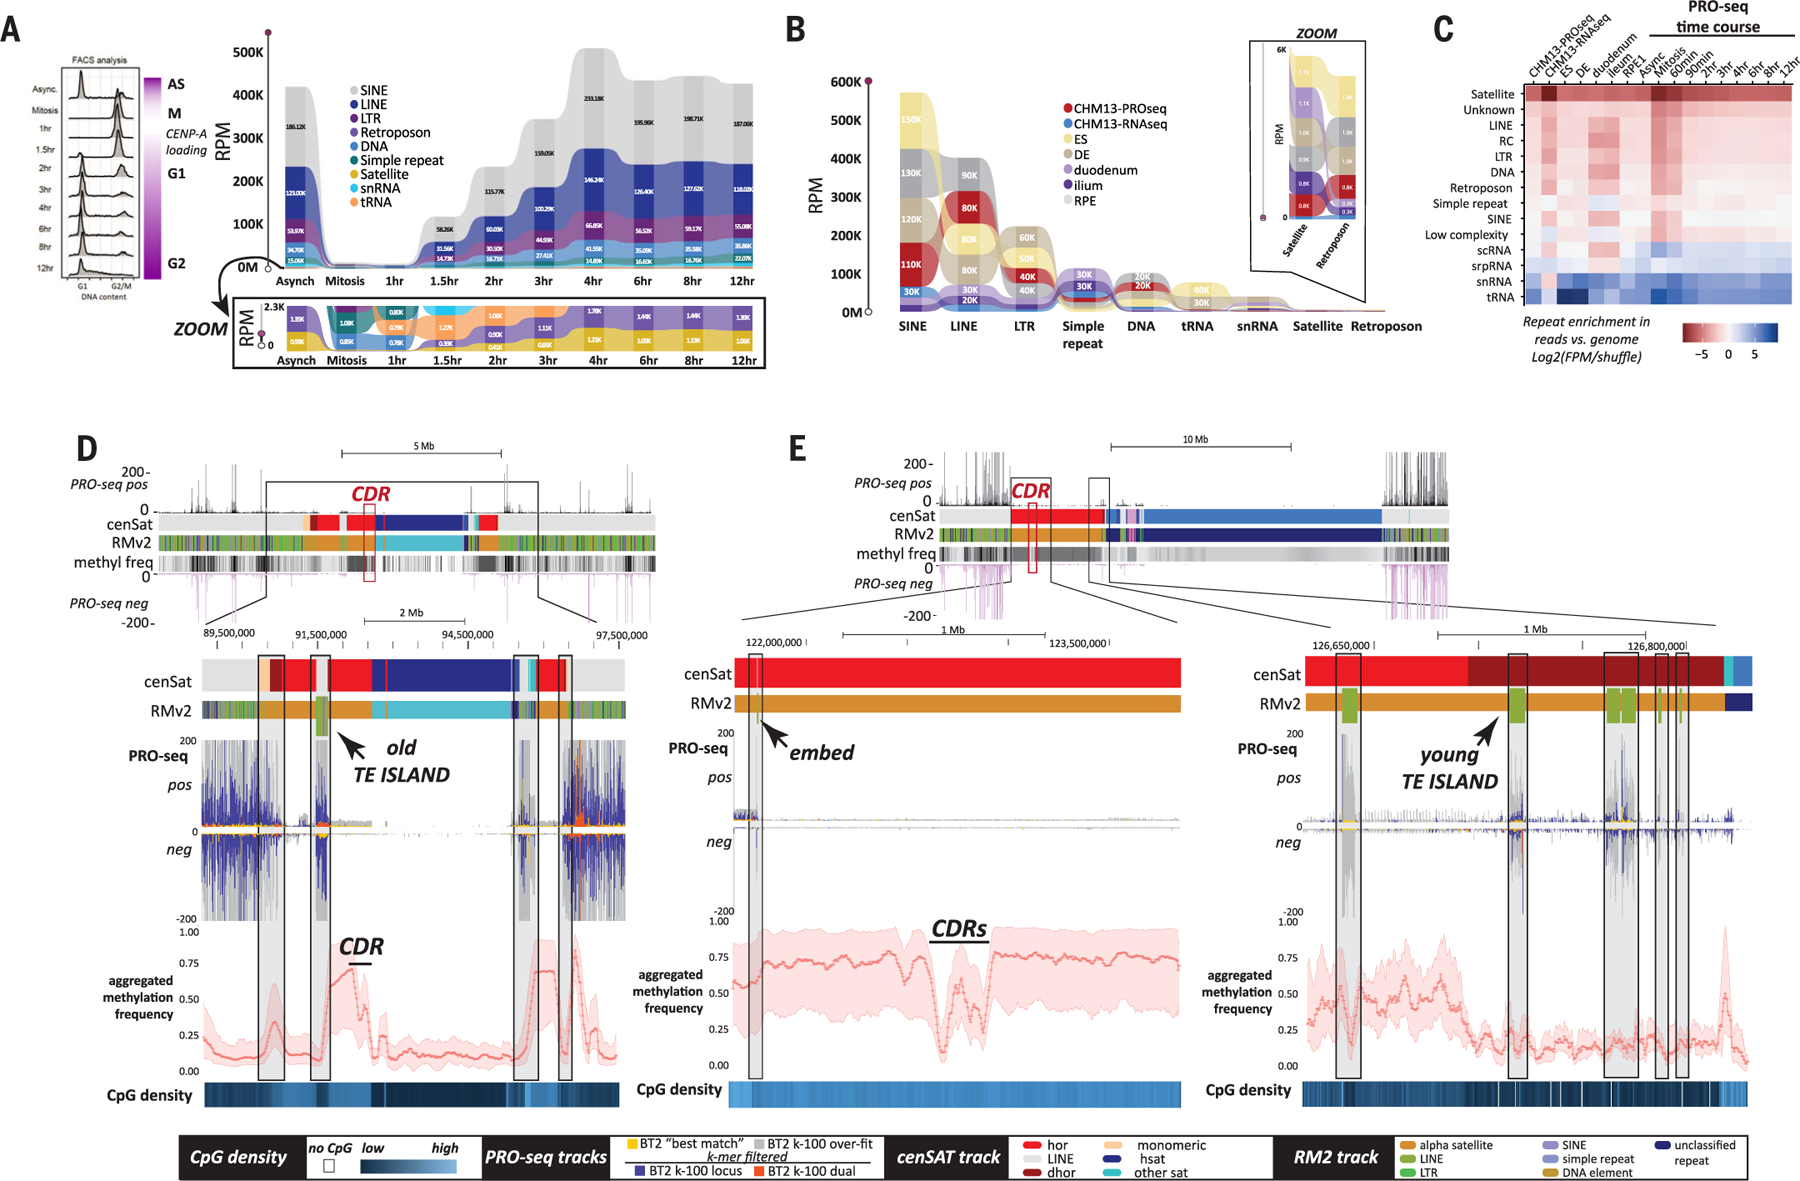
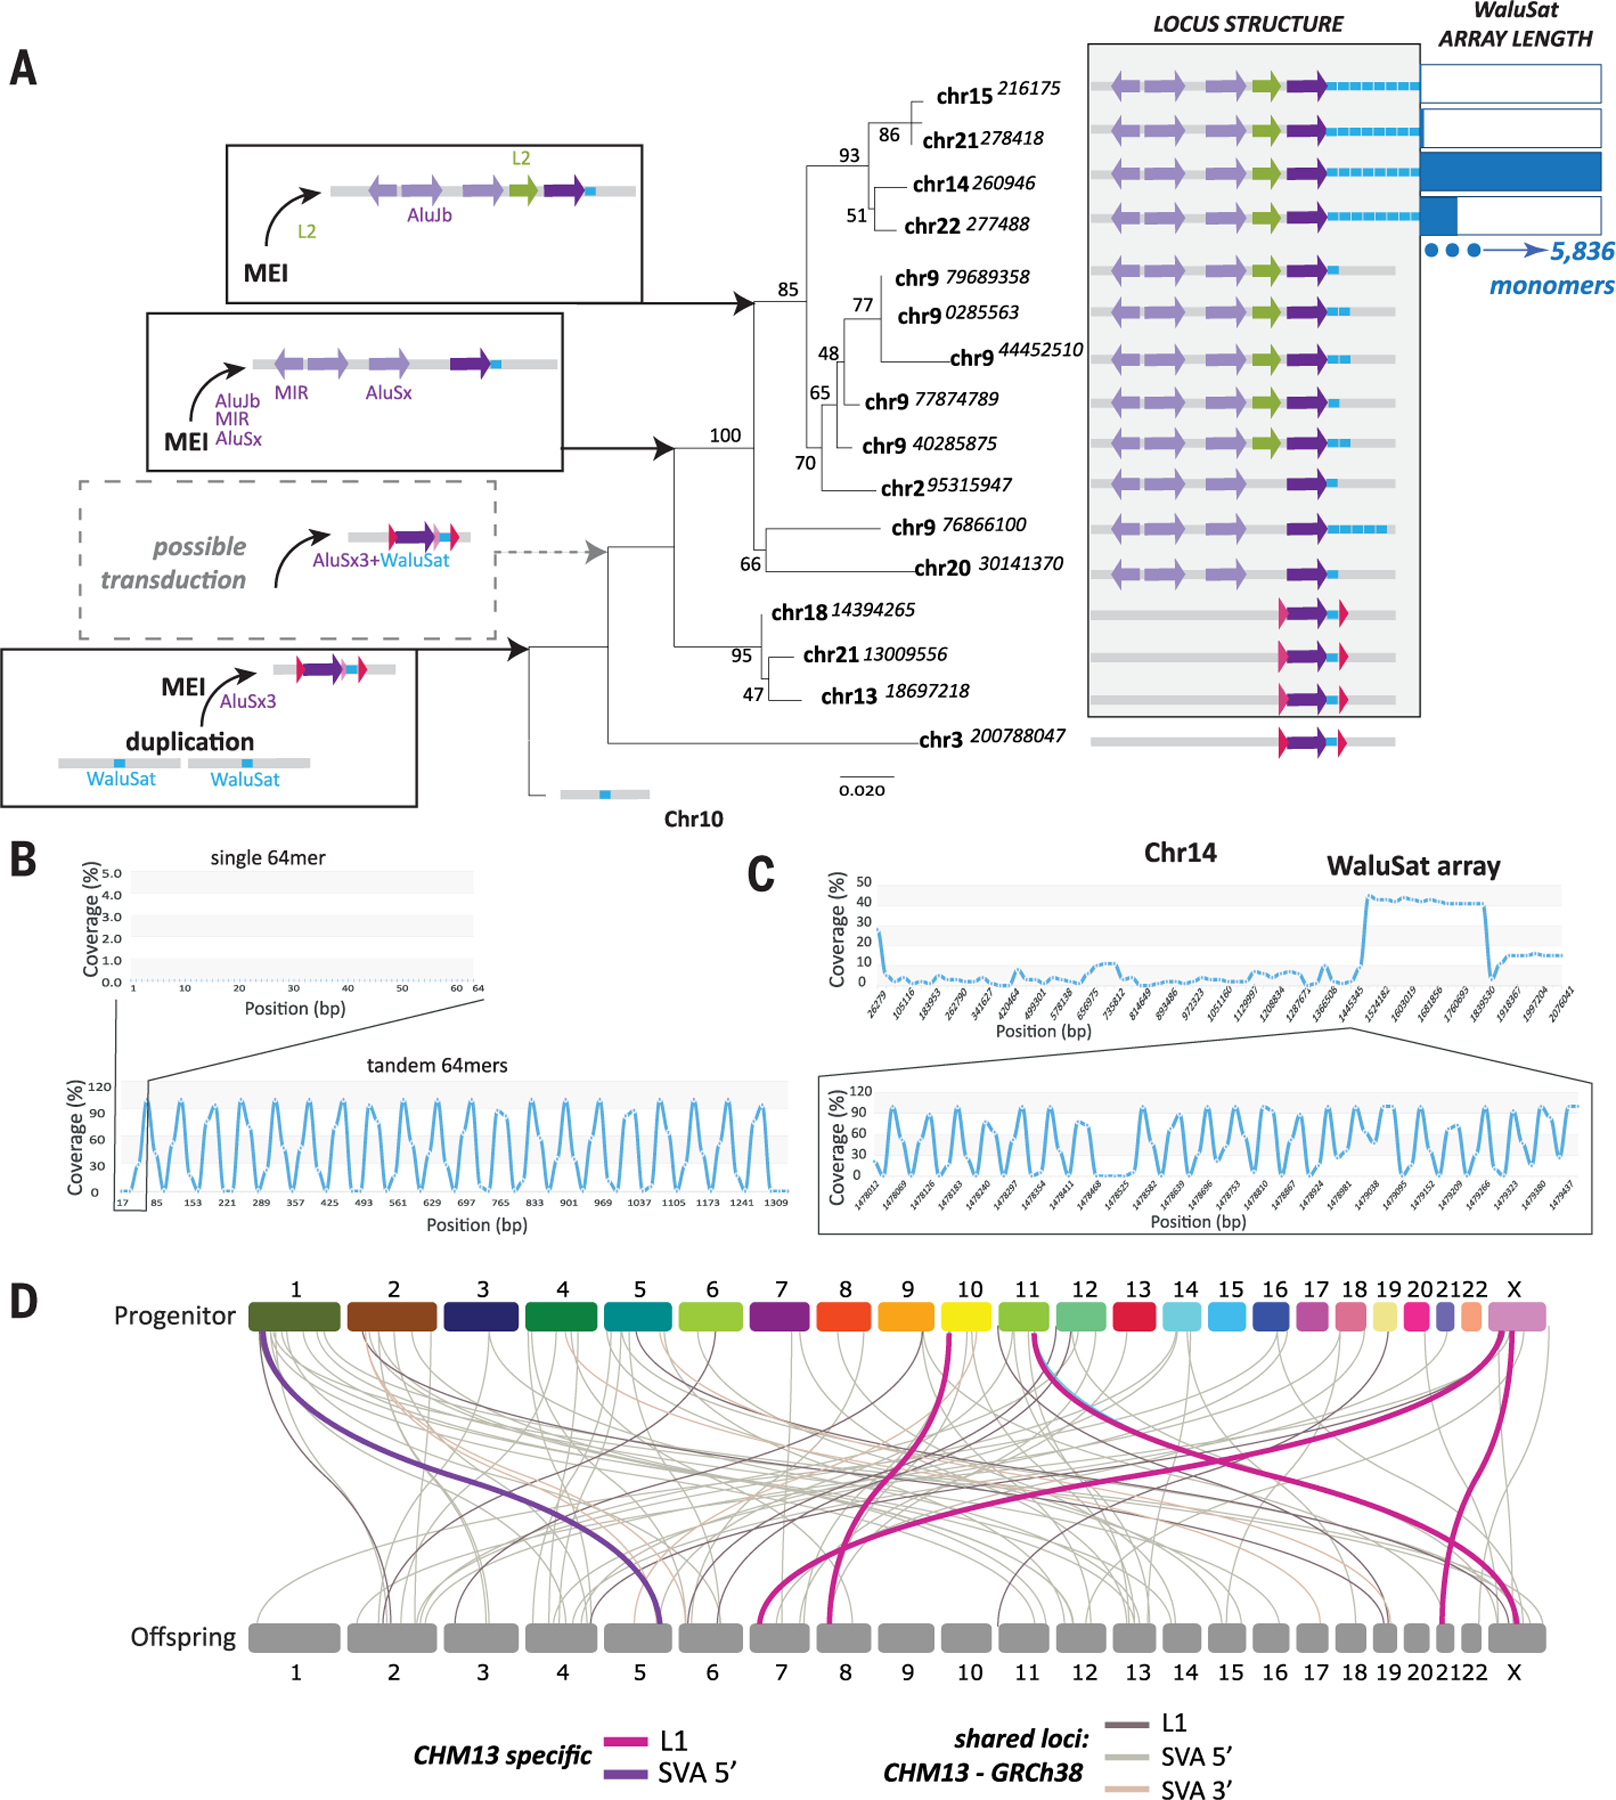
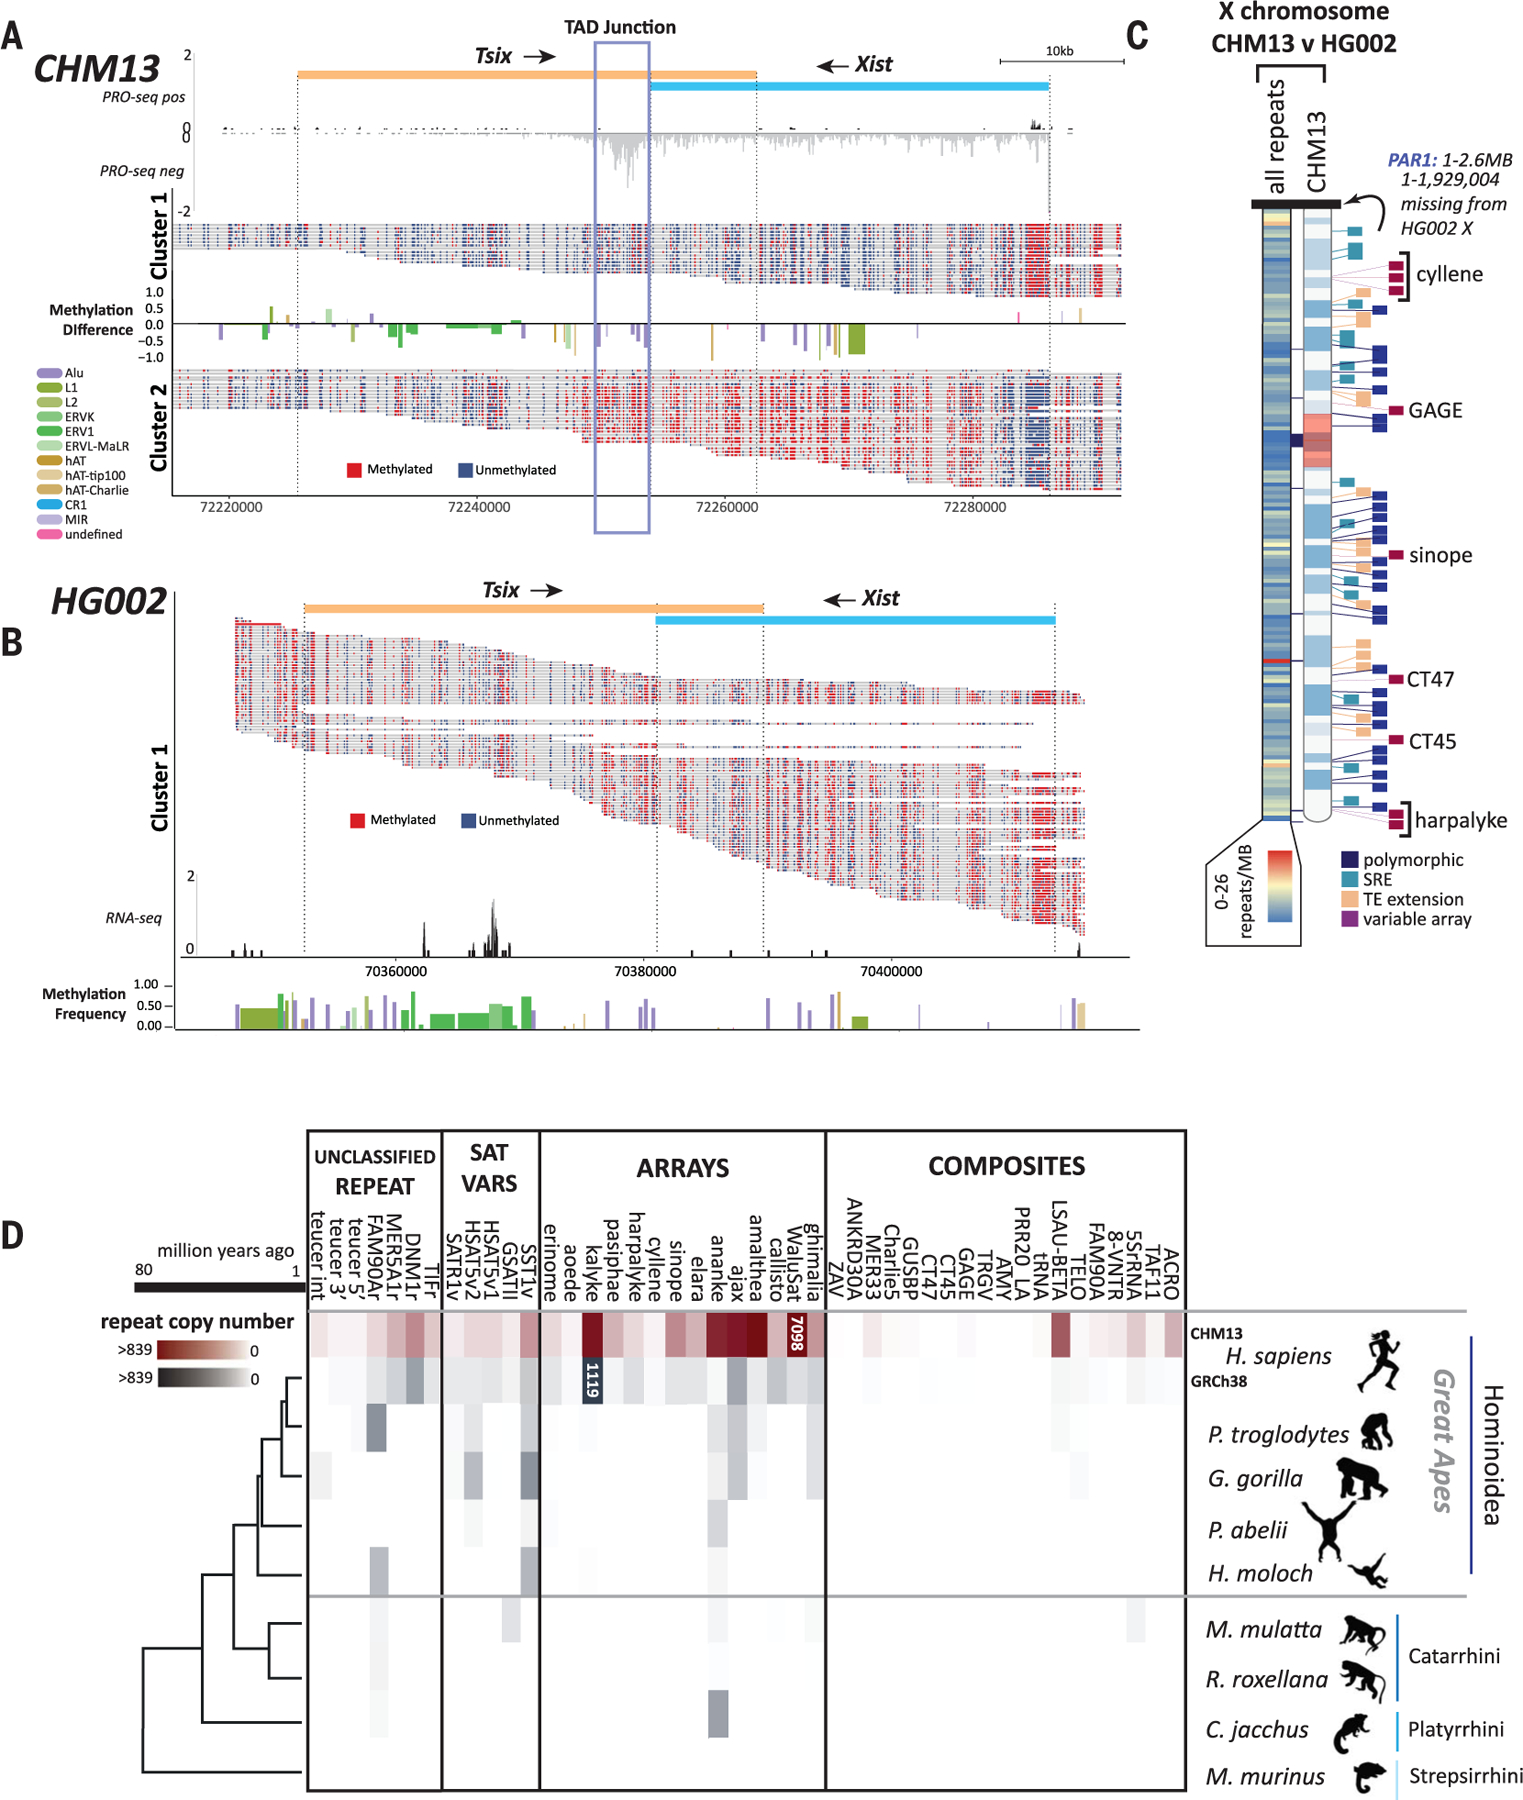
Mobile elements and repetitive genomic regions are sources of lineage-specific genomic innovation and uniquely fingerprint individual genomes. Comprehensive analyses of such repeat elements, including those found in more complex regions of the genome, require a complete, linear genome assembly. We present a de novo repeat discovery and annotation of the T2T-CHM13 human reference genome. We identified previously unknown satellite arrays, expanded the catalog of variants and families for repeats and mobile elements, characterized classes of complex composite repeats, and located retroelement transduction events. We detected nascent transcription and delineated CpG methylation profiles to define the structure of transcriptionally active retroelements in humans, including those in centromeres. These data expand our insight into the diversity, distribution, and evolution of repetitive regions that have shaped the human genome.


Conflict of interest statement

Competing interests: K.H.M. has received travel funds to speak at symposia organized by Oxford Nanopore. K.H.M. is a scientific advisory board (SAB) member of Centaura, Inc. E.E.E. is a SAB member of Variant Bio, Inc. W.T. has two patents (8,748,091 and 8,394,584) licensed to Oxford Nanopore Technologies. All other authors declare that they have no competing interests.

Figures

Fig. 1.
Fig. 1.. T2T-CHM13 assembly supports identification of previously unknown repeat families and complex epigenetic signatures.
(A) Schematic illustrating examples of tandem repeats, including satellites, simple and low complexity repeats and composites, and interspersed repeats, including class I and class II TEs, and structural RNAs. (B) Ideogram of CHM13 indicating the locations of annotated composite elements (red), satellite variants and unclassified repeats (aqua), and arrays or monomers of sequences found within those arrays (purple). Gaps in GRCh38 with no synteny to T2T-CHM13 (11) are shown in black boxes to the left of each chromosome, centromere blocks [including centromere transition regions (12)] are indicated in orange. (C) (Left) The number of TEs lifted and unlifted from T2T-CHM13 to GRCh38. (Right) Bar plot showing percentage of TEs by class (DNA, LTR, LINE, SINE, and retroposon) that were unlifted from T2T-CHM13 gap-filled regions (nonsyntenic, red) and syntenic regions (gray); the n values show the number of elements within each class affected. (D) (Top) T2T-CHM13 genome browser showing the 5SRNA_Comp subunit structure and array. RepeatMaskerV2 track, CG percentage, and methylation frequency tracks are shown. The MDR is indicated. (Bottom) A zoomed image of individual nanopore reads showing consistent hypomethylation in the MDR (chr1:227,818,289–227,830,789) and hypermethylation in the flanking regions (chr1:227,804,021–227,845,689). Both positive (top) and negative (bottom) strand aligning reads show the same methylation pattern. (E) (Top) Each T2T-CHM13 TELO-composite element consists of a duplication of a teucer repeat (blue) separated by a variable 49-bp (ajax) repeat array (red arrowheads) and three different composite subunits (TELO-A, -B, and -C). Repeat and TE annotations are shown. Some copies of TELO-composite contain the previously unknown repeat “10479” between the TELO-A and TELO-C subunits and/or after the TELO-C subunit. (Bottom) Metaplot of aggregated methylation frequency (average methylation of each bin across the region, 100 bins total) centered on the TELO-A subunit, ±20 kbp, grouped by chromosomal location (orange, centromeric; blue, subtelomeric; green, interstitial). CpG density for each group is indicated at the bottom (white, no CpG; dark blue, low CpG; bright blue, high CpG). The location of the ajax repeat array and the MER1A element within the TELO-C subunit are indicated.
Fig. 2.
Fig. 2.. Transcriptional profiles of TEs are highly correlated with sequence divergence and epigenetic features.
(A to F) RNA polymerase occupancy, methylation levels, CpGs, and divergence for (A) AluY, (B) HERV-K, (C) SVA-E, (D) SVA-F, (E) L1Hs, and (F) L1P elements from CHM13. Heatmaps of (left panel) T2T-CHM13 PRO-seq density (Bowtie2 default “best match,” purple scale) and average profiles showing sense and antisense strands (upper panels, standard error shown in gray) and (right panel) methylated CpGs (red–purple scale, aggregated frequency per site) for TEs grouped by their length [(A) to (E)] [fulllength (FL) and truncated (TR)] or L1PA subfamily [(F), all truncated)]. HERV-K groups are delineated as follows: >7500 bp elements (GT) and <7500 bp elements (LT) with both 5′ and 3′ long-terminal repeats (LTR+). (HERV-K elements with only one or no LTR are shown in fig. S18C). Both GT and LT/LTR+ HERV-K elements are scaled. All other TEs are anchored to the 3′ end, with a specified distance from the anchor (bottom left). Standard error for composite (gray), TSS (transcription start site), TES (transcription end site), location of the VNTR (variable number tandem repeat) within SVA are indicated. A dotted line is included on the heatmap denoting the static −0.1 kbp from the end of the annotated element. Representative schematic of elements and respective subcomponents are shown above the composite profile, scaled to the TES; red blocks indicate previously known promoter regions. (Right side of each panel) Parallel plots for each TE are shown, highlighting each group of TEs (FL/TR, or L1P subfamily; HERV-K plots represent LTRs only). Vertical axes represent scaled values for average methylation, number of CpG sites, and divergence from RepeatMasker consensus sequences for each instance of the element. Coloration by the number of overlapping PRO-Seq reads where purple represents the highest read overlap and blue the lowest, on the scale matching each plot.
Fig. 3.
Fig. 3.. Transcriptional, epigenetic, and structural differences define SST1 elements across the human genome.
(A) RAxML phylogenetic analysis of SST1 elements [subsampled to represent each chromosomal location and aligned using MAFFT (107)] (tables S14 to S17). Bootstrap values are indicated by color (as per key to the left) at the base of each node. Branch lengths indicate distances and unresolved nodes were collapsed. “Chr#” followed by letters A to F indicates the array designation by T2T-CHM13 chromosome unless SST1 is present as a monomer or as duplicons (DUP) (indicated in gray text). Colored circles by chromosome labels indicate phylogenetic clusters (e.g., chromosomes 7, 12, 17, and 20 in green and chromosomes 13, 14, and 21 in aqua). (Right) For each SST1 sequence or group of collapsed sequences on the tree, average methylation frequency (0, hypomethylated; 1, hypermethylated) is indicated in blue, and PRO-seq read coverage is indicated in purple as per key inset. Tan boxes denote noncentromeric arrays. (B) The location of SST1 elements across T2T-CHM13 is indicated by red bars within the chromosome schematic (table S14). Tan blocks indicate centromeres and centromere transition regions as per (12). SST1 arrangement as a single monomer (blue dot), duplication (green dot), or array (purple triangle) is indicated. Locations of SST1 arrays on the Y chromosome are shown for GRCh38 (CHM13 is 46,XX). (C) Violin plot of SST1 elements shows statistically significant differences between expression levels (repeat overlap of PRO-seq reads, Bowtie2 default “best match”) and length of the element (t test, P < 0.0001) as well as percent divergence (t test, P < 0.0001). Dot colors indicate interstitial arrays on chromosome 19 (purple) and chromosome 4 (yellow) with a read overlap higher than 15. All other locations with a read overlap lower than 15 are indicated in black. Fifteen read overlap cutoffs determined by analyzing the range of read overlap among all SST1s (fig. S23). (D) T2T-CHM13 PRO-seq profiles (Bowtie2 default “best match,” upper panel) of SST1 grouped by average methylation levels (<50% and > 50%). Each element is scaled to a fixed size with standard error shading (gray), TSS, TES, and ±0.1 kbp are shown (bottom). Heatmaps (lower panels) of PRO-seq density (purple scale, normalized reads per million aggregate for sense and antisense) grouped by average methylation levels (>50%, top; <50%, bottom). Clusters of specific SST1 loci are indicated to the right. (E) Metaplot of aggregated methylation frequency (100 bins total) of SST1 elements (500 bp to 2 kbp), ±0.1 kbp, grouped by chromosomal location and arrayed versus monomeric or duplicated [orange, centromeric (CEN) array; blue, centromeric monomer; green, noncentromeric array]. Truncated noncentromeric/CEN monomers and duplications not shown; length filtering resulted in n = 1.
Fig. 4.
Fig. 4.. Centromere landscape is characterized by the transcription of TEs rather than satellites.
(A) (Left) Cell sorting data showing the stages of the cell cycle after synchronization and release. (Right) Ribbon plots of repeat abundance in PRO-seq data [shown as reads per million (RPM)] assessed by CASK method in asynchronous and synchronized HeLa cells collected at time points across the cell cycle (key in inset). A zoomed image shows the reads for the lower range of expressed repeats, including all satellites classified in T2T-CHM13 (tan). (B) Ribbon plot of repeat abundance in PRO/ChRO-seq data, shown as RPM, assessed by CASK method across different developmental stages and samples. Datasets include T2T-CHM13 PRO-seq and native RNA-seq, PRO-seq for RPE-1 (differentiated retinal pigment epithelial cells), and ChRO-seq for H9 ES (embryonic stem cells), DE (differentiated endoderm cells), duodenum tissue, and ileum tissue. A zoomed image shows the reads for the lowest of categories of repeats across all samples, including the satellites classified in T2T-CHM13. (C) Repeat enrichment across PRO-seq and RNA-seq datasets (all times points and tissues) ranked from least (red) to most enriched (blue) on the basis of k-mers normalized to genomic frequency in T2T-CHM13. (D and E) Recently active retroelements (green ticks in RM2 track) found embedded within alpha satellite HOR arrays (red) in (D) an “old” TE island derived from segmental duplications on chromosome 3 and (E) solo embedded TEs and “young” TE islands on chromosome 1. Stranded PRO-seq profiles (Bowtie2 default “best match”) across chromosome 3 and 1 regions encompassing the centromere are shown (top). TEs are transcriptionally active (PRO-seq Bowtie2 “best match” mapping (yellow), k-100 overfit mapping (gray), and single (blue) and dual filtered (red) k-100 mapping data are indicated for both strands) and located (black boxes) at transitions in CpG methylation (metaplot at bottom; 200 bins total) and CpG density (blue, below) within the array. Key of elements in cenSAT and RM2 tracks indicated at bottom.
Fig. 5.
Fig. 5.. TE activity affects genomic repeat diversity in CHM13.
(A) Maximum likelihood (ML) phylogenetic analyses of the AluSx3-WaluSat locus across T2T-CHM13. Chromosome location is indicated (starting nucleotide position shown) at each branch. Bootstrap values shown at each node, distance indicated by length of branch. Left shows the sequential order of events, initiating with a duplication of the chromosome 10 WaluSat locus followed by mobile element insertion (MEI) of an AluSx3. The identification of putative TSDs (pink, fig. S43) and a lack of identity among sequences adjacent to WaluSat on chromosome 3 and all other loci (fig. S43) may indicate that a transduction event preceded the spread of AluSx3-WaluSat across the human genome (dotted box). MEI events upstream of the AluSx3-WaluSat are concordant with phylogenetic relationships among loci and indicate that the derivation of AluSx3-WaluSat loci across other chromosomes were the result of segmental duplication events (gray shaded box). Once the AluSx3-WaluSat was duplicated to the acrocentric chromosomes 14, 15, 21, and 22, a massive expansion of the WaluSat sequence (blue boxes) occurred. The number of WaluSat monomers within each acrocentric array is indicated on the right with monomer number relative to maximum monomer count 5836 on chromosome 14. (B) G-quadruplex (G4) analysis of a single 64-mer monomer of the WaluSat sequence showed no predicted G4 structures (top), while an in silico construct of a tandem array of the WaluSat shows high G4 coverage at the junction between individual WaluSat monomers across the array. (C) G4 analysis of the p arm of chromosome 14 shows a peak in G4 predictions coincident with the WaluSat array. Bottom is a zoom inset of a subset of the array showing that the junctions between most monomers carry predicted G4 structures. (D) Transduction events predicted for CHM13 (L1, pink; SVA 5′, purple) and shared between T2T-CHM13 and GRCh38 (gray shades) are shown. Chromosome connections link progenitor and offspring locations (fig. S49).
Fig. 6.
Fig. 6.. Repetitive elements define differences between human genomes and nonhuman primates.
Single read methylation profiles were extracted, and reads were clustered on the basis of the methylation state of the Xist promoter from (A) T2T-CHM13 and (B) HG002. Differences in repeat methylation were calculated by taking the average methylation per repeat and subtracting cluster 2 repeats from cluster 1 repeats. Directionality of Xist/Tsix transcript units are indicated (top). Normalized PRO-seq reads show a marked pileup of RNA pol II at the predicted TAD boundary at the 3′ end of the Xist transcript [(A), blue box]. (B) Normalized RNA-seq reads across the single cluster for HG002 show no transcriptional signal for Xist. (C) Heatmap of chromosome X showing the location of all repeat differences between the Xs of HG002 and T2T-CHM13 (left) and the location of the top four categories of repeat differences: polymorphic (insertion/deletion), SRE (short repeat extension), TE extension, and variable array length (right ideogram). Gaps between T2T-CHM13 and GRCh38 are indicated with black blocks between the heatmap and ideogram. (D) Copy numbers of previously unknown human repeat annotations identified in T2T-CHM13 grouped by repeats, variants of known satellites, tandemly arrayed sequences, and composite element (inclusive of subunits) for T2T-CHM13 (maroon), GRCh38, and genomes for other primates from the Hominoidea, Catarhini, and Platyrrhini lineages (gray). Heatmap scale denotes number of repeats within the array (0 to 839). Array sizes >839 are indicated within colored blocks. Phylogenetic relationship and millions of years since divergence are indicated on the bottom. Not shown: variants of known centromeric satellites [but see (12)] and the repeat annotation for an AluJb (121) fragment, which could not reliably be delineated in copy number from other closely related full-length AluJb elements.

Comment in

References

    1. Chuong EB, Elde NC, Feschotte C, Regulatory activities of transposable elements: From conflicts to benefits. Nat. Rev. Genet 18, 71–86 (2017). doi: 10.1038/nrg.2016.139; - DOI - PMC - PubMed
    1. Cordaux R, Udit S, Batzer MA, Feschotte C, Birth of a chimeric primate gene by capture of the transposase gene from a mobile element. Proc. Natl. Acad. Sci. U.S.A 103, 8101–8106 (2006). doi: 10.1073/pnas.0601161103 - DOI - PMC - PubMed
    1. Koonin EV, Viruses and mobile elements as drivers of evolutionary transitions. Philos. Trans. R. Soc. London Ser. B 371, 20150442 (2016). doi: 10.1098/rstb.2015.0442 - DOI - PMC - PubMed
    1. Koga A et al., Co-opted megasatellite DNA drives evolution of secondary night vision in Azara’s owl monkey. Genome Biol. Evol 9, 1963–1970 (2017). doi: 10.1093/gbe/evx142 - DOI - PMC - PubMed
    1. Hancks DC, Kazazian HH Jr., Roles for retrotransposon insertions in human disease. Mob. DNA 7, 9 (2016). doi: 10.1186/s13100-016-0065-9 - DOI - PMC - PubMed

Publication types