. 2022 Apr;376(6588):eabl3533.
doi: 10.1126/science.abl3533. Epub 2022 Apr 1.

A complete reference genome improves analysis of human genetic variation

Affiliations

A complete reference genome improves analysis of human genetic variation

Sergey Aganezov et al. Science. 2022 Apr.

Abstract

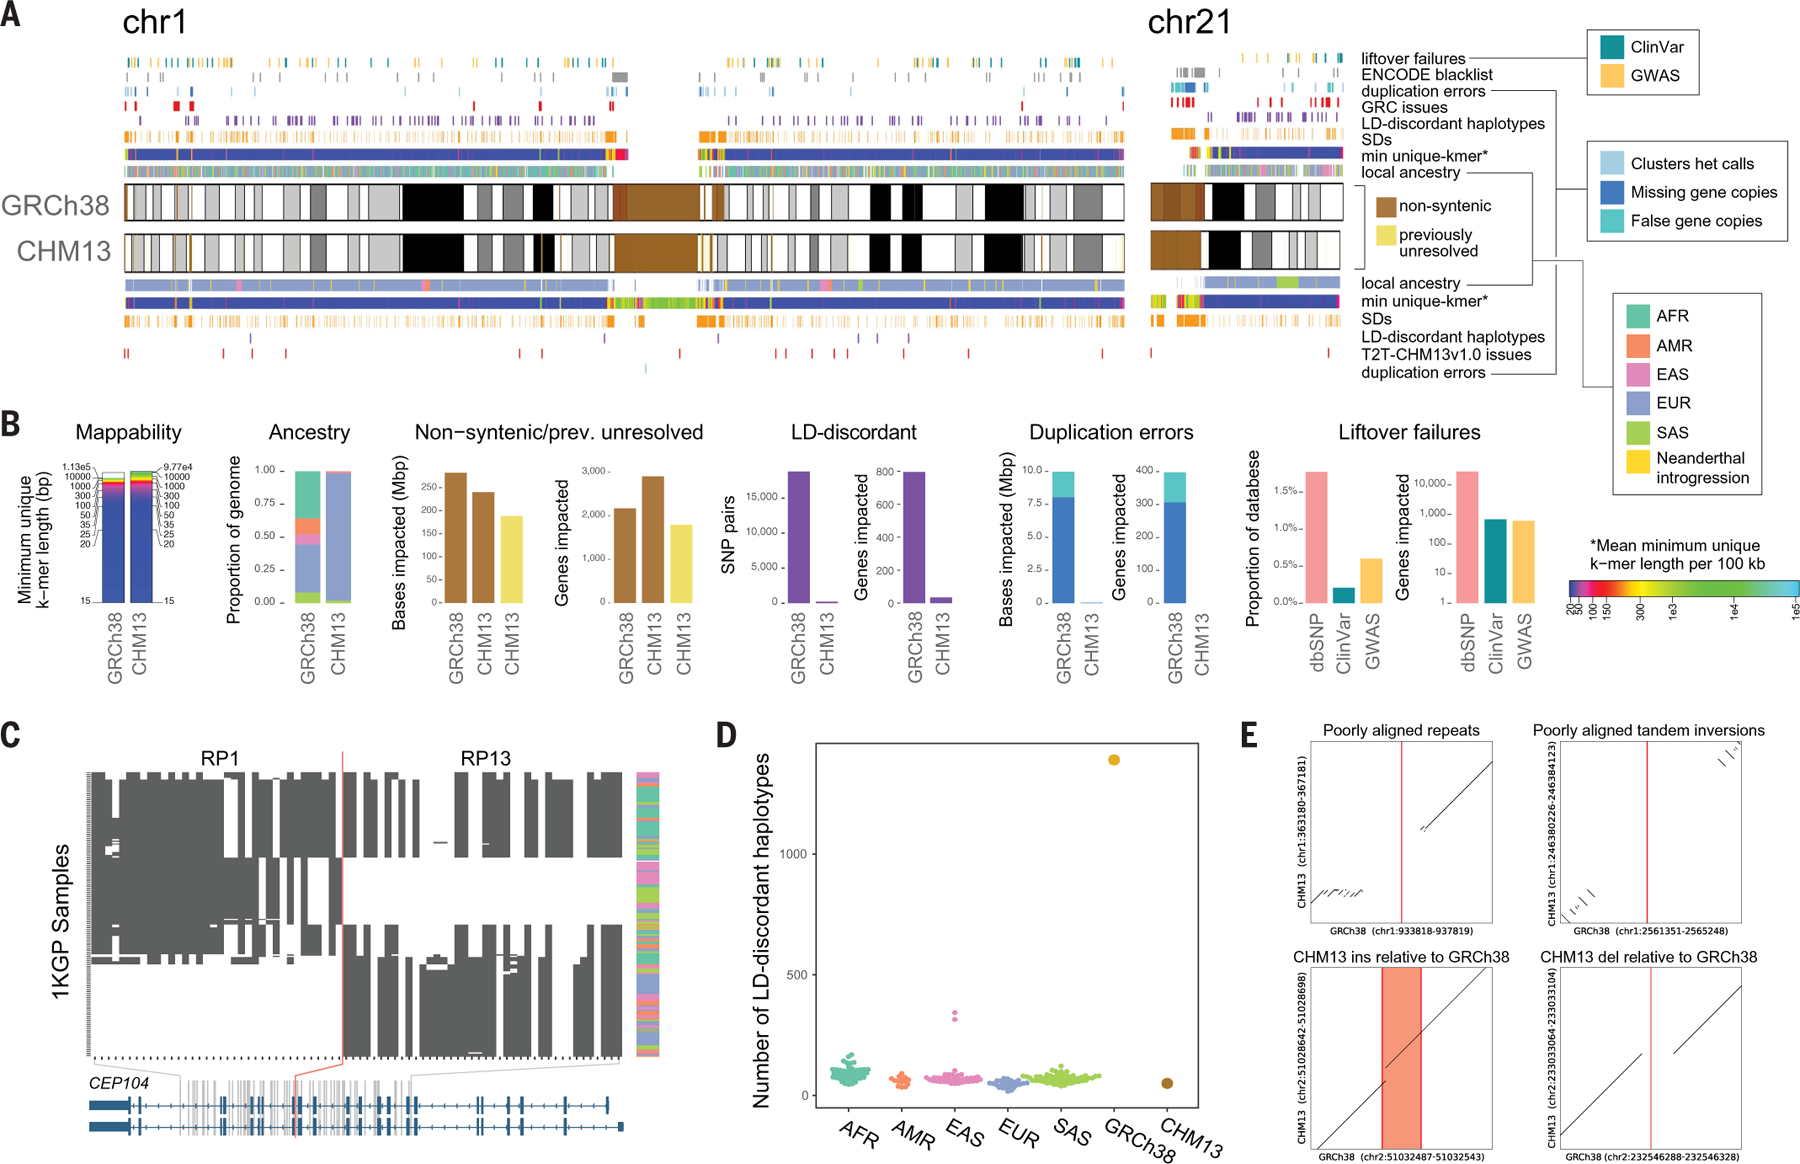
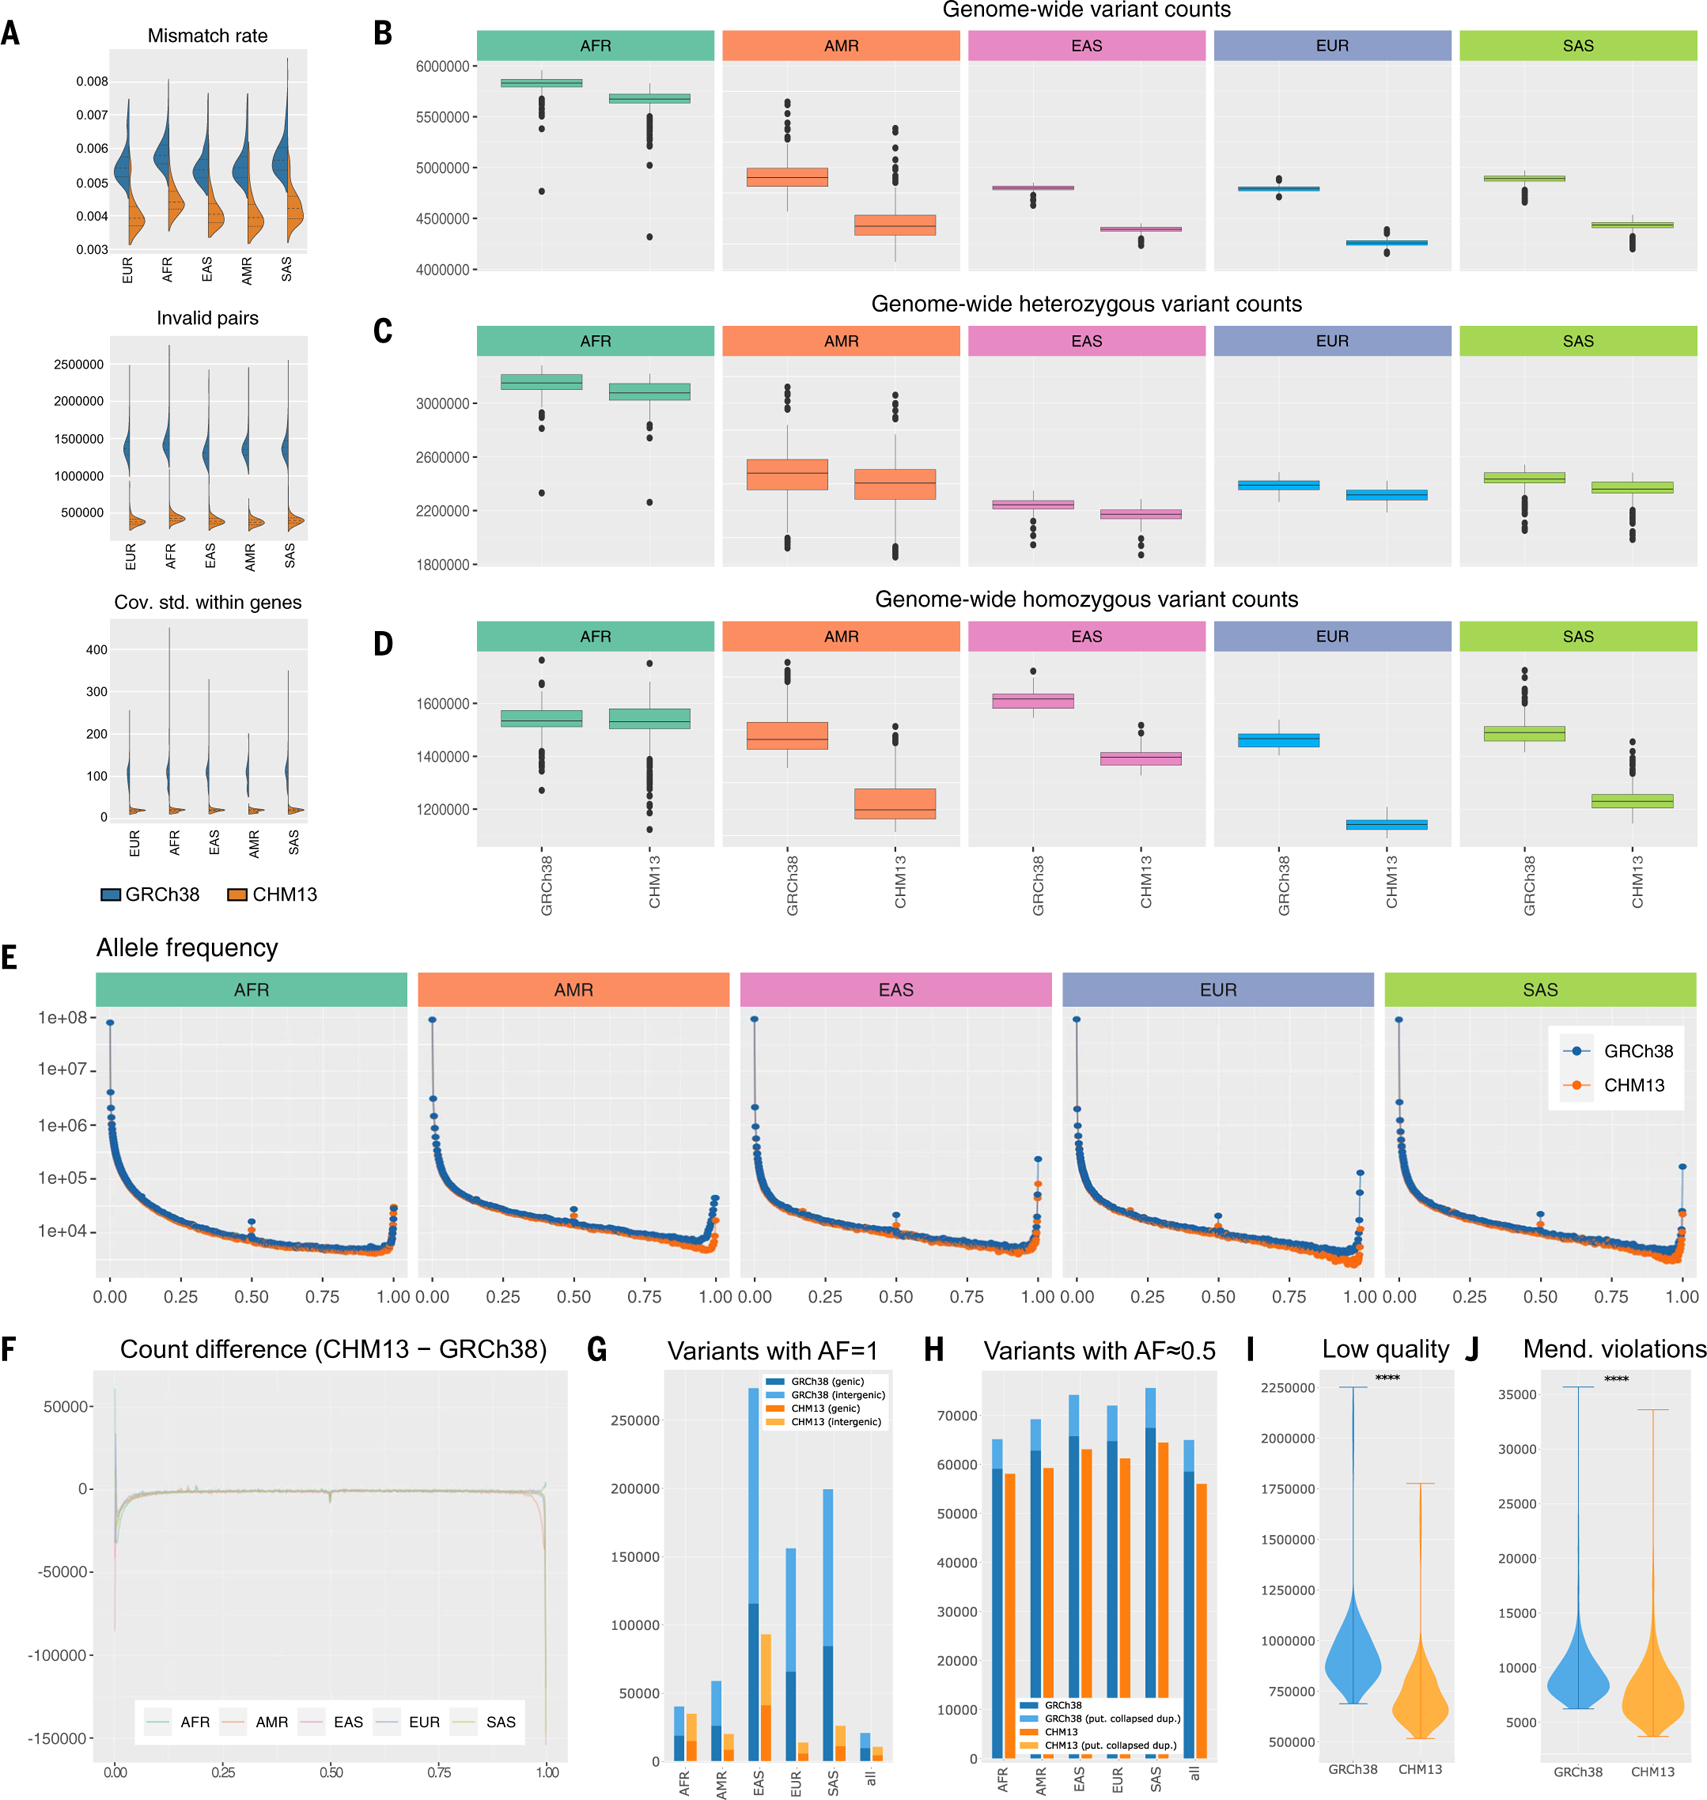
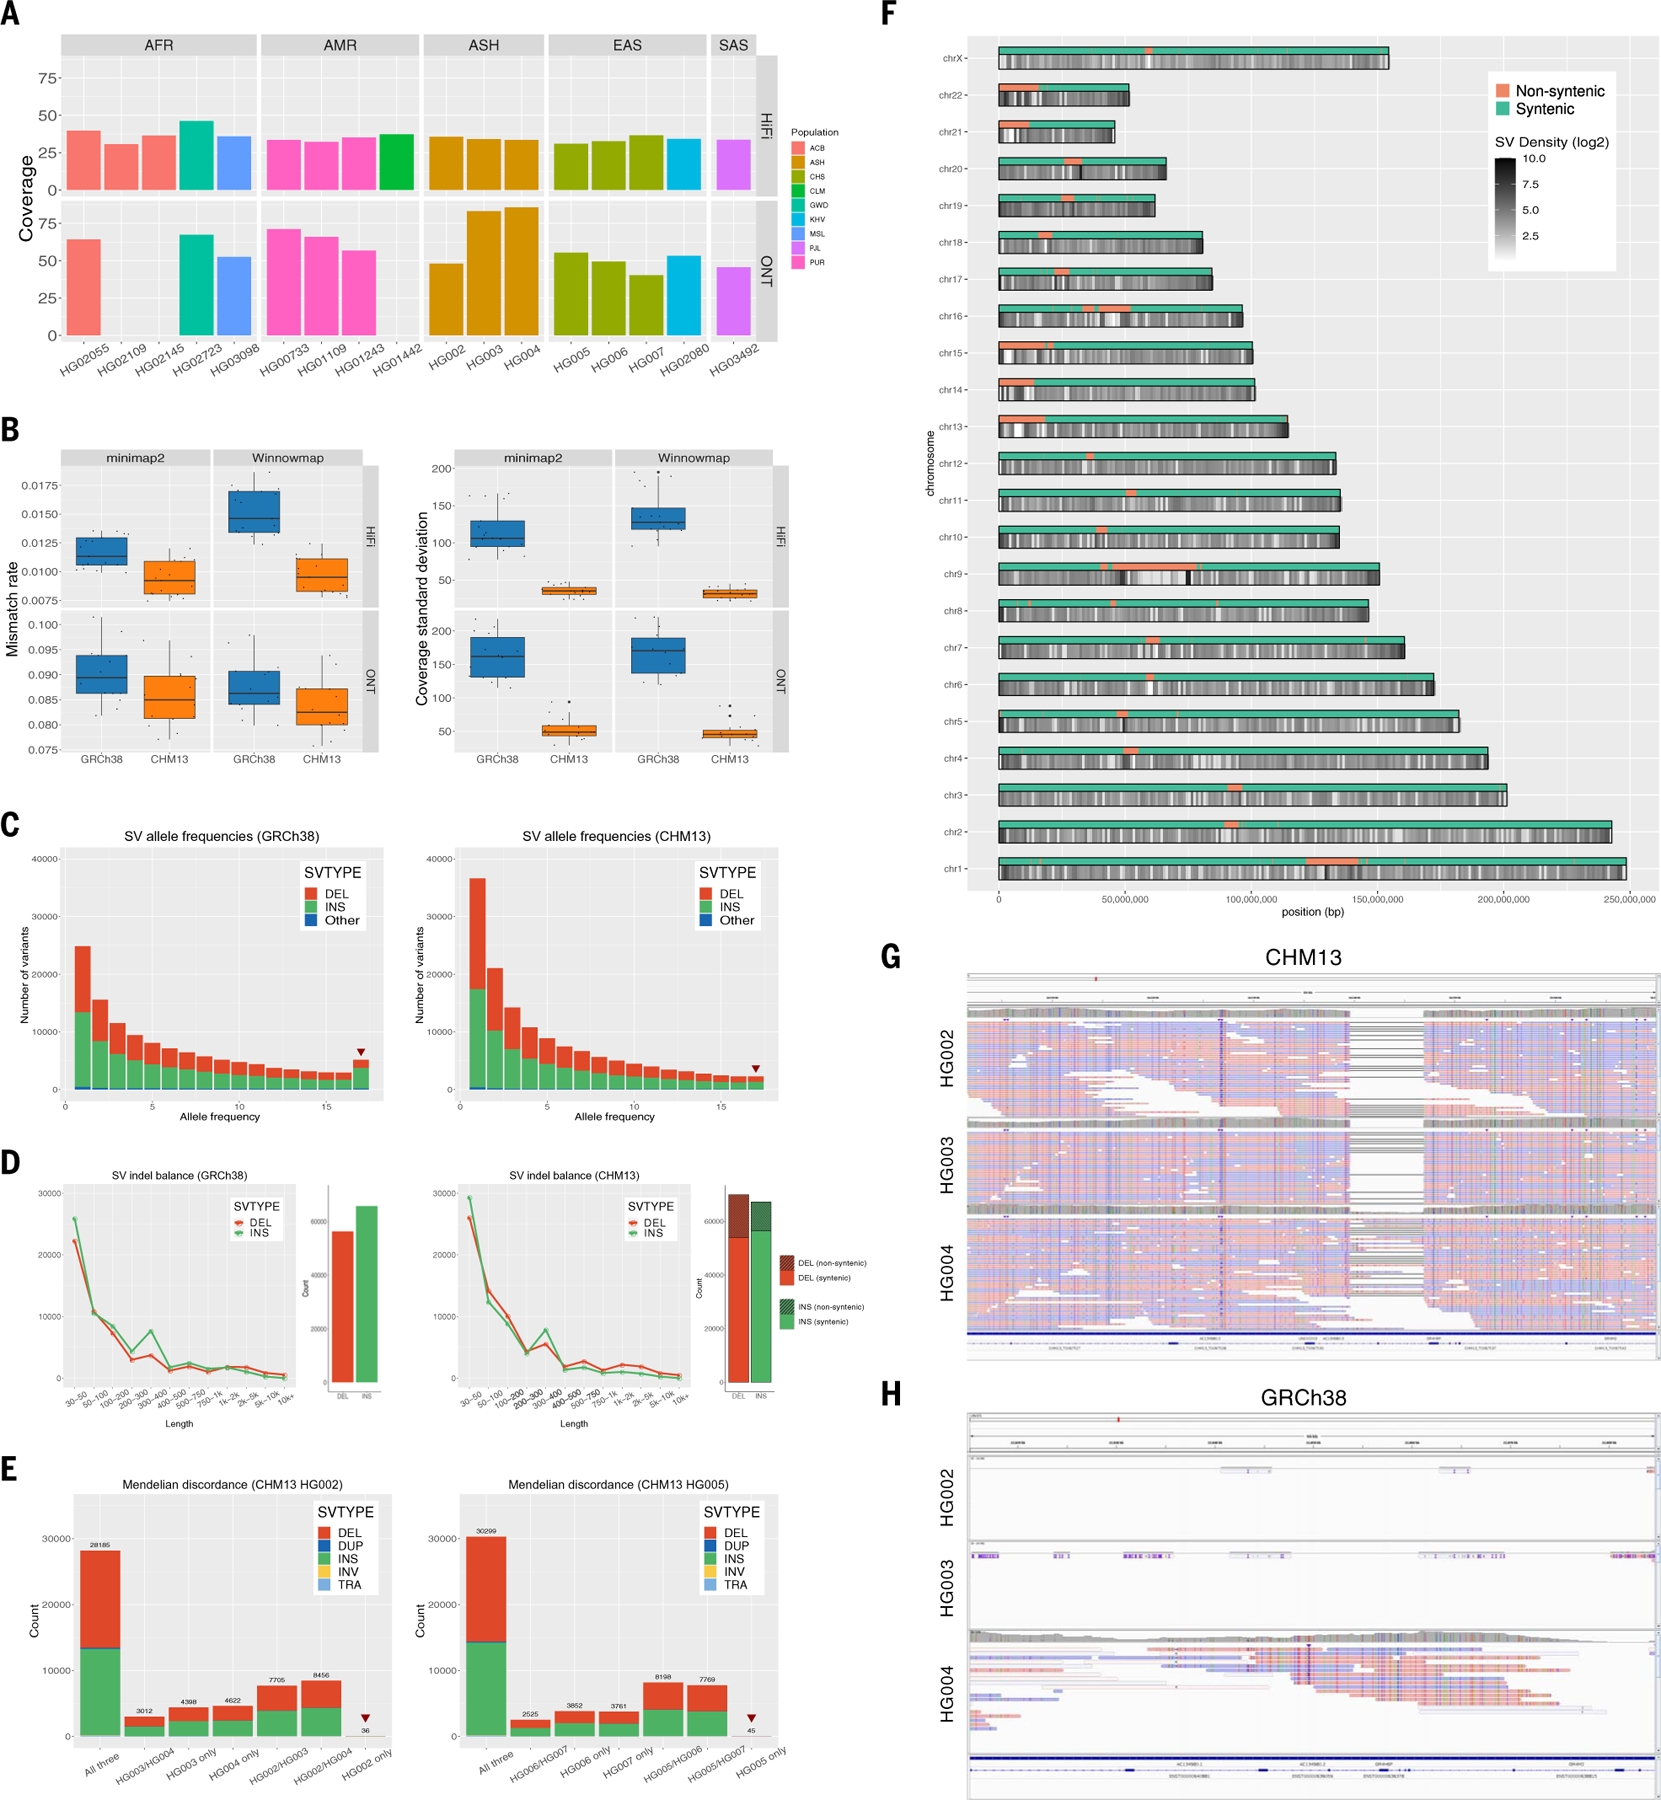
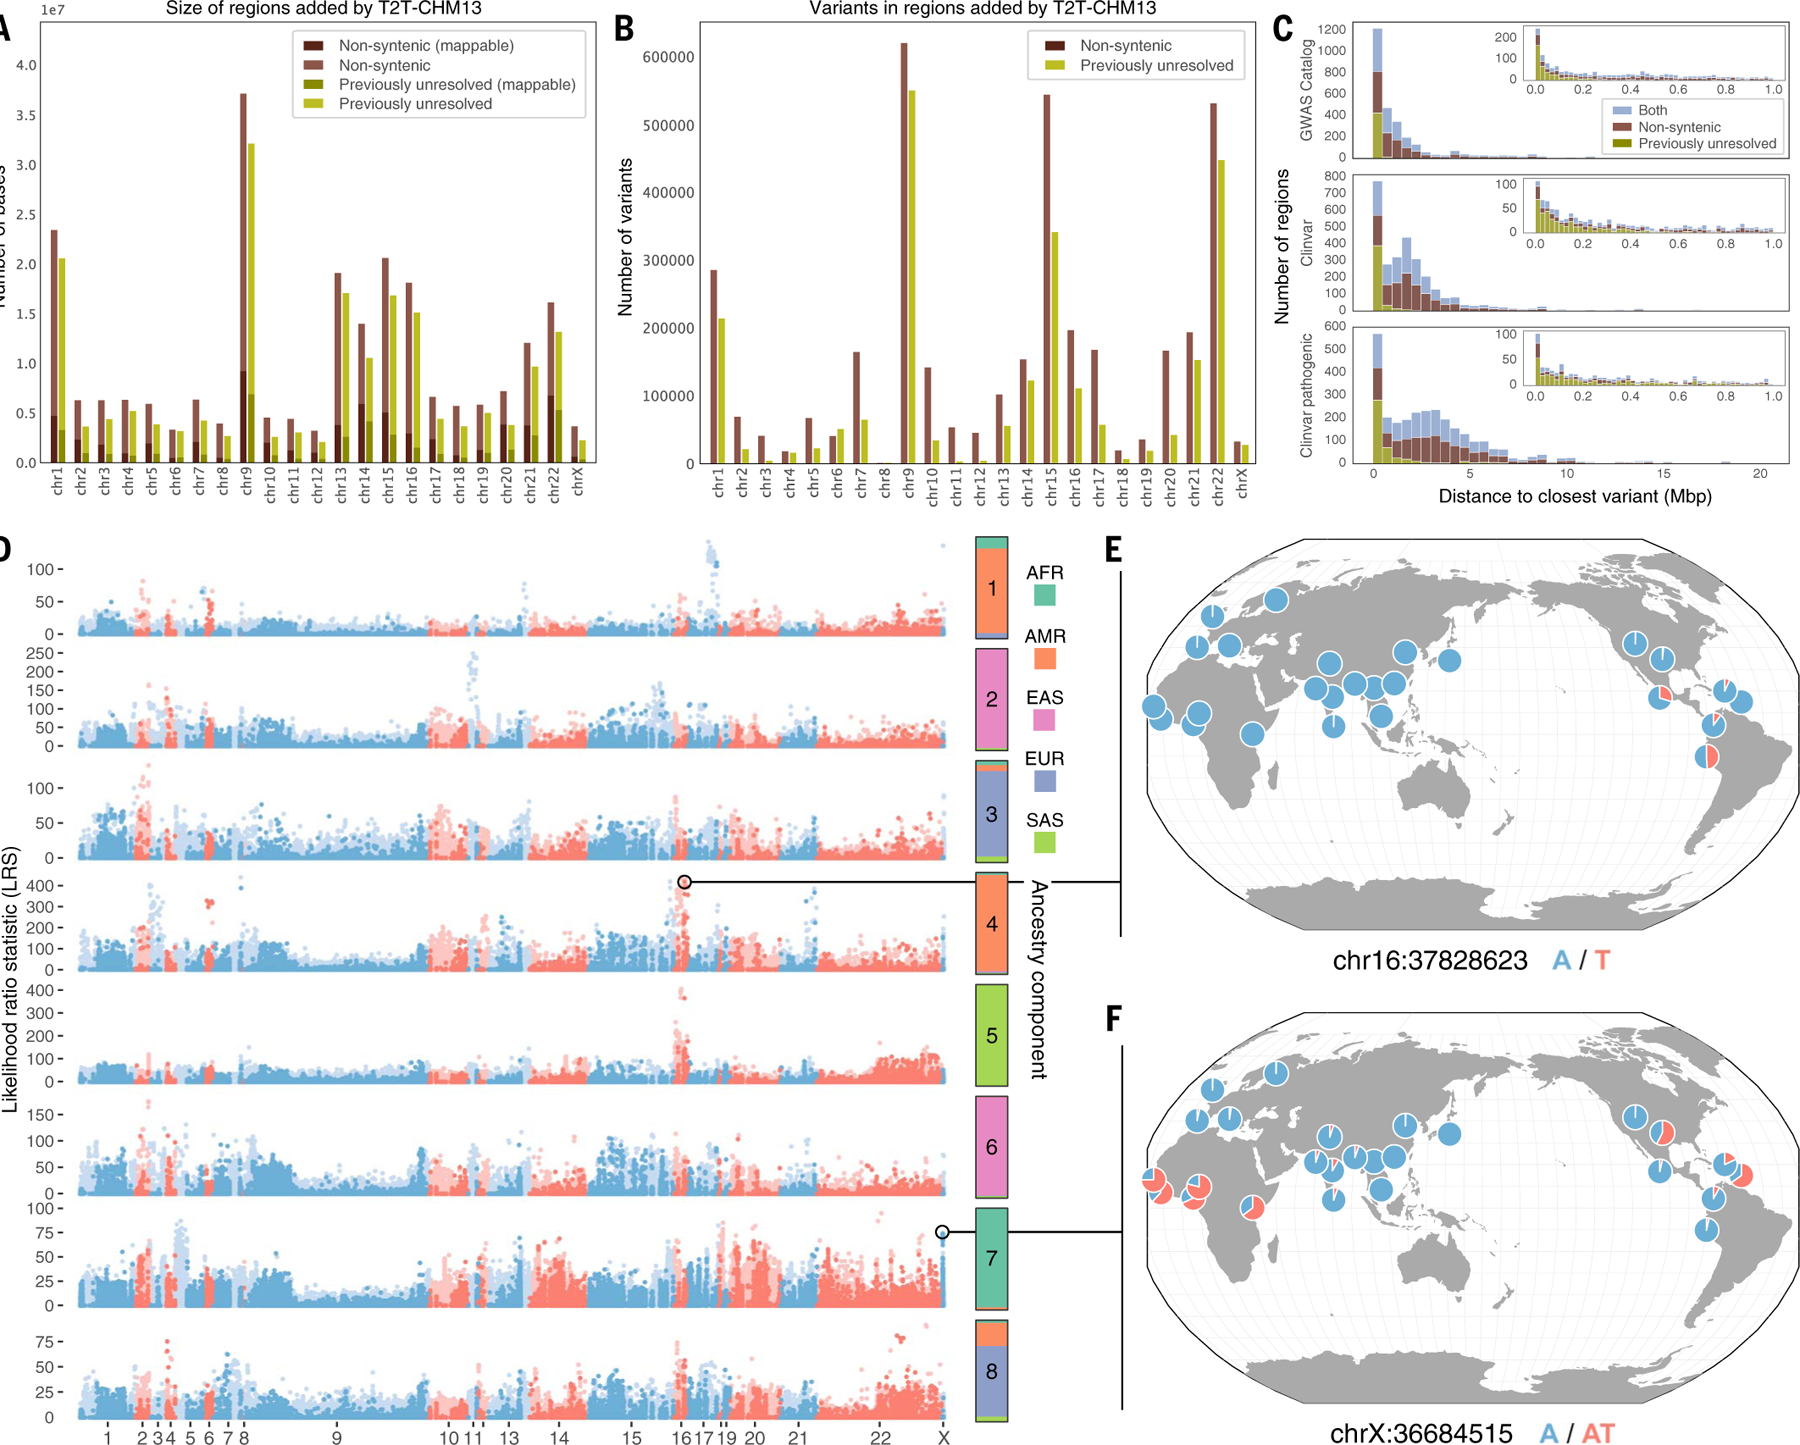
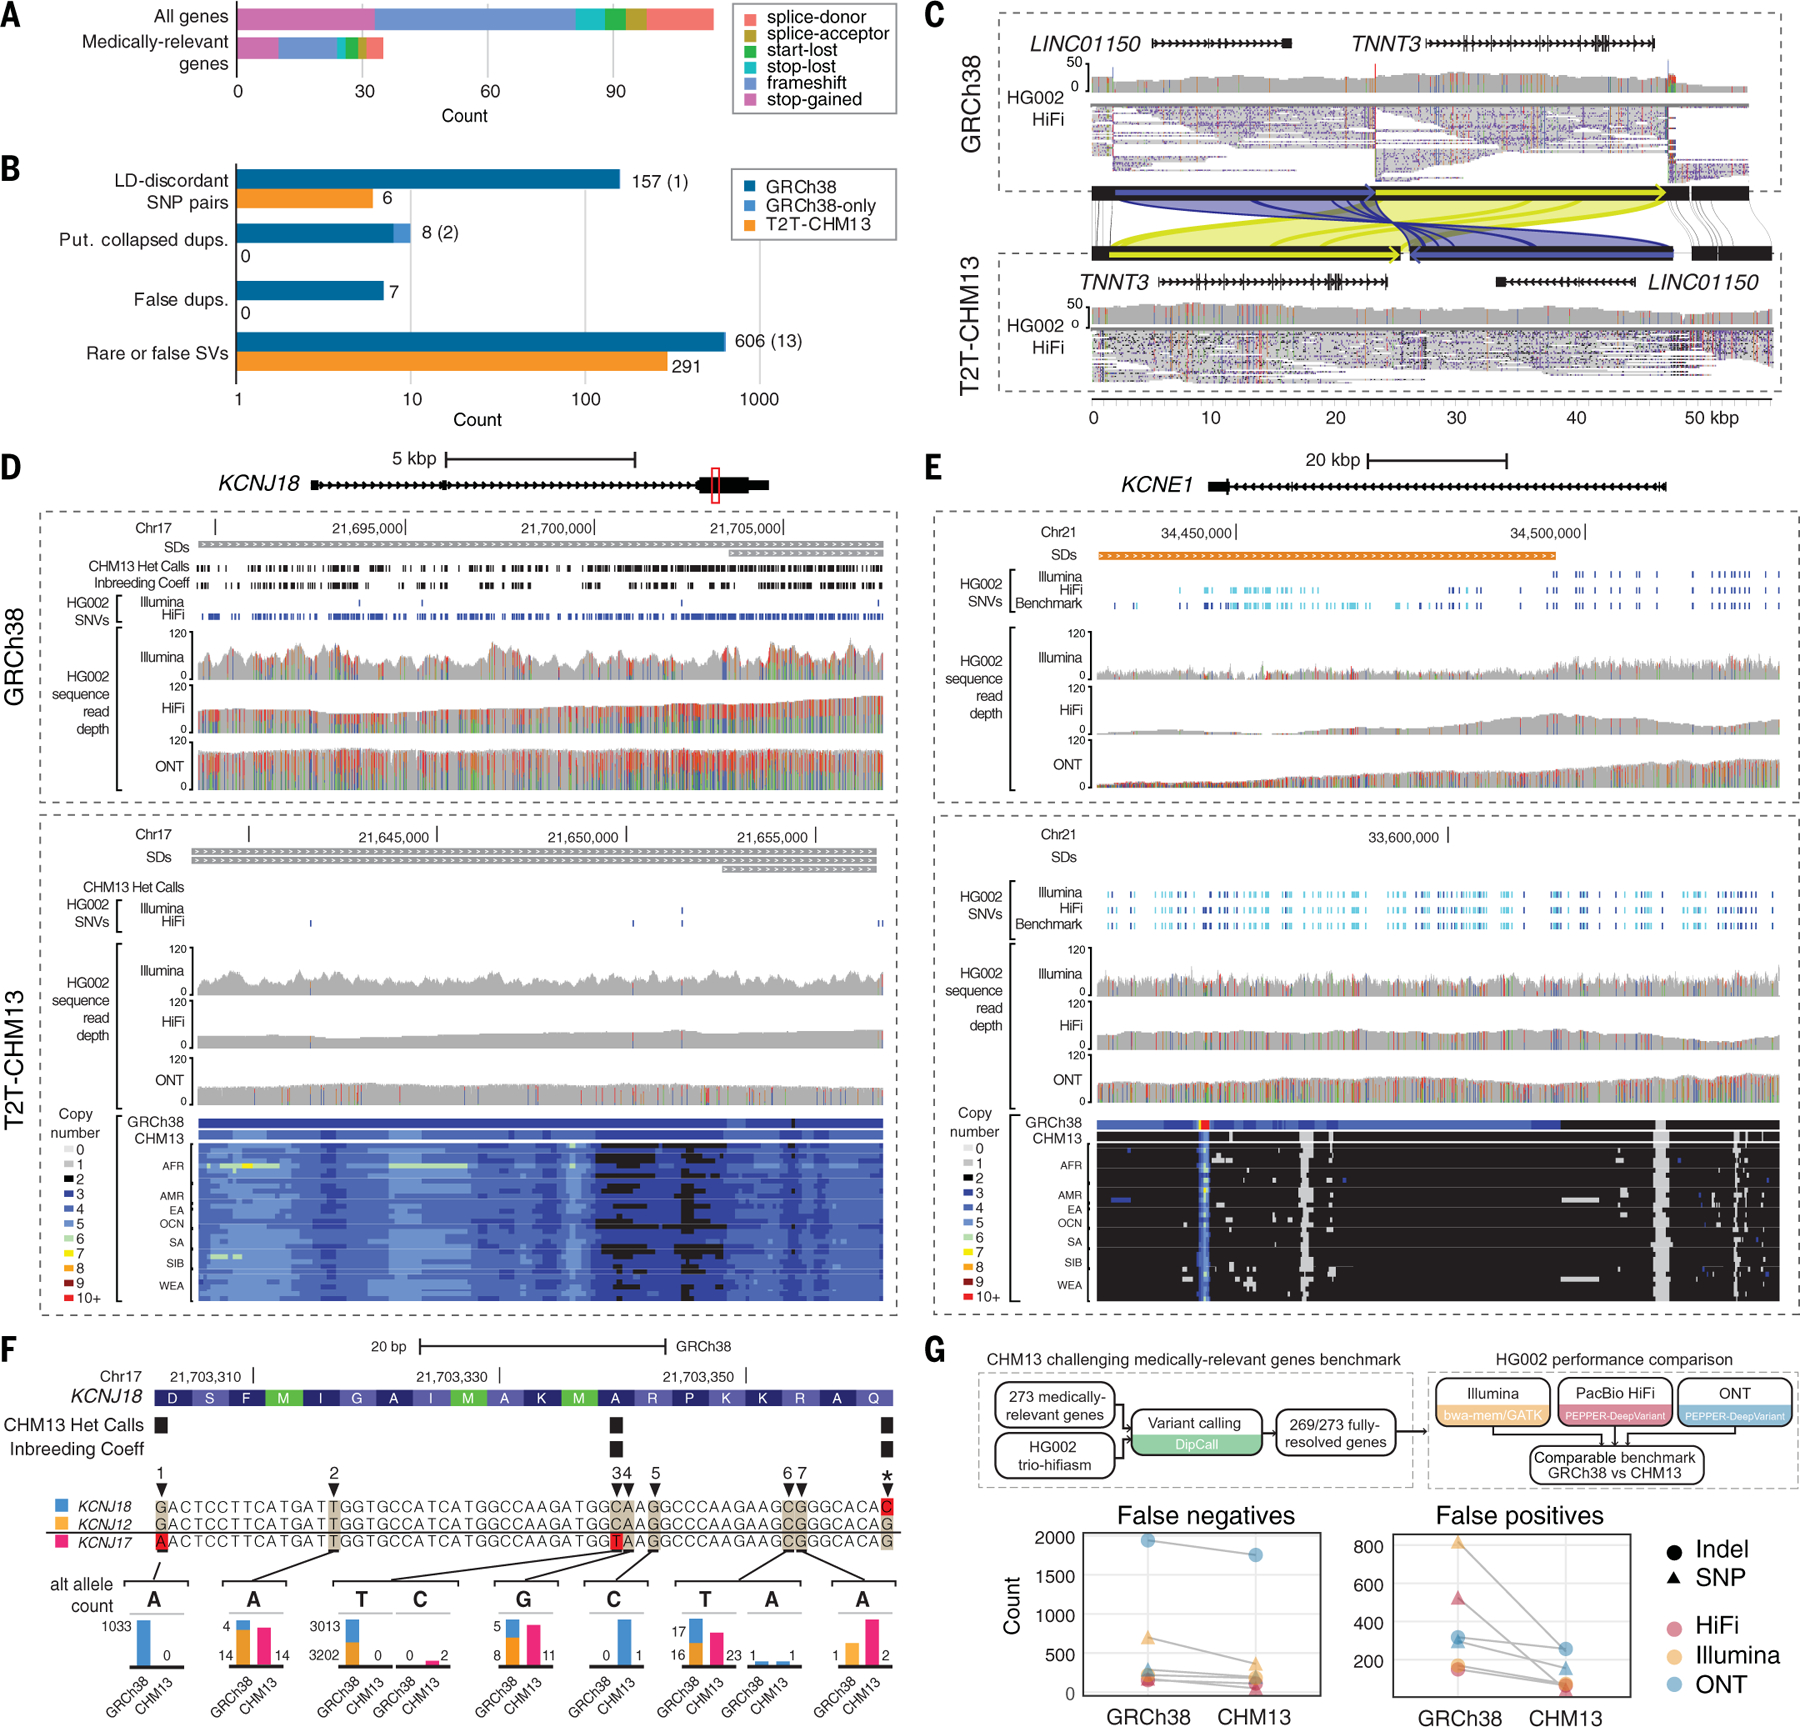
Compared to its predecessors, the Telomere-to-Telomere CHM13 genome adds nearly 200 million base pairs of sequence, corrects thousands of structural errors, and unlocks the most complex regions of the human genome for clinical and functional study. We show how this reference universally improves read mapping and variant calling for 3202 and 17 globally diverse samples sequenced with short and long reads, respectively. We identify hundreds of thousands of variants per sample in previously unresolved regions, showcasing the promise of the T2T-CHM13 reference for evolutionary and biomedical discovery. Simultaneously, this reference eliminates tens of thousands of spurious variants per sample, including reduction of false positives in 269 medically relevant genes by up to a factor of 12. Because of these improvements in variant discovery coupled with population and functional genomic resources, T2T-CHM13 is positioned to replace GRCh38 as the prevailing reference for human genetics.


Conflict of interest statement

Competing interests: C.S.C. is an employee of DNAnexus. J.L. is a former employee and shareholder of Bionano Genomics. S.A. is an employee of Oxford Nanopore Technologies. F.J.S. has received travel funds and spoken at PacBio and Oxford Nanopore Technologies events. K.H.M., S.K., and D.E.M. have received travel funds to speak at symposia organized by Oxford Nanopore Technologies. K.H.M. is a SAB member of Centaura Inc.

Figures

Fig. 1.
Fig. 1.. Genomic comparisons of human assemblies GRCh38 and T2T-CHM13.
(A) Overview of annotations available for GRCh38 and T2T-CHM13 chromosomes 1 and 21 with colors indicated in legends, which are also used in (B) to (D). Colors for mean minimum (min) unique k-mers are defined in the legend with indicated asterisk. Cytobands are pictured as gray bands with red bands representing centromeric regions within ideograms. Complete annotations of all chromosomes can be found in figs. S1 to S4. Local ancestry is denoted using 1KGP superpopulation abbreviations (AFR, African; AMR, admixed American; EAS, East Asian; EUR, European; SAS, South Asian). (B) Summary of the number of bases and/or genes annotated by different features for the assemblies with colors indicated in the legends shown in (A). Note, dbSNP liftover failures (pink) are not annotated in (A). (C) Example of a clone boundary (red line) where GRCh38 possesses a combination of alleles that segregate in negative LD within the 1KGP sample (which we term as an “LD-discordant haplotype”). SNPs are depicted in columns; phased 1KGP samples are depicted in rows. White indicates reference allele genotype; black indicates alternative allele genotypes. Superpopulation ancestry of each sample is indicated in the rightmost column with colors indicated in local ancestry legend shown in (A). CEP104 splice isoforms (blue) are depicted at the bottom. (D) Tally of such LD-discordant haplotypes in a selection of 1KGP individuals, colored by population, as well as GRCh38 and T2T-CHM13. (E) Examples of variants that cannot be lifted over to T2T-CHM13 because of structural differences between the genomes. The position of the reference allele in GRCh38 is shown in red.
Fig. 2.
Fig. 2.. Improvements to short-read mapping and variant calling.
(A) Summary of alignment characteristics aligning to T2T-CHM13 instead of GRCh38. (B) Boxplot of overall number of variants found in each person across superpopulations, with colors indicated in Fig. 1A legend. (C) Boxplot of the number of heterozygous variants found in each person across superpopulations. (D) Boxplot of the number of homozygous variants found in each person across superpopulations. (E) AF distribution of each superpopulation relative to T2T-CHM13 and GRCh38. (F) Change in AF distribution. (G) Number of variants with AF equal to 100%, both within protein-coding genes and without. (H) Number of variants with AF equal to 50%, both within putative collapsed duplications and without. (I) Violin plot of the number of low-quality variants found when aligning to GRCh38 and T2T-CHM13. (J) Violin plot of the number of Mendelian violations found when aligning to GRCh38 and T2T-CHM13.
Fig. 3.
Fig. 3.. Improvements to long-read alignment and SV calling in CHM13.
(A) The coverage, ancestry, and sequencing platforms available for the 17 samples sequenced with long reads (headers: AFR, African; AMR, Admixed American; ASH, Ashkenazi; EAS, East Asian; SAS, South Asian; populations: ACB, African Caribbean in Barbados; ASH, Ashkenazi; CHS, Southern Han Chinese; CLM, Colombian in Medellin, Colombia; GWD, Gambian in Western Division, The Gambia; KHV, Kinh in Ho Chi Minh City, Vietnam; MSL, Mende in Sierra Leone; PJL, Punjabi in Lahore, Pakistan; PUR, Puerto Rican in Puerto Rico). (B) The genome-wide mapping error rate and the standard deviation of the coverage for T2T-CHM13 (orange) and GRCh38 (blue). The standard deviation was computed across each 500-bp bin of the genome. (C) The allele frequency of SVs derived from HiFi data in T2T-CHM13 and GRCh38 among the 17-sample cohort. The red arrows indicate fixed (100% frequency) variants. (D) The balance of insertions (INS) vs. deletion (DEL) calls in the 17-sample cohort in T2T-CHM13 and GRCh38. Variants in T2T-CHM13 are stratified by whether or not they intersect regions which are nonsyntenic with GRCh38. (E) The SV calls in T2T-CHM13 for two trios: a trio of Ashkenazi ancestry [child HG002, and parents HG003 (46XY), and HG004 (46XX)], and a trio of Han Chinese ancestry [child HG005, and parents HG006 (46XY) and HG007 (46XX)]. The red arrows indicate child-only, or candidate de novo, variants (DEL, Deletion; DUP, Duplication; INS, Insertion; INV, Inversion; TRA, Translocation). (F) The density of SVs called from HiFi data in the 17-sample cohort across T2T-CHM13. (G) Alignments of HiFi reads in the HG002 trio to T2T-CHM13 showing a deletion spanning an exon of the transcript AC134980.2 viewed using the Integrative Genomic Viewer (IGV). Pink horizontal rectangles indicate reads aligned to the forward strand; blue horizontal rectangles indicate reads aligned to the reverse strand. Thin black lines indicate split-read alignments. Small vertical rectangles indicate SNVs (H) Alignments of HiFi reads in the HG002 trio to the same region of GRCh38 as shown in (G), showing much poorer mapping to GRCh38 than to T2T-CHM13, viewed using IGV with colors same as (G).
Fig. 4.
Fig. 4.. Characterization of variants within regions of the genome resolved by T2T-CHM13.
(A) Number of bases added in nonsyntenic and previously unresolved regions by chromosome, along with how many variants for each respective region are mappable (have contiguous unique 100mers). (B) Number of variants in nonsyntenic and previously unresolved regions by chromosome. (C) Distance from each previously unresolved–only, nonsyntenic-only, or overlapping region to the closest Clinvar or GWAS Catalog variant. Insets are zoomed to 1 Mbp. (D) Scan for variants in nonsyntenic (light blue and red) and previously unresolved (dark blue and red) regions that exhibit extreme patterns of allele frequency differentiation. Allele frequency outliers were identified for each of eight ancestry components, colored by the superpopulation membership of the corresponding 1KGP samples. Large values of the likelihood ratio statistic (LRS) denote variants for which AF differences in the corresponding ancestry component exceeds that of a null model based on genome-wide covariances in allele frequencies. (E and F) Population-specific allele frequencies of two highly differentiated variants in previously unresolved regions.
Fig. 5.
Fig. 5.. T2T-CHM13 improves clinical genomics variant calling.
(A) Numbers of potential loss-of-function mutations in the T2T-CHM13 reference. (B) The counts of medically relevant genes affected by genomic features and variation in GRCh38 (blue) and T2T-CHM13 (orange) are depicted as bar plots on logarithmic scale. Light blue indicates genes affected in GRCh38 where homologous genes were not identified in T2T-CHM13 due to inability to lift over, with counts included in parentheses. (C) An example erroneous GRCh38 complex SV corrected in T2T-CHM13 affecting TNNT3 and LINC01150, displayed by sequence comparison using miropeats (88) with homologous regions colored in green and blue, respectively. HG002 PacBio HiFi data are displayed showing read coverages and mappings from IGV, with allele fractions of variant sites colored (red, T; green, A; blue, C; black, G) within histograms of read depth (0 to 50). (D and E) Snapshots of regions using IGV and UCSC Genome Browser representing a collapsed duplication in GRCh38 corrected in T2T-CHM13 affecting KCNJ18 (D) and a false duplication in GRCh38 affecting most of KCNE1 (E). SDs depicted on top are colored by sequence similarity to paralog (gray, 90 to 98%; orange, >99%). Read mappings and variants from HG002 Illumina, PacBio HiFi, and ONT (mappings only), with homozygous (light blue) and heterozygous (dark blue) variants depicted as dashes. Colors within histograms of read depth (0–120) are the same as described in (C). Copy number estimates, displayed as colors indicated in legends, across k-merized versions of the GRCh38 and T2T-CHM13 references as well as representative examples of the SGDP individuals. (F) An example CDS region of KCNJ18 (highlighted as a red box in D), with amino acids colored in alternating shades of blue and potential start codons (methionines) labeled in green using the UCSC Genome Browser codon-coloring scheme. Alignments of KCNJ18 (blue), KCNJ12 (orange), and KCNJ17 (pink) along with allele counts of variants in each gene identified on GRCh38 and T2T-CHM13 are shown as bar plots (to approximate scale per variant), with examples 1 to 7 described in table S14. (G) Schematic depicts a benchmark for 269 challenging medically relevant genes for HG002. The number of variant-calling errors from three sequencing technologies on each reference is plotted.

Comment in

References

    1. International Human Genome Sequencing Consortium, Initial sequencing and analysis of the human genome. Nature 409, 860–921 (2001). doi: 10.1038/35057062; - DOI - PubMed
    1. International Human Genome Sequencing Consortium, Finishing the euchromatic sequence of the human genome. Nature 431, 931–945 (2004). doi: 10.1038/nature03001; - DOI - PubMed
    1. Schneider VA et al. , Evaluation of GRCh38 and de novo haploid genome assemblies demonstrates the enduring quality of the reference assembly. Genome Res 27, 849–864 (2017). doi: 10.1101/gr.213611.116; - DOI - PMC - PubMed
    1. Stephens ZD et al. , Big Data: Astronomical or Genomical? PLOS Biol 13, e1002195 (2015). doi: 10.1371/journal.pbio.1002195; - DOI - PMC - PubMed
    1. Sudmant PH et al. , An integrated map of structural variation in 2,504 human genomes. Nature 526, 75–81 (2015). doi: 10.1038/nature15394; - DOI - PMC - PubMed

Publication types