. 2022 May 16;132(10):e154225.
doi: 10.1172/JCI154225.

Neutrophil extracellular traps regulate ischemic stroke brain injury

Affiliations

Neutrophil extracellular traps regulate ischemic stroke brain injury

Frederik Denorme et al. J Clin Invest. .

Abstract

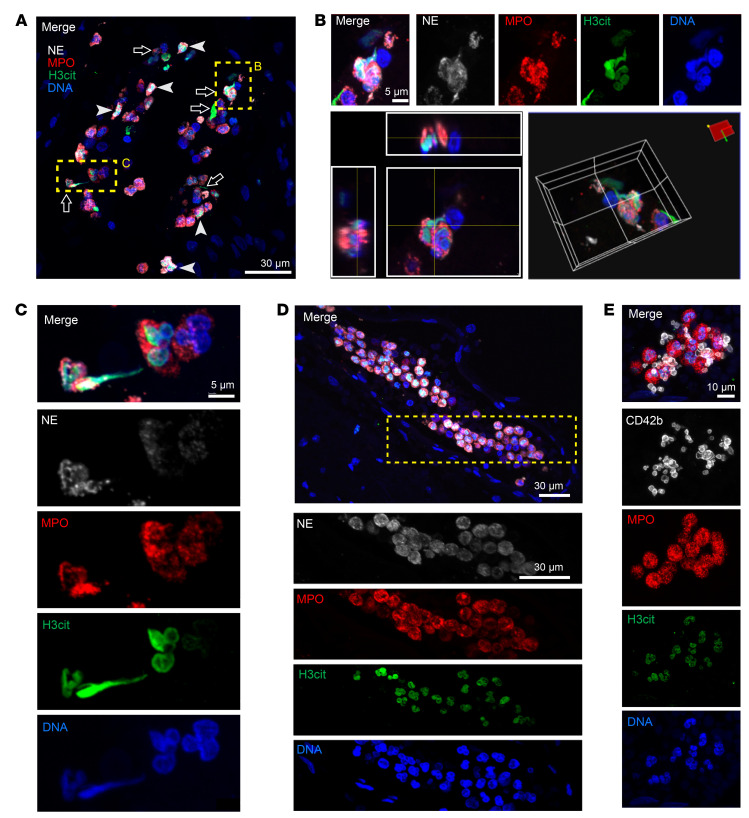
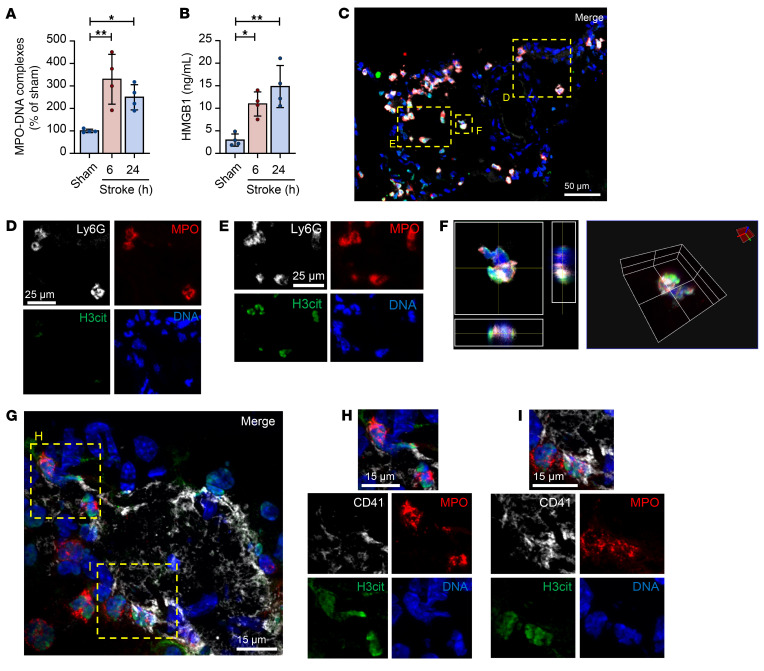
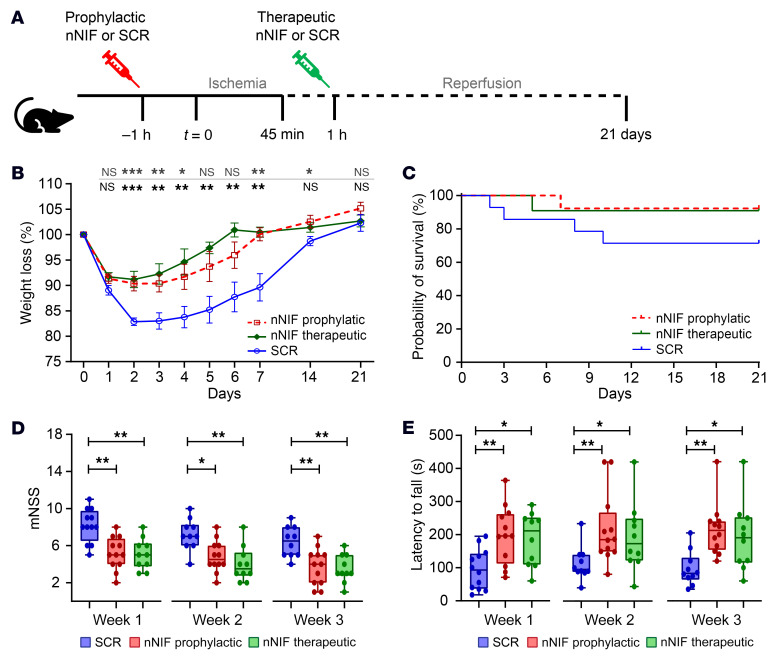
Ischemic stroke prompts a strong inflammatory response, which is associated with exacerbated outcomes. In this study, we investigated mechanistic regulators of neutrophil extracellular trap (NET) formation in stroke and whether they contribute to stroke outcomes. NET-forming neutrophils were found throughout brain tissue of ischemic stroke patients, and elevated plasma NET biomarkers correlated with worse stroke outcomes. Additionally, we observed increased plasma and platelet surface-expressed high-mobility group box 1 (HMGB1) in stroke patients. Mechanistically, platelets were identified as the critical source of HMGB1 that caused NETs in the acute phase of stroke. Depletion of platelets or platelet-specific knockout of HMGB1 significantly reduced plasma HMGB1 and NET levels after stroke, and greatly improved stroke outcomes. We subsequently investigated the therapeutic potential of neonatal NET-inhibitory factor (nNIF) in stroke. Mice treated with nNIF had smaller brain infarcts, improved long-term neurological and motor function, and enhanced survival after stroke. nNIF specifically blocked NET formation without affecting neutrophil recruitment after stroke. Importantly, nNIF also improved stroke outcomes in diabetic and aged mice and was still effective when given 1 hour after stroke onset. These results support a pathological role for NETs in ischemic stroke and warrant further investigation of nNIF for stroke therapy.

Keywords: Hematology; Neutrophils; Platelets; Stroke.


Conflict of interest statement

Conflict of interest: CCY authored a US patent (patent no. 10,232,023 B2, “Methods for treatment of and prophylaxis against inflammatory disorders”) held by the University of Utah for the use of neonatal NET-inhibitory factors, for which PEEL Therapeutics Inc. holds the exclusive license. CCY has also received research support in excess of $50,000 from PEEL Therapeutics.

Figures

Figure 1
Figure 1. NETs are found in ipsilesional brain tissue from ischemic stroke patients.
Ipsilesional brain tissue was obtained from the NIH NeuroBioBank from 3 patients who died after ischemic stroke. (AD) NETs were identified by colocalization of myeloperoxidase (MPO; red), neutrophil elastase (NE; white), citrullinated histone H3 (H3cit; green), and DNA (DAPI; blue). (A) Neutrophils were in different stages of NET formation, with nuclear decondensation and intracellular H3cit staining (arrowheads) and released extracellular NETs (arrows) frequently observed. Scale bar: 30 μm. (B) Top row: High-power magnification image of an extracellular NET with the separate color channels. Bottom left: z projection illustrates colocalization of different NET markers. Bottom right: 3D rendering shows H3cit+ DNA release from a neutrophil. Scale bar: 5 μm. (C) High-power magnification image of 3 neutrophils in different stages of NET formation. Scale bar: 5 μm. (D) Example of an intravascular neutrophil-rich thrombus from a separate patient. Scale bars: 30 μm. (E) NETs were identified by colocalization of MPO (red), H3cit (green), and DNA (DAPI; blue), and platelets were stained with CD42b (white). Scale bar: 10 μm. Platelets associated with NETs within a vessel in the ipsilesional stroke brain are shown. Images are representative of 2 separate patients (AC, patient 1; D and E, patient 2), representing findings from a total of 3 patients.
Figure 2
Figure 2. Plasma markers of immunothrombosis are increased in ischemic stroke patients.
Plasma samples were obtained within 48 hours of hospital admission from stroke patients or age- and sex-matched healthy donors (HD). D-dimer (A), PF4 (B), neutrophil calprotectin (C), H3cit (D), MPO-DNA complexes (E), and DNase activity (F) were measured by ELISA. n = 27 per group. Groups were compared by Mann-Whitney test. **P < 0.01, ***P < 0.001, ****P < 0.0001.
Figure 3
Figure 3. Platelet HMGB1 is increased in ischemic stroke patients and is found at the interface between platelets and neutrophils in ischemic stroke thrombi.
(AC) Flow cytometry was performed on diluted whole blood (A) and washed platelets (B and C) isolated from ischemic stroke patients and matched healthy donors (HD) to quantify platelet-neutrophil aggregates and platelet HMGB1 expression levels, respectively. n = 11–12 per group. (D) Plasma HMGB1 levels were measured by ELISA in ischemic stroke patients and matched healthy donors. n = 27 per group. (E) Ischemic stroke patient thrombi were stained for platelets (CD42b, white), HMGB1 (green), neutrophils (MPO, red) and DNA (DAPI, blue). Scale bar: 10 μm. Image is representative of 7 ischemic stroke thrombi. Groups were compared by unpaired t test (AC) or Mann-Whitney test (D). **P < 0.01, ***P < 0.001, ****P < 0.0001.
Figure 4
Figure 4. Characterization of NET formation in a mouse model of ischemic stroke.
Mice were subjected to 1 hour of tMCAO or sham surgery. Plasma was isolated 6 or 24 hours after stroke onset, and brains were collected and processed for histology. (A) MPO-DNA complexes were measured using an in-house MPO-DNA ELISA. n = 4 per group. (B) Plasma HMGB1 levels were measured by ELISA. n = 4 per group. (C) Brain tissue was stained for the presence of NETs by a combination of Ly6G (white), MPO (red), H3cit (green), and DNA (DAPI, blue). Scale bar: 50 μm. (DF) Both neutrophils not undergoing NET formation (H3cit, highlighted in D) and neutrophils undergoing NET formation (H3cit+, highlighted in E and F) were observed. Scale bars: 25 μm. (GI) Brain tissue was stained for the colocalization of NETs with platelets by a combination of MPO (red), H3cit (green), platelets (CD41, white), and DNA (DAPI, blue). Scale bars: 15 μm. Images are representative of 4 mice. Groups were compared by ordinary 1-way ANOVA. *P < 0.05, **P < 0.01.
Figure 5
Figure 5. Platelets mediate HMGB1 release, contributing to detrimental NET formation in a mouse model of ischemic stroke.
Mice were subjected to 1 hour of tMCAO followed by 23 hours of reperfusion or sham surgery. Plasma was isolated and brains were analyzed for ischemic stroke brain damage by TTC staining 24 hours after stroke onset. Upon TTC staining, live brain tissue will stain red, while dead brain tissue will remain white (outlined with black dotted line). (AD) Immediately after stroke onset, mice were injected with a platelet-depleting antibody or IgG control. Twenty-four hours later, plasma HMGB1 (A) and MPO-DNA complexes (B) were assessed as well as brain infarct volume (C and D). n = 6 for sham mice; n = 9 for groups subjected to stroke. (EG) Immediately after stroke onset, mice were injected with a platelet-depleting antibody. One hour later, either recombinant HMGB1 (rHMGB1) or vehicle was administered. Twenty-four hours after stroke induction, plasma MPO-DNA complexes (E) were assessed as well as brain infarct volume (F and G). n = 7–9 per group. (HK) Twenty-four hours before stroke induction, neutrophils were depleted by i.p. injection of neutrophil-depleting antibodies. Control mice were injected with an IgG control antibody. Twenty-four hours later, plasma HMGB1 (H) and MPO-DNA complexes (I) were assessed as well as brain infarct volume (J and K). n = 7–8 per group. (LN) Twenty-four hours before stroke induction, neutrophils were depleted by i.p. injection of neutrophil-depleting antibodies. One hour after stroke onset, either rHMGB1 or vehicle was administered. Twenty-four hours after stroke induction, plasma MPO-DNA complexes (L) were assessed as well as brain infarct volume (M and N). n = 6–7 per group. Groups were compared by ordinary 1-way ANOVA (A, B, and D) or unpaired t test. *P < 0.05, **P < 0.01, ***P < 0.001.
Figure 6
Figure 6. Platelet-specific HMGB1 knockout blocks platelet-induced NET formation and improves stroke outcomes.
(A and B) Platelets and neutrophils were isolated from 4 healthy donors. Platelets were activated for 15 minutes with convulxin and then incubated for 2.5 hours with neutrophils in the presence of BoxA or vehicle, after which NETs were quantified using a MPO-DNA ELISA. n = 4 per group. (C and D) Platelets were isolated from 3 HMGB1fl/fl (WT) or HMGB1fl/fl PF4-cre (KO) mice, activated with convulxin, and incubated for 2.5 hours with WT neutrophils, after which NETs were quantified using an MPO-DNA ELISA. n = 3 per group. (EJ) HMGB1fl/fl (WT; n = 9) or HMGB1fl/fl PF4-cre (KO; n = 11) mice were subjected to 1 hour of tMCAO followed by 23 hours of reperfusion. Plasma was isolated and brains were analyzed for ischemic stroke brain damage by TTC staining 24 hours after stroke onset. Upon TTC staining, live brain tissue will stain red, while dead brain tissue will remain white (outlined with black dotted line). (E) Plasma HMGB1 levels were measured by ELISA. (F) Plasma NET levels were measured by MPO-DNA complex ELISA. (G and H) Infarct size was determined by TTC staining and planimetric analysis. (I) Neurological score was measured 24 hours after stroke using Bederson’s test. (J) Motor function was assessed 24 hours after stroke using the grip test. Groups were compared by unpaired t test (B, DF, and H) or Mann-Whitney test (I and J). *P < 0.05, **P < 0.01, ***P < 0.001.
Figure 7
Figure 7. Prophylactic treatment with nNIF protects mice from ischemic stroke brain injury.
Mice were subjected to 1 hour of tMCAO followed by 23 hours of reperfusion. Mice were treated with nNIF or SCR 1 hour before and 1 hour after stroke onset (10 mg/kg). Open circles, females; filled circles, males. (A) Brain sections were stained with TTC. Red areas indicate healthy brain tissue; white areas show infarcted brain tissue (outlined with black dotted line). (B) Quantification of brain infarct volumes 24 hours after stroke. (C) Bederson’s test was used to assess neurological outcome 24 hours after stroke. (D) Twenty-four hours after stroke, motor function was measured using the grip test. n = 14 per group. (E) In a separate experiment, mice were followed for up to 7 days after stroke; survival was monitored. n = 9 for SCR; n = 10 for nNIF. (FH) NETs in brain tissue were identified by staining for MPO (red), H3cit (green), and DNA (DAPI; blue). The percentage of NET-forming neutrophils was quantified by counting of H3cit+ neutrophils. n = 5 per group. Scale bar: 50 μm. (I) Plasma NETs were measured 24 hours after stroke using MPO-DNA complex ELISA. n = 7–9 per group. (JL) Brain sections were stained for apoptosis by labeling of DNA strand breaks with TUNEL (green). TUNEL+ cells were counted in the striatum and cortex. n = 5 per group. Scale bar: 100 μm. (MO) Flow cytometric analysis of single-cell suspensions of ipsilesional brain hemispheres. CD45+CD11b+Ly6G+ cells were counted in nNIF- and SCR-treated animals. n = 5–7 per group. (P) Quantification of neutrophil staining with Ly6G in brain sections 24 hours after stroke. n = 5 per group. Groups were compared by unpaired t test (B, H, I, O, and P), Mann-Whitney test (C and D), ordinary 1-way ANOVA (L), or log-rank test (E). *P < 0.05, **P < 0.01, ***P < 0.001, ****P < 0.0001.
Figure 8
Figure 8. Preventing NET formation or degrading NETs improves ischemic stroke outcomes.
Mice were subjected to 1 hour of tMCAO followed by 23 hours of reperfusion. Before ischemic stroke onset, GSK-199 (PAD4 inhibitor to prevent NETs; 30 mg/kg; n = 9), DNase I (to degrade NETs; 2.5 mg/kg; n = 9), or vehicle (n = 10) was injected. (A) Plasma NETs were measured 24 hours after stroke using the MPO-DNA complex ELISA. (B) Brain sections were stained with TTC. Red areas indicate healthy brain tissue, while white areas show infarcted brain tissue (outlined with black dotted line). (C) Quantification of brain infarct volumes 24 hours after stroke. (D) Bederson’s test was used to assess neurological outcome 24 hours after stroke. (E) Twenty-four hours after stroke, motor function was measured using the grip test. Groups were compared by ordinary 1-way ANOVA (A and C) or Kruskal-Wallis test (D and E). *P < 0.05, **P < 0.01.
Figure 9
Figure 9. Prophylactic nNIF protects mice with diabetes and aged mice from ischemic stroke brain injury.
(A and B) Diabetic mice were subjected to 1 hour of tMCAO followed by 23 hours of reperfusion. Mice were treated with nNIF or SCR 1 hour before and 1 hour after stroke onset (10 mg/kg). (A) Brain sections were stained with TTC. Red areas indicate healthy brain tissue, while white areas show infarcted brain tissue (outlined with black dotted line). (B) Quantification of brain infarct volumes 24 hours after stroke. (C) Bederson’s test was used to assess neurological outcome 24 hours after stroke. (D) Twenty-four hours after stroke, motor function was measured using the grip test. n = 7–8 per group. (EH) Aged mice (18 months old) were subjected to 1 hour of tMCAO followed by 23 hours of reperfusion. Mice were treated with nNIF or SCR 1 hour before and 1 hour after stroke onset (10 mg/kg). (E) Brain sections were stained with TTC. Red areas indicate healthy brain tissue, while white areas show infarcted brain tissue (outlined with black dotted line). (F) Quantification of brain infarct volumes 24 hours after stroke. (G) Bederson’s test was used to assess neurological outcome 24 hours after stroke. (H) Twenty-four hours after stroke, motor function was measured using the grip test. n = 7 per group. Groups were compared by unpaired t test (B and F) or Mann-Whitney test (C, D, G, and H). *P < 0.05, **P < 0.01.
Figure 10
Figure 10. nNIF remains effective when administered up until 1 hour after stroke onset.
(AE) Mice were subjected to 1 hour of tMCAO followed by 23 hours of reperfusion. (A) Mice were treated with nNIF or SCR 1 or 2 hours after stroke onset (10 mg/kg). (B) Brain sections were stained with TTC. Red areas indicate healthy brain tissue, while white areas show infarcted brain tissue (outlined with black dotted line). (C) Quantification of brain infarct volumes 24 hours after stroke. (D) Bederson’s test was used to assess neurological outcome 24 hours after stroke. (E) Twenty-four hours after stroke, motor function was measured using the grip test. A higher score indicates better motor function. (FI) Diabetic mice were subjected to 1 hour of tMCAO followed by 23 hours of reperfusion. Mice were treated with nNIF or SCR 1 hour after stroke onset. Twenty-four hours later, brain infarct size (F and G) and neurological (H) and motor (I) function were assessed. n = 6–7 per group. Groups were compared by ordinary 1-way ANOVA (C), Kruskal-Wallis test (D and E), unpaired t test (G), or Mann-Whitney test (H and I). *P < 0.05, **P < 0.01.
Figure 11
Figure 11. Prophylactic and therapeutic nNIF improves long-term stroke outcomes.
Mice were subjected to 45 minutes of tMCAO, after which reperfusion was allowed for 21 days. (A) Mice were treated with SCR (10 mg/kg; n = 14) or nNIF either 1 hour before (prophylactic; 10 mg/kg; n = 13) or 1 hour after stroke onset (therapeutic; 10 mg/kg; n = 11). (B) Weight was measured every day the first week and then every week. (C) Survival was monitored daily for 21 days. (D) Modified neurological severity scoring (mNSS) was performed every week after stroke for 3 weeks. (E) Motor function was assessed on the accelerated rotarod, and latency to fall was recorded every week after stroke for 3 weeks. Groups were compared by 2-way ANOVA (B), log-rank test (C), or Kruskal-Wallis test (D and E). *P < 0.05, **P < 0.01, ***P < 0.001.

References

    1. Virani SS, et al. Heart disease and stroke statistics—2021 update: a report from the American Heart Association. Circulation. 2021;143(8):e254–e743. - PubMed
    1. McCarthy DJ, et al. Long-term outcomes of mechanical thrombectomy for stroke: a meta-analysis. ScientificWorldJournal. 2019;2019:7403104. - PMC - PubMed
    1. Katsanos AH, et al. Mortality risk in acute ischemic stroke patients with large vessel occlusion treated with mechanical thrombectomy. J Am Heart Assoc. 2019;8(21):e014425. doi: 10.1161/JAHA.119.014425. - DOI - PMC - PubMed
    1. de Meyer SF, et al. Thromboinflammation in stroke brain damage. Stroke. 2016;47(4):1165–1172. doi: 10.1161/STROKEAHA.115.011238. - DOI - PubMed
    1. Stark K, Massberg S. Interplay between inflammation and thrombosis in cardiovascular pathology. Nat Rev Cardiol. 2021;18(9):666–682. doi: 10.1038/s41569-021-00552-1. - DOI - PMC - PubMed

Publication types