. 2022 May 9;7(9):e157621.
doi: 10.1172/jci.insight.157621.

Plasma metabolomics reveals disrupted response and recovery following maximal exercise in myalgic encephalomyelitis/chronic fatigue syndrome

Affiliations

Plasma metabolomics reveals disrupted response and recovery following maximal exercise in myalgic encephalomyelitis/chronic fatigue syndrome

Arnaud Germain et al. JCI Insight. .

Abstract

Post-exertional malaise (PEM) is a hallmark symptom of myalgic encephalomyelitis/chronic fatigue syndrome (ME/CFS). We monitored the evolution of 1157 plasma metabolites in 60 ME/CFS (45 female, 15 male) and 45 matched healthy control participants (30 female, 15 male) before and after 2 maximal cardiopulmonary exercise test (CPET) challenges separated by 24 hours, with the intent of provoking PEM in patients. Four time points allowed exploration of the metabolic response to maximal energy-producing capacity and the recovery pattern of participants with ME/CFS compared with the healthy control group. Baseline comparison identified several significantly different metabolites, along with an enriched percentage of yet-to-be identified compounds. Additionally, temporal measures demonstrated an increased metabolic disparity between cohorts, including unknown metabolites. The effects of exertion in the ME/CFS cohort predominantly highlighted lipid-related as well as energy-related pathways and chemical structure clusters, which were disparately affected by the first and second exercise sessions. The 24-hour recovery period was distinct in the ME/CFS cohort, with over a quarter of the identified pathways statistically different from the controls. The pathways that are uniquely different 24 hours after an exercise challenge provide clues to metabolic disruptions that lead to PEM. Numerous altered pathways were observed to depend on glutamate metabolism, a crucial component of the homeostasis of many organs in the body, including the brain.

Keywords: Amino acid metabolism; Carbohydrate metabolism; Glucose metabolism; Metabolism.


Conflict of interest statement

Conflict of interest: The authors have declared that no conflict of interest exists.

Figures

Figure 1
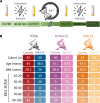
Figure 1. Study design and population statistics.
(A) Overview of the blood collection timeline surrounding 2 maximal cardiopulmonary exercise tests (CPETs) separated by a 24-hour recovery period. (B) Summary of the most representative features of the population. A score of 100 on the Bell scale (2) corresponds to no symptoms at rest, while a score of 0 means continuous symptoms, a bedbound state, and inability to take care of oneself. D1PRE, before exercise on day 1; D1POST, after exercise on day 1; D2PRE, before exercise on day 2; D2POST, after exercise on day 2.
Figure 2
Figure 2. Output from t-SNE using the complete data set.
Each dot represents a single plasma sample. Coloring is specific to each participant.
Figure 3
Figure 3. Bar graph of the number of significantly different metabolites between controls and participants with ME/CFS based on Wilcoxon’s testing, at each time point for the 3 cohorts (total, women, and men), and for 3 statistical cutoffs (q < 0.05, q < 0.15, and P < 0.05).
The bars within the histogram bars represent the number of unknown metabolites for each cohort and each time point.
Figure 4
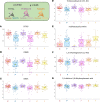
Figure 4. Box plots of metabolites significantly different between female controls and patients at D1PRE for q < 0. 05.
The yellow diamond represents the mean of the logged values. Plots depict the minimum and maximum values (whiskers) and interquartile range (length of filled shape). (AC) Unknowns. (D) Tridecenedioate. (E) Indoleacetoylcarnitine. (F) 1,5-anhydroglucitol (1,5-AG). (G) 3,5-dichloro-2,6-dihydroxybenzoic acid.
Figure 5
Figure 5. Venn diagram of the overlap analysis performed for each cohort between the 4 time points for metabolites statistically different between participants with ME/CFS and controls at P < 0.05.
The numbers shown are percentages to respect the proportionality between the smaller number of metabolites for the male cohort and both the female and total cohort, which have 3 times as many. Darkened percentages are the ones mentioned in the text.
Figure 6
Figure 6. Pathway analysis results using MetaboAnalyst for the female D1PRE time point.
The pathway impact on the y axis from 0 (low impact) to 1 (strong impact) represents the values from the pathway topology analysis. Each circle denotes a pathway, and the fill color represents the significance of disturbances in that pathway from white (low significance) to red (higher significance). The black drop with 1.3 indicates the threshold of significance at P < 0.05.
Figure 7
Figure 7. Pathway analysis results from MetaboAnalyst of ΔD1 versus ΔD2 for female controls and participants with ME/CFS (ΔD1 and ΔD2 result from the subtraction for each participant of the D1PRE or D2PRE values from the D1POST and D2POST values for each metabolite).
The pathway impact on the y axis from 0 (low impact) to 1 (strong impact) represents the values from the pathway topology analysis. Each circle denotes a pathway, and the fill color represents the significance of disturbances in that pathway from white (low significance) to red (higher significance). The black drop with 1.3 indicates the threshold of significance at P < 0.05.
Figure 8
Figure 8. Pathway analysis results from MetaboAnalyst of the recovery period differences between female controls and participants with ME/CFS (the recovery values result from the subtraction for each participant of the D2PRE values from the D1POST values for each metabolite).
The pathway impact on the y axis from 0 (low impact) to 1 (strong impact) represents the values from the pathway topology analysis. Each circle denotes a pathway, and the fill color represents the significance of disturbances in that pathway from white (low significance) to red (higher significance). The black drop with 1.3 indicates the threshold of significance at P < 0.05.
Figure 9
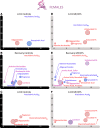
Figure 9. ChemRICH output of D1PRE for the female cohort.
Only clusters enriched at P < 0.05 are shown. The x axis is the cluster order on the similarity tree. The y axis is the –log(P value), with the most significantly altered clusters at the top. The color scale represents the portion of metabolites with a ratio of patients/controls either decreased (in blue) or increased (in red).
Figure 10
Figure 10. ChemRICH output of ΔD1, the 24-hour recovery period, and ΔD2 for female controls and participants with ME/CFS (ΔD1 and ΔD2 result from the subtraction for each participant of the D1PRE or D2PRE values from the D1POST and D2POST values for each metabolite, while the recovery values result from the subtraction for each participant of the D2PRE values from the D1POST values for each metabolite).
(A) ΔD1 controls. (B) Recovery controls. (C) ΔD2 controls. (D) ΔD1 ME/CFS. (E) Recovery ME/CFS. (F) ΔD2 ME/CFS. Only clusters enriched at P < 0.05 are shown. The x axis is the cluster order on the similarity tree. The y axis is the –log(P value), with the most significantly altered clusters at the top. The color scale represents the portion of metabolites with a ratio of patients/controls either decreased (in blue) or increased (in red) or an equal number of metabolites both increased and decreased (in purple).
Figure 11
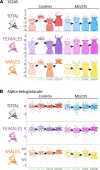
Figure 11. Box plot distribution of logged values for the top 2 metabolites with the most significant differences for controls versus participants with ME/CFS between D1PRE and D1POST.
(A) 15245. (B) Alpha-ketoglutarate. The yellow diamond represents the mean of the logged values. Plots depict the minimum and maximum values (whiskers) and interquartile range (length of filled shape). The black arrows follow the changes of the means of the logged values.
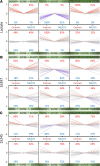
Figure 12
Figure 12. Spaghetti plots showing the amplitude of the variations for selected metabolites between all 4 time points for controls versus patients.
(A) Lactate. (B) 16397. (C) 15245.

References

    1. Institute of Medicine of The National Academies, ed. Beyond Myalgic Encephalomyelitis/Chronic Fatigue Syndrome: Redefining an Illness. National Academies Press; 2015. - PubMed
    1. Bell DS, ed. The Doctor’s Guide to Chronic Fatigue Syndrome: Understanding, Treating, and Living with CFIDS. Addison-Wesley; 1994.
    1. Fukuda K, et al. The chronic fatigue syndrome: a comprehensive approach to its definition and study. International Chronic Fatigue Syndrome study group. Ann Intern Med. 1994;121(12):953–959. doi: 10.7326/0003-4819-121-12-199412150-00009. - DOI - PubMed
    1. Lim EJ, Son CG. Review of case definitions for myalgic encephalomyelitis/chronic fatigue syndrome (ME/CFS) J Transl Med. 2020;18(1):289. doi: 10.1186/s12967-020-02455-0. - DOI - PMC - PubMed
    1. O’Neal AJ, Hanson MR. The enterovirus theory of disease etiology in myalgic encephalomyelitis/chronic fatigue syndrome: a critical review. Front Med (Lausanne) 2021;8:688486. - PMC - PubMed

Publication types