. 2022 Mar 31;20(3):e3001594.
doi: 10.1371/journal.pbio.3001594. eCollection 2022 Mar.

Folliculin promotes substrate-selective mTORC1 activity by activating RagC to recruit TFE3

Affiliations

Folliculin promotes substrate-selective mTORC1 activity by activating RagC to recruit TFE3

Kristina Li et al. PLoS Biol. .

Abstract

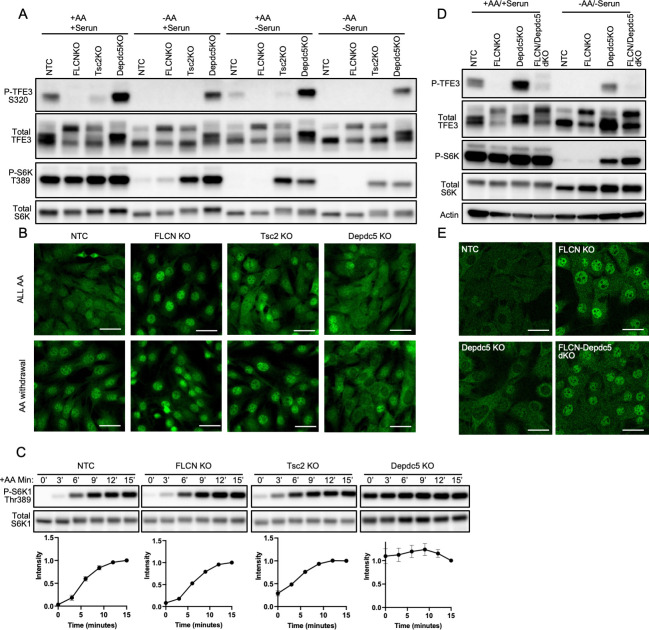
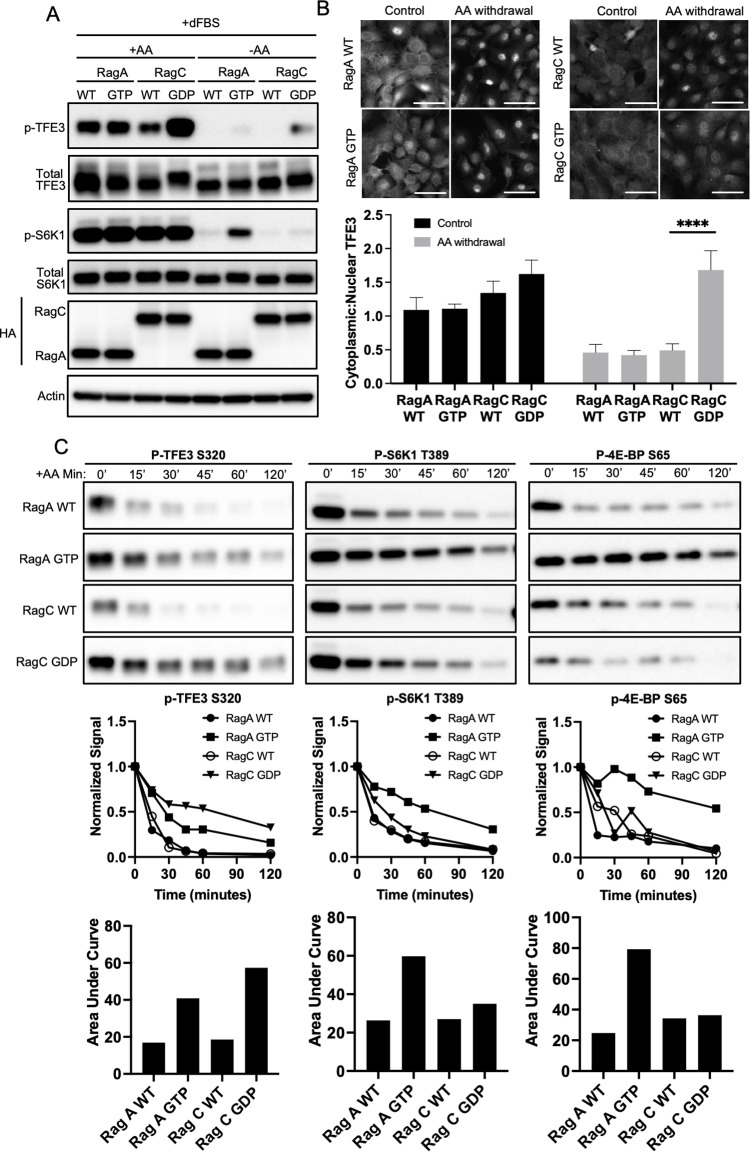
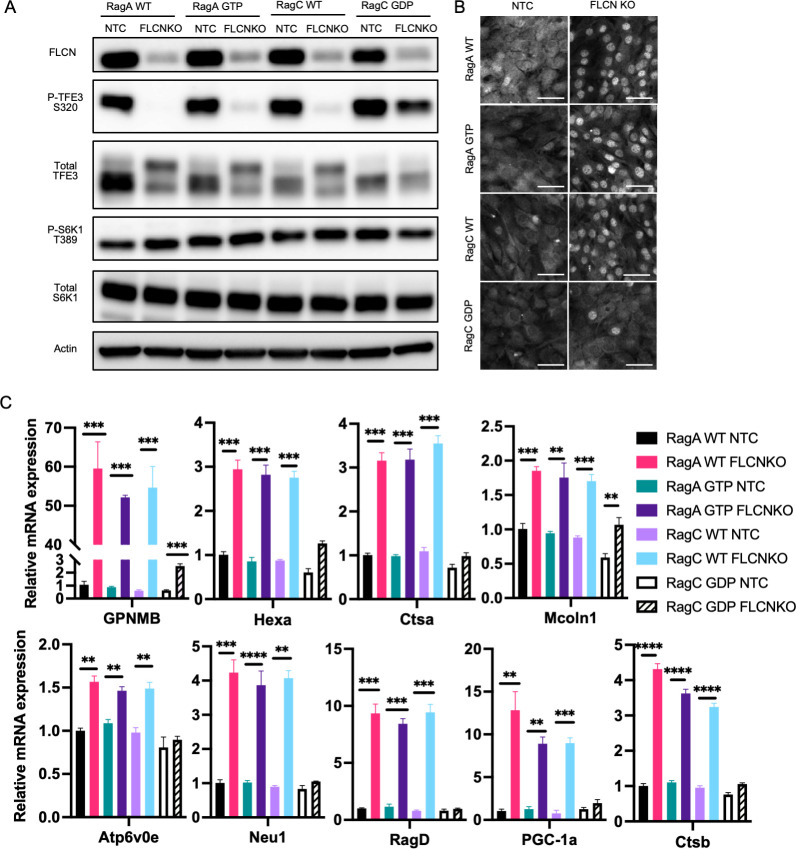
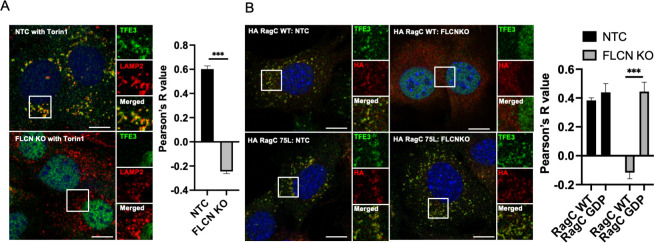
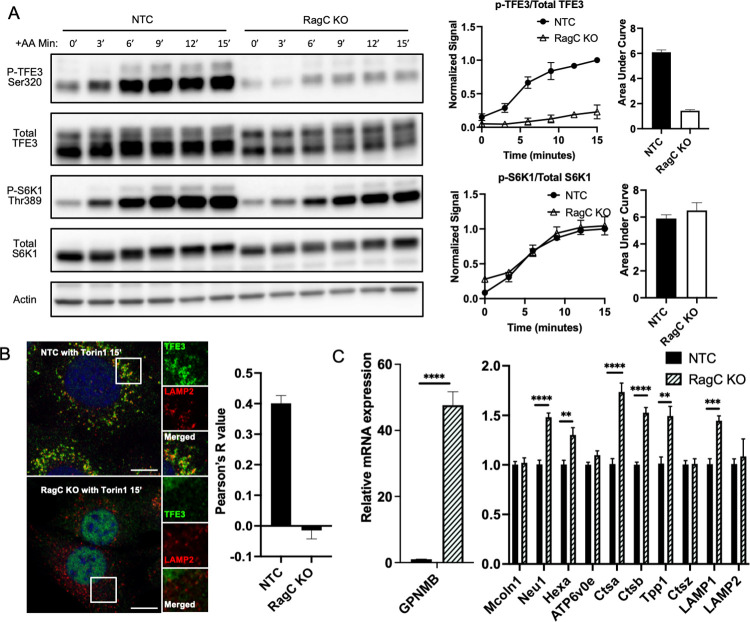
Mechanistic target of rapamycin complex I (mTORC1) is central to cellular metabolic regulation. mTORC1 phosphorylates a myriad of substrates, but how different substrate specificity is conferred on mTORC1 by different conditions remains poorly defined. Here, we show how loss of the mTORC1 regulator folliculin (FLCN) renders mTORC1 specifically incompetent to phosphorylate TFE3, a master regulator of lysosome biogenesis, without affecting phosphorylation of other canonical mTORC1 substrates, such as S6 kinase. FLCN is a GTPase-activating protein (GAP) for RagC, a component of the mTORC1 amino acid (AA) sensing pathway, and we show that active RagC is necessary and sufficient to recruit TFE3 onto the lysosomal surface, allowing subsequent phosphorylation of TFE3 by mTORC1. Active mutants of RagC, but not of RagA, rescue both phosphorylation and lysosomal recruitment of TFE3 in the absence of FLCN. These data thus advance the paradigm that mTORC1 substrate specificity is in part conferred by direct recruitment of substrates to the subcellular compartments where mTORC1 resides and identify potential targets for specific modulation of specific branches of the mTOR pathway.


Conflict of interest statement

The authors have declared that no competing interests exist.

Figures

Fig 1
Fig 1. TFE3 phosphorylation is responsive to AAs, via the GATOR complex.
(A, B) Control C2C12 cells (NTC) or cells lacking Flcn, Tsc2, or Depdc5, as indicated, were switched from complete medium to media lacking serum and/or AAs, as indicated, for 60 minutes, followed by immunoblotting for TFE3, phospho-TFE3, S6K, and phospho-S6K (A) or immunohistochemistry for subcellular localization of TFE3 (B). (C) The same cells as in A, after 60 minutes in medium lacking AAs, were returned to complete media for the indicated time points and immunoblotted for S6K, and phospho-S6K. Values were normalized to the 15-minute time point of each line. (D, E) C2C12 cells lacking Flcn, Depdc5, or both, as indicated, were evaluated as in A and B. The data underlying all the graphs shown in the figure is included in S1 Data. AA, amino acid; FLCN, folliculin; KO, knockout.
Fig 2
Fig 2. RagC, but not RagA, promotes TFE3 phosphorylation in response to AAs.
(A, B) C2C12 cells expressing HA-tagged WT or constitutive active RagA (GTP) or RagC (GDP) were switched from complete medium to media lacking AAs, as indicated, followed by immunoblotting for TFE3, phospho-TFE3, S6K, phospho-S6K, and HA (A) or immunohistochemistry for subcellular localization of TFE3 (B). Quantification of cytoplasmic-to-nuclear ratio of TFE3 is shown below the images. Scale bar: 20 μm, ****p < 0.0001 by Student t test. (C) The same cells as in A, subjected to a time course after withdrawal of AAs, followed by immunoblotting for phospho-TFE3, phospho-4EBP, and phospho-S6K. Densitometric quantification is shown below. The data underlying all the graphs shown in the figure is included in S1 Data. AA, amino acid; dFBS, dialyzed FBS; WT, wild type.
Fig 3
Fig 3. Constitutively active RagC, but not RagA, rescues TFE3 phosphorylation in the absence of FLCN.
(A, B) Control C2C12 cells and cells lacking Flcn were transduced with HA-tagged WT or constitutive active RagA (66L) or RagC (75L), followed by immunoblotting for FLCN, TFE3, phospho-TFE3, S6K, and phospho-S6K (A), immunohistochemistry for subcellular localization of TFE3 (B), or quantitative PCR evaluation of expression of the indicated genes (normalized to the average expression of HPRT, TBP, and 36B4 as controls) (C). Scale bar: 10 μm, **p < 0.01, ***p < 0.001, ****p < 0.0001 by Student t test. The data underlying all the graphs shown in the figure is included in S1 Data. FLCN, folliculin; KO, knockout; WT, wild type.
Fig 4
Fig 4. AA stimulation drives transient localization of TFE3 to lysosome via FLCN and RagC.
(A) Control C2C12 cells and cells lacking Flcn were maintained for 60 minutes in medium lacking AAs and then returned to complete media in the presence of Torin1 for 15 minutes, followed by immunohistochemistry for subcellular localization of TFE3 and LAMP2, a marker of the lysosome. Right: correlation by Pearson’s R of LAMP2 and TFE3 staining. (B) Cells lacking Flcn were transduced with HA-tagged WT or constitutive active RagA (66L) or RagC (75L), followed by immunohistochemistry as in A. ***p < 0.001 by Student t test (n = 3). Scale bar: 10 μm. The data underlying all the graphs shown in the figure is included in S1 Data. AA, amino acid; FLCN, folliculin; KO, knockout; WT, wild type.
Fig 5
Fig 5. RagC is necessary for AA-stimulated TFE3 phosphorylation and localization to lysosome.
(A) Control C2C12 cells and cells lacking RagC were maintained for 60 minutes in medium lacking AAs and then returned to complete media for the indicated times, followed by immunoblotting as indicated. Phospho-TFE3/totalTFE3 and phospho-S6K/totalS6K were quantified and normalized to the 15-minute time point of NTC (control). (B) Control C2C12 cells and cells lacking RagC were cultured with 250 nM Torin1 for 15 minutes, followed by immunohistochemistry for subcellular localization of TFE3 and LAMP2, a marker of the lysosome. (Scale bar: 10 μm). On the right: correlation by Pearson’s R of LAMP2 and TFE3 staining. (C) Quantitative PCR evaluation of expression of the indicated genes (normalized to the average expression of HPRT, TBP, and 36B4 as controls). **p < 0.01, ***p < 0.001, ****p < 0.0001 by Student t test. The data underlying all the graphs shown in the figure is included in S1 Data. AA, amino acid; KO, knockout.

References

    1. Liu GY, Sabatini DM. mTOR at the nexus of nutrition, growth, ageing and disease. Nat Rev Mol Cell Biol. 2020;21(4):183–203. Epub 2020/01/16. doi: 10.1038/s41580-019-0199-y ; PubMed Central PMCID: PMC7102936. - DOI - PMC - PubMed
    1. Condon KJ, Sabatini DM. Nutrient regulation of mTORC1 at a glance. J Cell Sci. 2019;132(21). Epub 2019/11/15. doi: 10.1242/jcs.222570 ; PubMed Central PMCID: PMC6857595. - DOI - PMC - PubMed
    1. Saxton RA, Sabatini DM. mTOR Signaling in Growth, Metabolism, and Disease. Cell. 2017;168 (6):960–76. doi: 10.1016/j.cell.2017.02.004 ; PubMed Central PMCID: PMC5394987 - DOI - PMC - PubMed
    1. Kennedy BK, Lamming DW. The Mechanistic Target of Rapamycin: The Grand ConducTOR of Metabolism and Aging. Cell Metab. 2016;23(6):990–1003. Epub 2016/06/16. doi: 10.1016/j.cmet.2016.05.009 ; PubMed Central PMCID: PMC4910876. - DOI - PMC - PubMed
    1. Ben-Sahra I, Manning BD. mTORC1 signaling and the metabolic control of cell growth. Curr Opin Cell Biol. 2017;45:72–82. Epub 2017/04/16. doi: 10.1016/j.ceb.2017.02.012 ; PubMed Central PMCID: PMC5545101. - DOI - PMC - PubMed

Publication types

MeSH terms

Substances