. 2022 Oct 14;23(4):1200-1217.
doi: 10.1093/biostatistics/kxac005.

Two-stage linked component analysis for joint decomposition of multiple biologically related data sets

Affiliations

Two-stage linked component analysis for joint decomposition of multiple biologically related data sets

Huan Chen et al. Biostatistics. .

Abstract

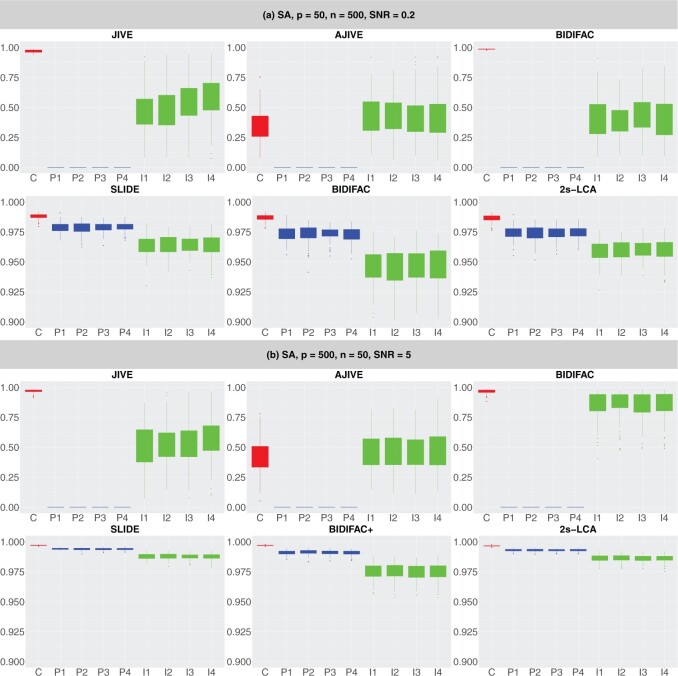
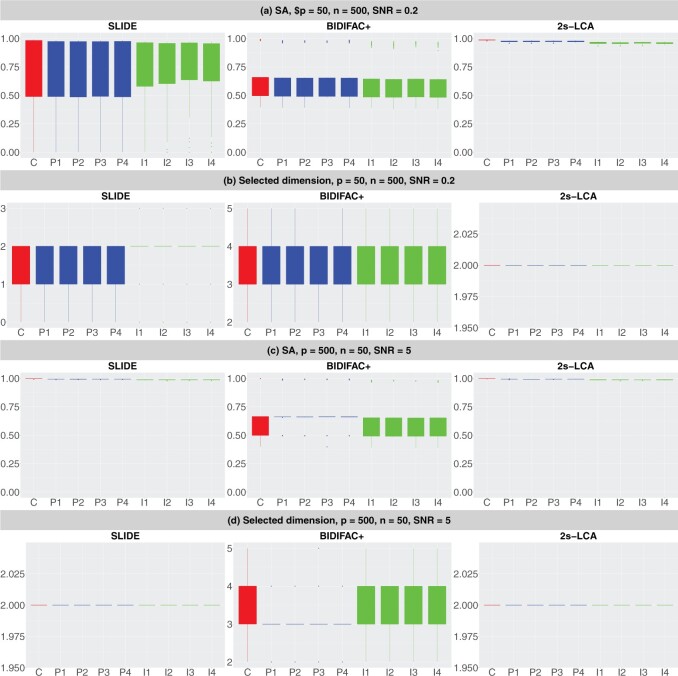
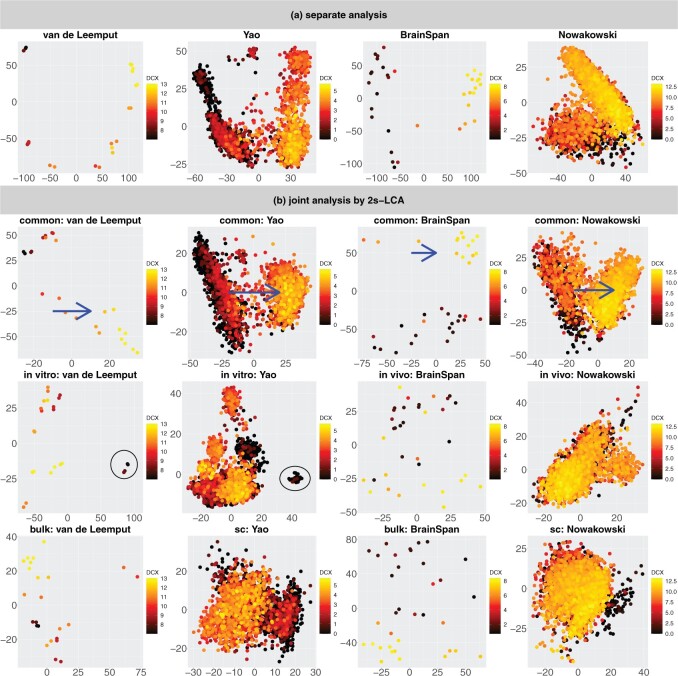
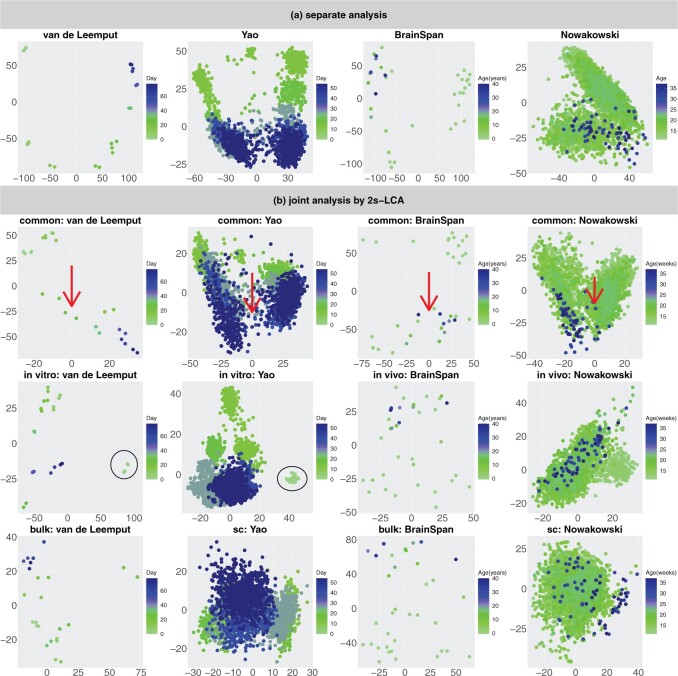
Integrative analysis of multiple data sets has the potential of fully leveraging the vast amount of high throughput biological data being generated. In particular such analysis will be powerful in making inference from publicly available collections of genetic, transcriptomic and epigenetic data sets which are designed to study shared biological processes, but which vary in their target measurements, biological variation, unwanted noise, and batch variation. Thus, methods that enable the joint analysis of multiple data sets are needed to gain insights into shared biological processes that would otherwise be hidden by unwanted intra-data set variation. Here, we propose a method called two-stage linked component analysis (2s-LCA) to jointly decompose multiple biologically related experimental data sets with biological and technological relationships that can be structured into the decomposition. The consistency of the proposed method is established and its empirical performance is evaluated via simulation studies. We apply 2s-LCA to jointly analyze four data sets focused on human brain development and identify meaningful patterns of gene expression in human neurogenesis that have shared structure across these data sets.

Keywords: Integrative methods; Joint decomposition; Low rank models; Multiview data; Principal component analysis.


Figures

Fig. 1.
Fig. 1.
Comparisons between JIVE, AJIVE, BIDIFAC, SLIDE, BIDIFAC+, and 2s-LCA with known dimensions of spaces. (a) and (b) are both under the low-dimensional setting with formula image; (c) and (d) are under high dimensional setting with formula image. For each setting, formula image simulations are run.
Fig. 2.
Fig. 2.
Comparisons between SLIDE, BIDIFAC+ and 2s-LCA. (a) and (b) are both under the low-dimensional setting with formula image; (c) and (d) are under high dimensional setting with formula image. For each setting, formula image simulations are run.
Fig. 3.
Fig. 3.
(a) Scatterplots of scores corresponding to the top two principal components of each data set by separate PCA and (b) Scatterplots of scores of each data set corresponding to common components (top panel), partially shared components associated with environments (middle panel: formula imageformula image on the left two plots and formula imageformula image on the right two plots), and partially shared components associated with technologies (bottom panel: bulk on the left two plots and single cell on the right two plots) by the proposed 2s-LCA. The 4 columns in both parts correspond to the data sets: (1) van de Leemput: formula imageformula image + bulk; (2) Yao: formula imageformula image + single cell; (3) BrainSpan: formula imageformula image + bulk; and (4) Nowakowski: formula imageformula image + single cell. Each point corresponds to either one tissue sample or one cell and is colored by the formula image transformed expression level of the DCX gene. Blue arrows indicate alignment of the first common component (formula image-axis in top row of panels in (b) with DCX expression (neurogenesis) in all four data sets. Black circles indicate pluripotent stem cells, which are present only in the formula imageformula image data sets.
Fig. 4.
Fig. 4.
This figure is a recoloring of the data shown in Figure 3, in order to show effects across time. Each point corresponds to either one tissue sample or one cell and is colored by days of neural differentiation for the formula imageformula image data sets and age in years or gestational weeks for the formula imageformula image data sets. Red arrows indicate alignment of the second common component (formula image-axis in top row of panels in (b) with developmental time in all four data sets. Black circles indicate pluripotent stem cells, which are present only in the formula imageformula image data sets.
Fig. 5.
Fig. 5.
Biological validation by projecting additional data sets onto common components obtained from 2s-LCA. (a) Projection of eight additional scRNA-seq data sets onto the common components with cells colored by the formula image transformed expression level of the DCX gene. Blue arrows indicate alignment of the first common component with DCX expression (neurogenesis). (b) Projection of the same data sets onto the common components with cells colored by time: days of neural differentiation for the formula imageformula image data sets and age in years or gestational weeks for the formula imageformula image data sets. Red arrows indicate alignment of the second common component with developmental time. The Darmanis and others (2015) prenatal study did not specify the exact age of the 4 fetal tissue donors used in their prenatal study, indicating only 16–18 gestational weeks for all samples.

References

    1. Argelaguet, R., Velten, B., Arnol, D., Dietrich, S., Zenz, T., Marioni, J. C., Buettner, F., Huber, W. and Stegle, O. (2018). Multi-omics factor analysis—a framework for unsupervised integration of multi-omics data sets. Molecular Systems Biology 14, e8124. - PMC - PubMed
    1. Bickel, P. J. and Levina, E. (2008). Regularized estimation of large covariance matrices. The Annals of Statistics 36, 199–227.
    1. Bien, J., Bunea, F. and Xiao, L. (2016). Convex banding of the covariance matrix. Journal of the American Statistical Association 111, 834–845. - PMC - PubMed
    1. BrainSpan, BrainSpan. (2011). Atlas of the developing human brain. Secondary BrainSpan: Atlas of the Developing Human Brain.
    1. Bunea, F. and Xiao, L. (2015). On the sample covariance matrix estimator of reduced effective rank population matrices, with applications to fPCA. Bernoulli 21, 1200–1230.

Publication types