. 2022 May 5;109(5):944-952.
doi: 10.1016/j.ajhg.2022.03.009. Epub 2022 Mar 30.

De novo variants in ATP2B1 lead to neurodevelopmental delay

Affiliations

De novo variants in ATP2B1 lead to neurodevelopmental delay

Meer Jacob Rahimi et al. Am J Hum Genet. .

Abstract

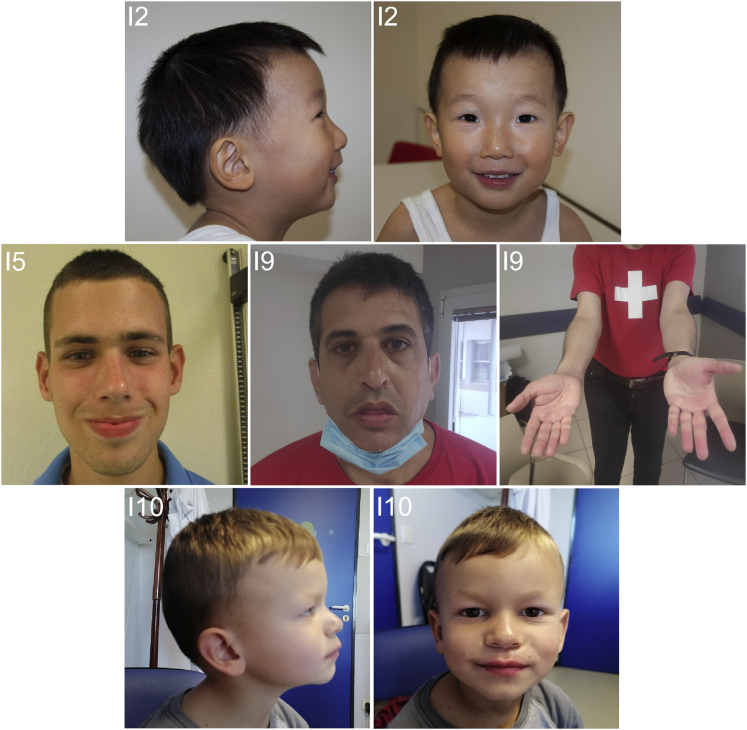
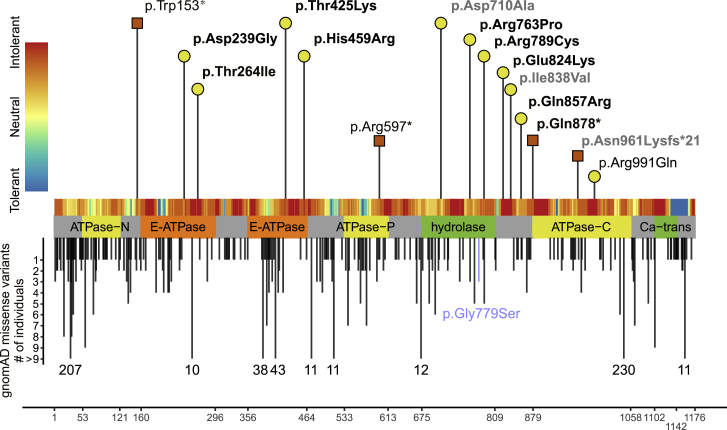
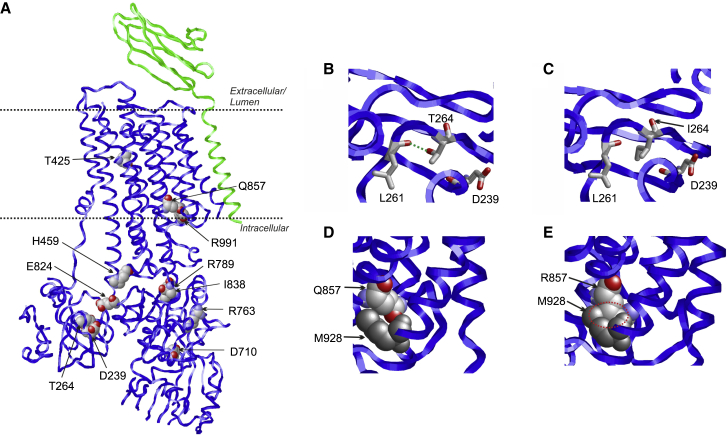
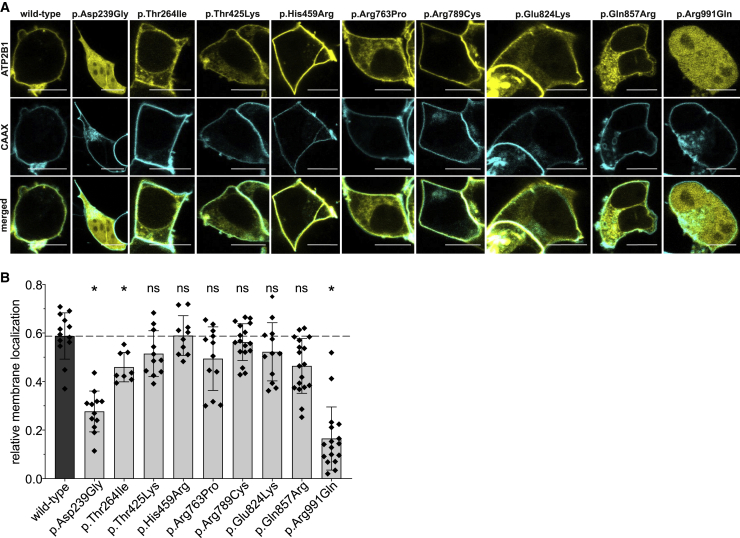
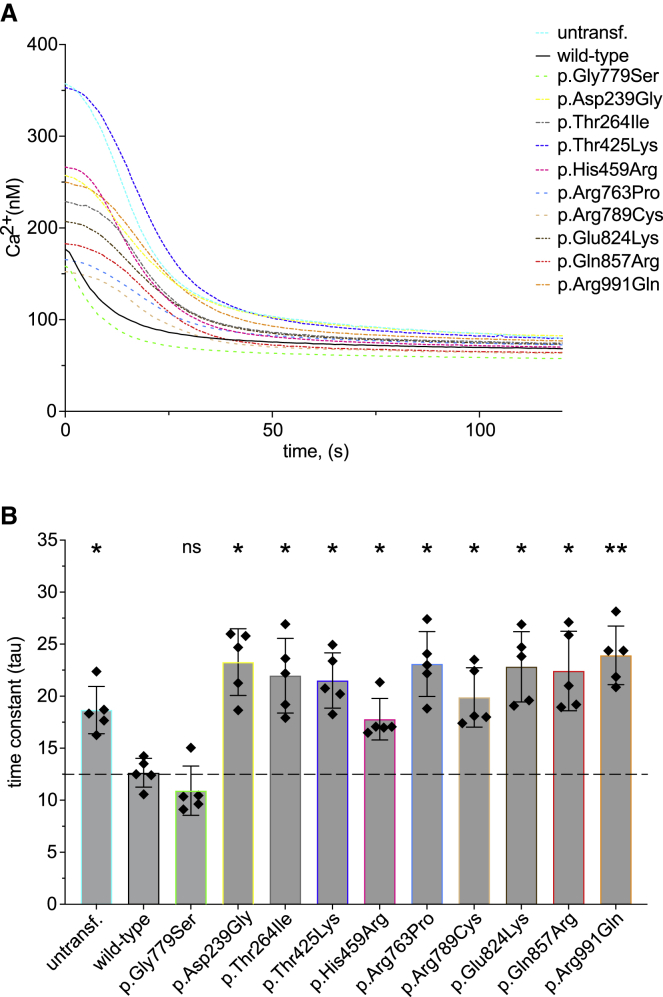
Calcium (Ca2+) is a universal second messenger involved in synaptogenesis and cell survival; consequently, its regulation is important for neurons. ATPase plasma membrane Ca2+ transporting 1 (ATP2B1) belongs to the family of ATP-driven calmodulin-dependent Ca2+ pumps that participate in the regulation of intracellular free Ca2+. Here, we clinically describe a cohort of 12 unrelated individuals with variants in ATP2B1 and an overlapping phenotype of mild to moderate global development delay. Additional common symptoms include autism, seizures, and distal limb abnormalities. Nine probands harbor missense variants, seven of which were in specific functional domains, and three individuals have nonsense variants. 3D structural protein modeling suggested that the variants have a destabilizing effect on the protein. We performed Ca2+ imaging after introducing all nine missense variants in transfected HEK293 cells and showed that all variants lead to a significant decrease in Ca2+ export capacity compared with the wild-type construct, thus proving their pathogenicity. Furthermore, we observed for the same variant set an incorrect intracellular localization of ATP2B1. The genetic findings and the overlapping phenotype of the probands as well as the functional analyses imply that de novo variants in ATP2B1 lead to a monogenic form of neurodevelopmental disorder.

Keywords: ATP2B1; abnormal behavior; calcium homeostasis; de novo; development delay; intellectual disability; neurodevelopmental disorder; seizure.


Conflict of interest statement

Declaration of interests R.P. is an employee of GeneDx, Inc. All other authors declare no competing interests.

Figures

Figure 1
Figure 1
Photos of individuals with ATP2B1 variants No shared dysmorphic features in four individuals (for individual numbering, see Table 1).
Figure 2
Figure 2
Variants in ATP2B1 Location of missense and loss-of-function variant in ATP2B1 with respect to the domain structure of ATP2B1 (GenBank: NM_001001323.2). The x axis represents the corresponding amino acid position of ATP2B1. Variants reported in this study are labeled with the corresponding p-code and are indicated by a yellow circle (missense) or a red square (loss of function). Confirmed de novo variants are indicated in bold. Deciphering Developmental Disorders study variants with a lacking detailed phenotypic description are indicated in gray (see also Table S1 and supplemental methods). Missense variants in gnomAD with allele count are shown below the protein scheme. The gnomAD variant p.Gly779Ser, which was used as negative control for the Ca2+ imaging experiments, is blue color-coded. The tolerance landscape (MetaDome18) is shown color-coded above the protein scheme. Abbreviations: ATPase-N, cation transporter/ATPase, N terminus; ATPase-P, cation transport ATPase (P-type); ATPase-C, cation transporter/ATPase, C terminus; E-ATPase, E1-E2 ATPase; hydrolase, haloacid dehalogenase-like hydrolase; Ca-trans, plasma membrane calcium transporter ATPase C-terminal.
Figure 3
Figure 3
Structural effects in ATP21B1 (A) Structure of ATP2B1 (PDB: 6A6919) indicating the sites of genetic variants. The ATP2B1 structure is shown as blue ribbon and the neuroplastin subunit in green. Sites of genetic variants are shown in space-filled presentation (atom-type coloring) and labeled. The location of the membrane is indicated by two dotted lines. (B) Enlargement of the ATP2B1 structure showing the effect of the p.T264Ile and p.Gln857Arg variants. (B) T264 forms a hydrogen bond (green dotted line) to L261. (C) In the p.Thr264Ile variant, this hydrogen bond cannot be formed by the nonpolar isoleucine sidechain. (D) Q857 is in close spatial proximity to M928 (shown in gray). (E) The bulkier R857 sidechain of the variant causes steric clashes (red dotted circle) with M928 leading to a destabilization of ATP2B1.
Figure 4
Figure 4
Subcellular localization of transiently overexpressed ATP2B1 variants (A) Representative confocal laser scanning microscopy images of transfected HEK293 cells expressing YFP-fused ATP2B1 and a CAAX-box-modified cyan fluorescent protein. Scale bars: 10 μm. (B) Quantification of relative membrane localization (for details, see supplemental methods). Data presented as mean and standard deviation from 8 to 17 independent analyzed cells. Data are shown as mean ± standard deviation represented by error bars. The results of a one-way ANOVA with the Games-Howell post-hoc test (each compared to wild type) is indicated as: p < 0.05; ns: p > 0.05.
Figure 5
Figure 5
De novo missense variants in ATP2B1 affect Ca2+ transport (A) Fluorometric [Ca2+]i analysis (for details, see supplemental methods) in untransfected (untransf.) HEK293 cells and cells expressing wild-type or mutated ATP2B1. Data are shown as mean [Ca2+]i from five independent experiments after loading of the [Ca2+]i indicator dye fura-2/AM and the final addition of EGTA (for a representative complete sequence of the experiment, see Figure S2). (B) In order to investigate the Ca2+ transport of transfected HEK293, time-dependent [Ca2+]i decline was analyzed after final addition of EGTA that is represented by the time constant tau. Data presented as mean and standard deviation from five independent experiments. As negative control served the likely non-pathogenic variant (3 times in gnomAD) p.Gly779Ser. The dashed line indicates the median tau value of ATP2B1 wild type. Data are shown as mean ± standard deviation represented by error bars. The results of a one-way ANOVA with the Games-Howell post-hoc test (each compared to wild type) is indicated as: ∗∗p < 0.005; p < 0.05; ns: p > 0.05.

References

    1. McRae J.F., Clayton S., Fitzgerald T.W., Kaplanis J., Prigmore E., Rajan D., Sifrim A., Aitken S., Akawi N., Alvi M., et al. Prevalence and architecture of de novo mutations in developmental disorders. Nature. 2017;542:433–438. - PMC - PubMed
    1. Gilissen C., Hehir-Kwa J.Y., Thung D.T., van de Vorst M., van Bon B.W., Willemsen M.H., Kwint M., Janssen I.M., Hoischen A., Schenck A., et al. Genome sequencing identifies major causes of severe intellectual disability. Nature. 2014;511:344–347. - PubMed
    1. Aspromonte M.C., Bellini M., Gasparini A., Carraro M., Bettella E., Polli R., Cesca F., Bigoni S., Boni S., Carlet O., et al. Characterization of intellectual disability and autism comorbidity through gene panel sequencing. Hum. Mutat. 2019;40:1346–1363. - PMC - PubMed
    1. Kochinke K., Zweier C., Nijhof B., Fenckova M., Cizek P., Honti F., Keerthikumar S., Oortveld M.A.W., Kleefstra T., Kramer J.M., et al. Systematic Phenomics Analysis Deconvolutes Genes Mutated in Intellectual Disability into Biologically Coherent Modules. Am. J. Hum. Genet. 2016;98:149–164. - PMC - PubMed
    1. Brini M., Calì T., Ottolini D., Carafoli E. Neuronal calcium signaling: function and dysfunction. Cell. Mol. Life Sci. 2014;71:2787–2814. - PMC - PubMed

Publication types

MeSH terms

Substances