. 2022 Jun:167:52-66.
doi: 10.1016/j.yjmcc.2022.03.001. Epub 2022 Mar 28.

Enhanced NCLX-dependent mitochondrial Ca2+ efflux attenuates pathological remodeling in heart failure

Affiliations

Enhanced NCLX-dependent mitochondrial Ca2+ efflux attenuates pathological remodeling in heart failure

Joanne F Garbincius et al. J Mol Cell Cardiol. 2022 Jun.

Abstract

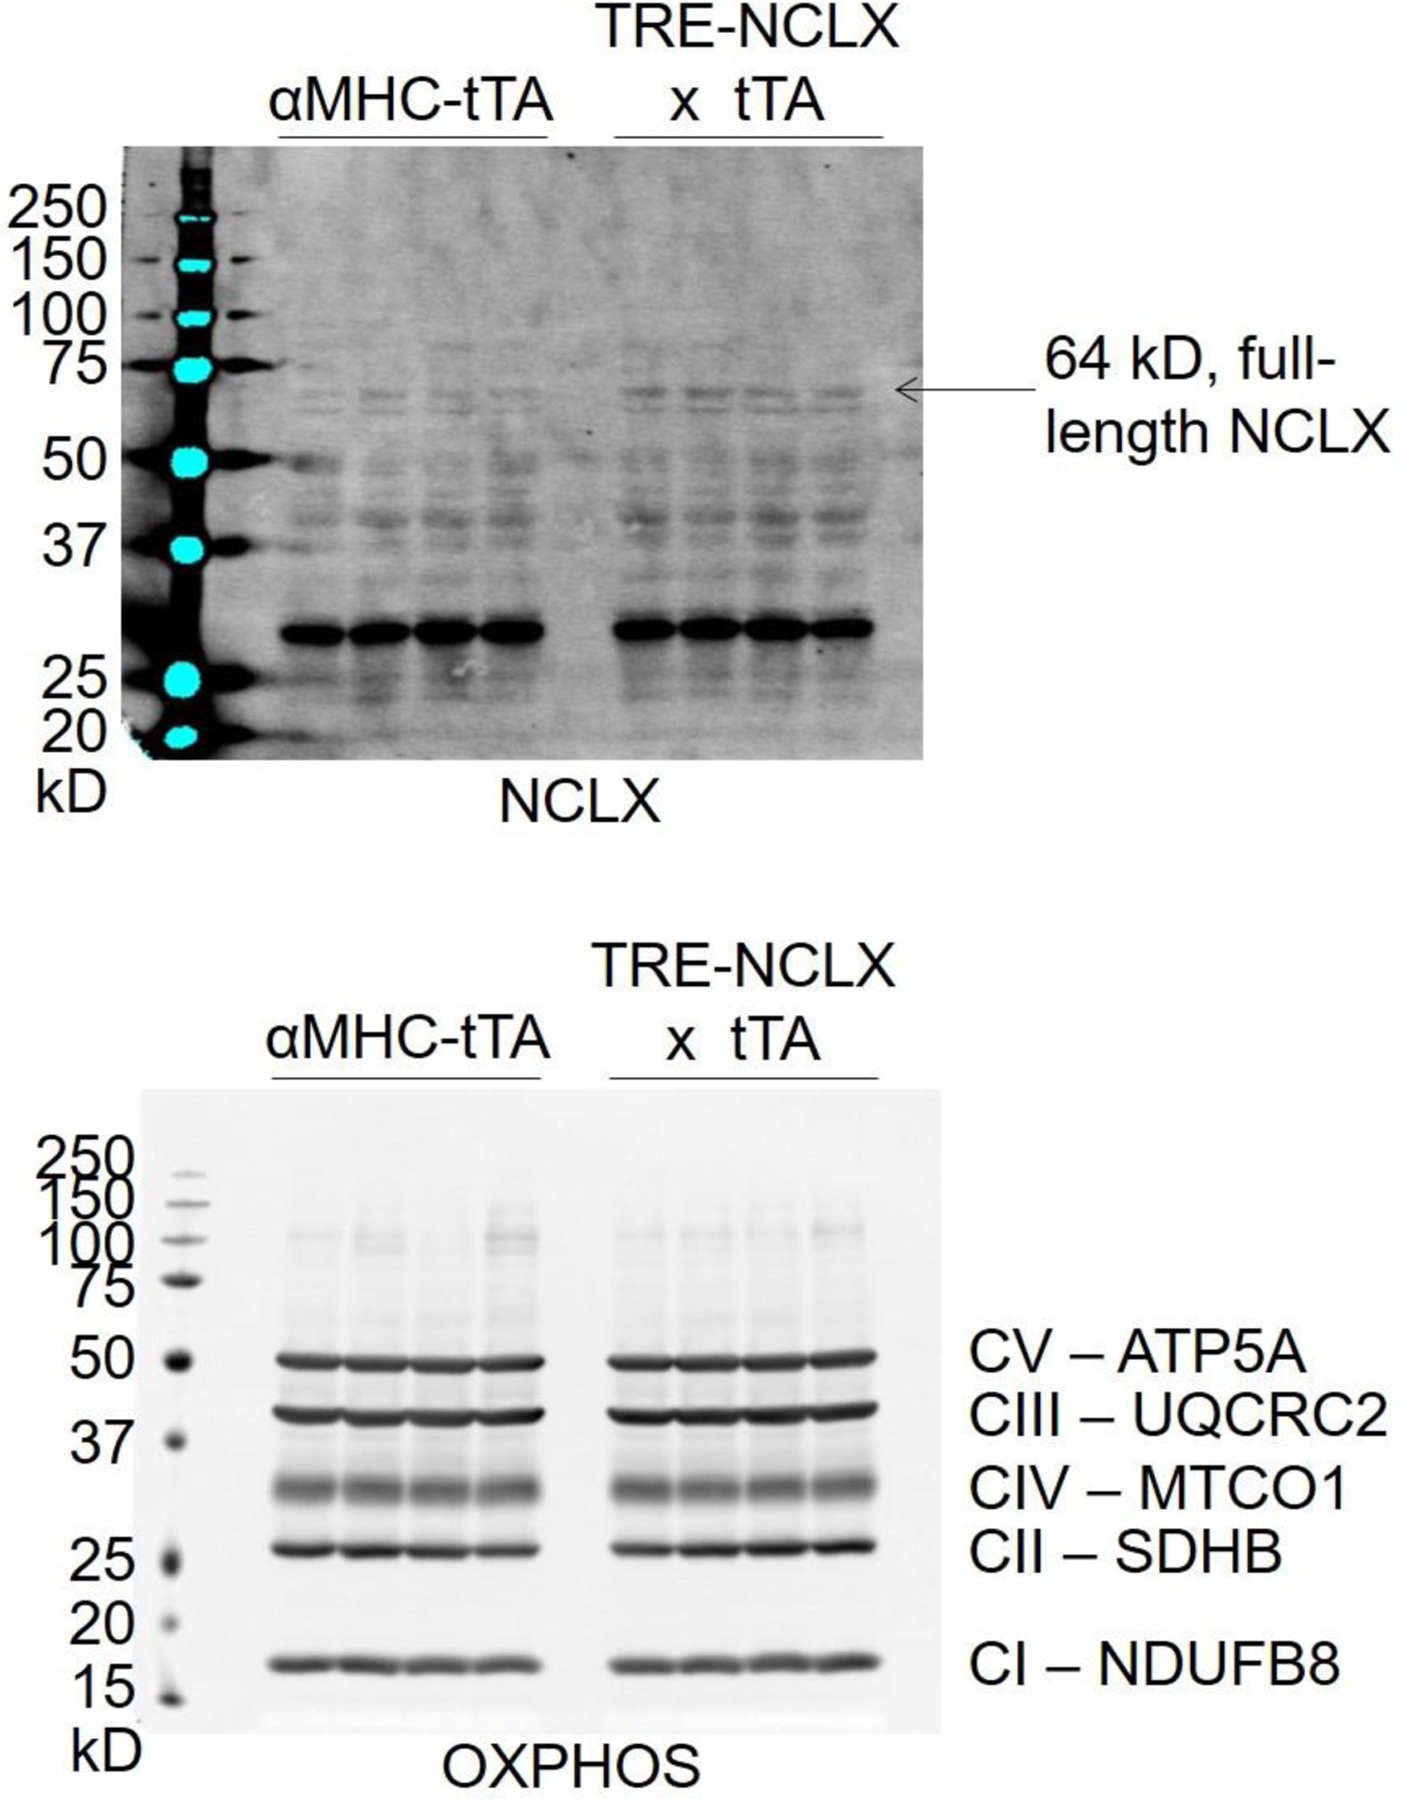
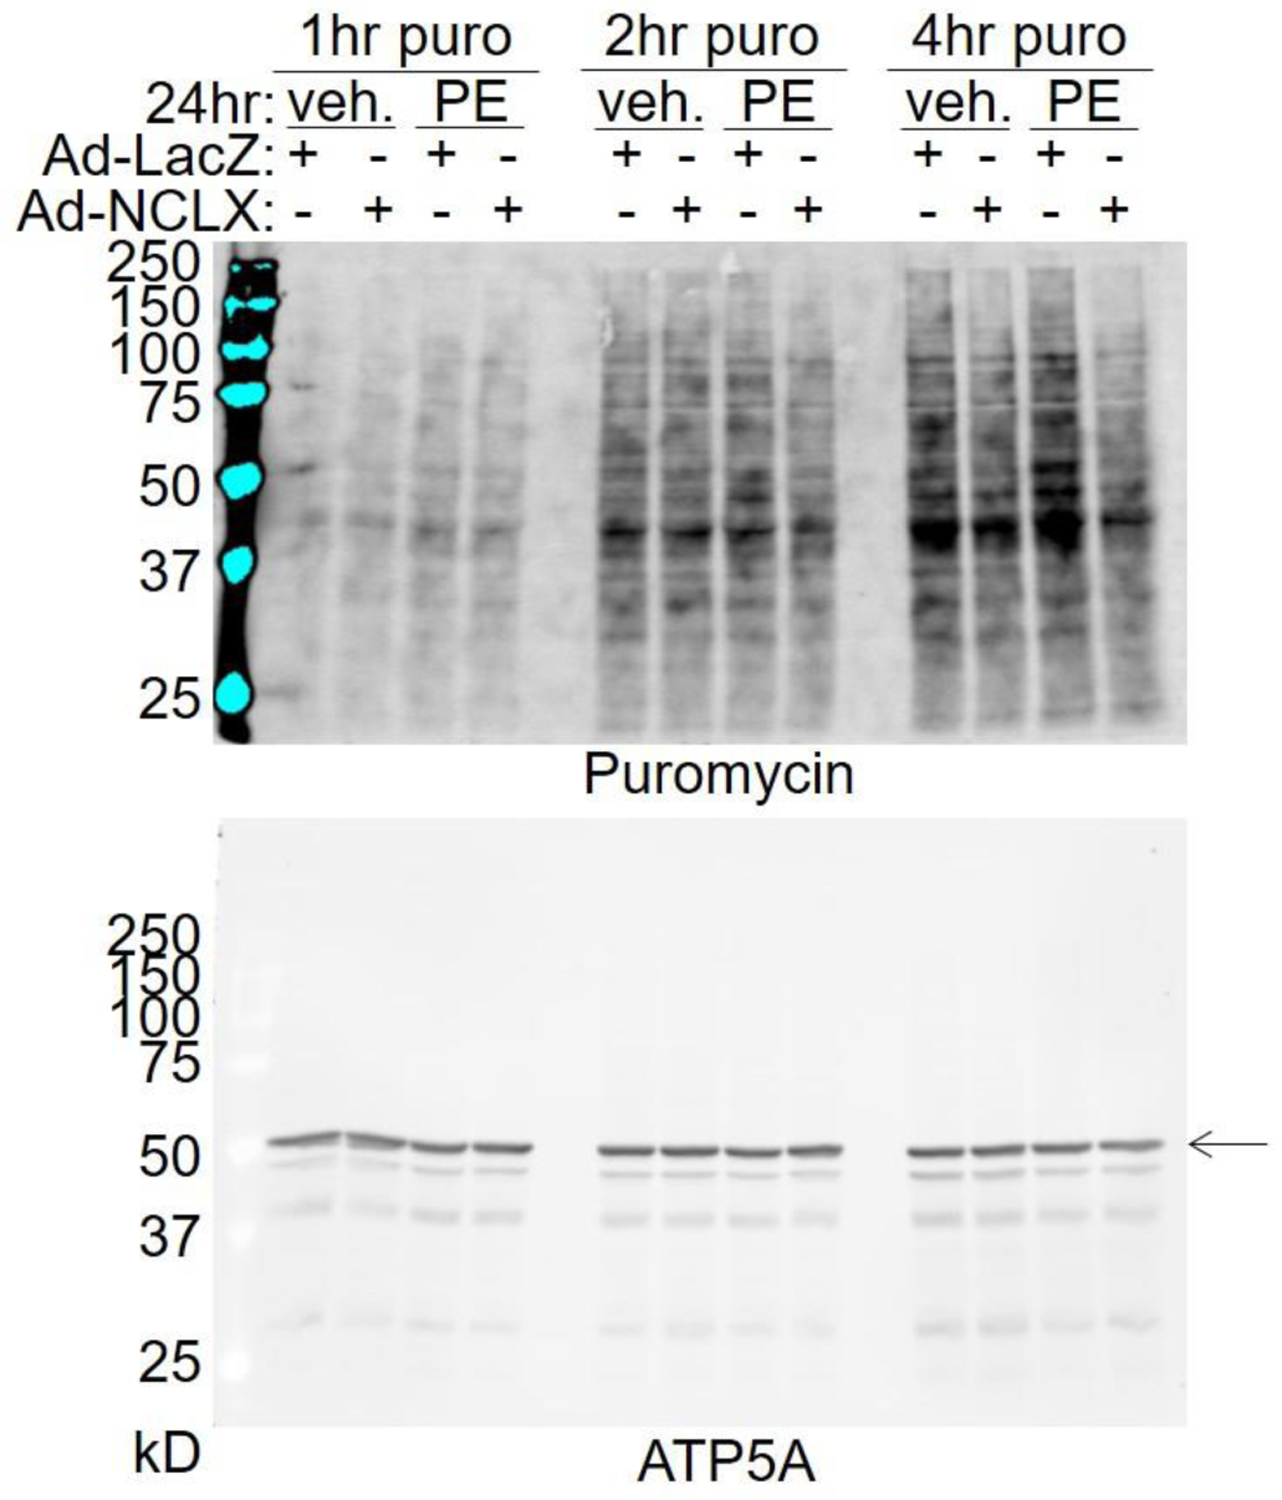
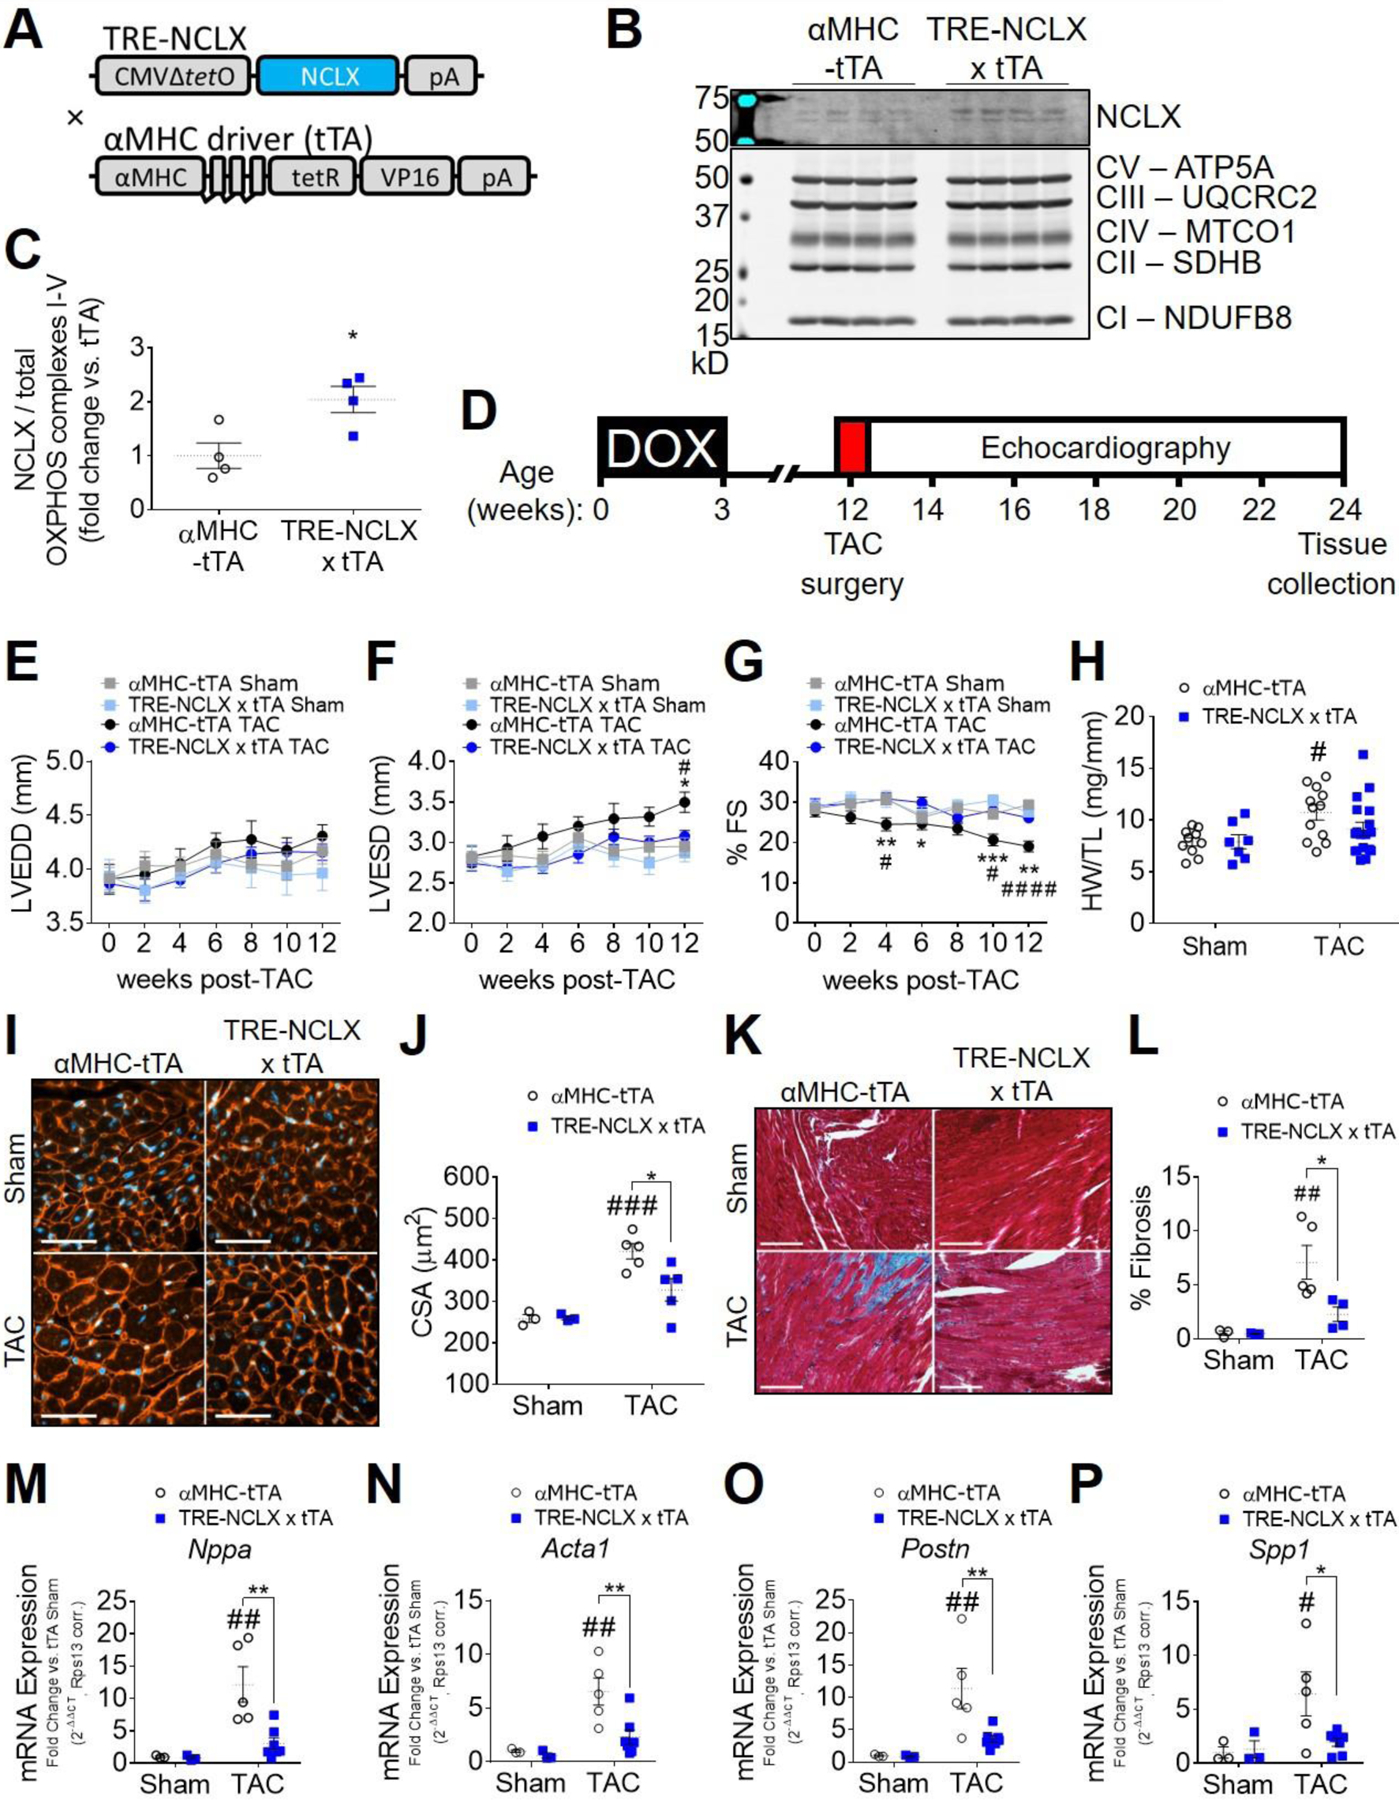
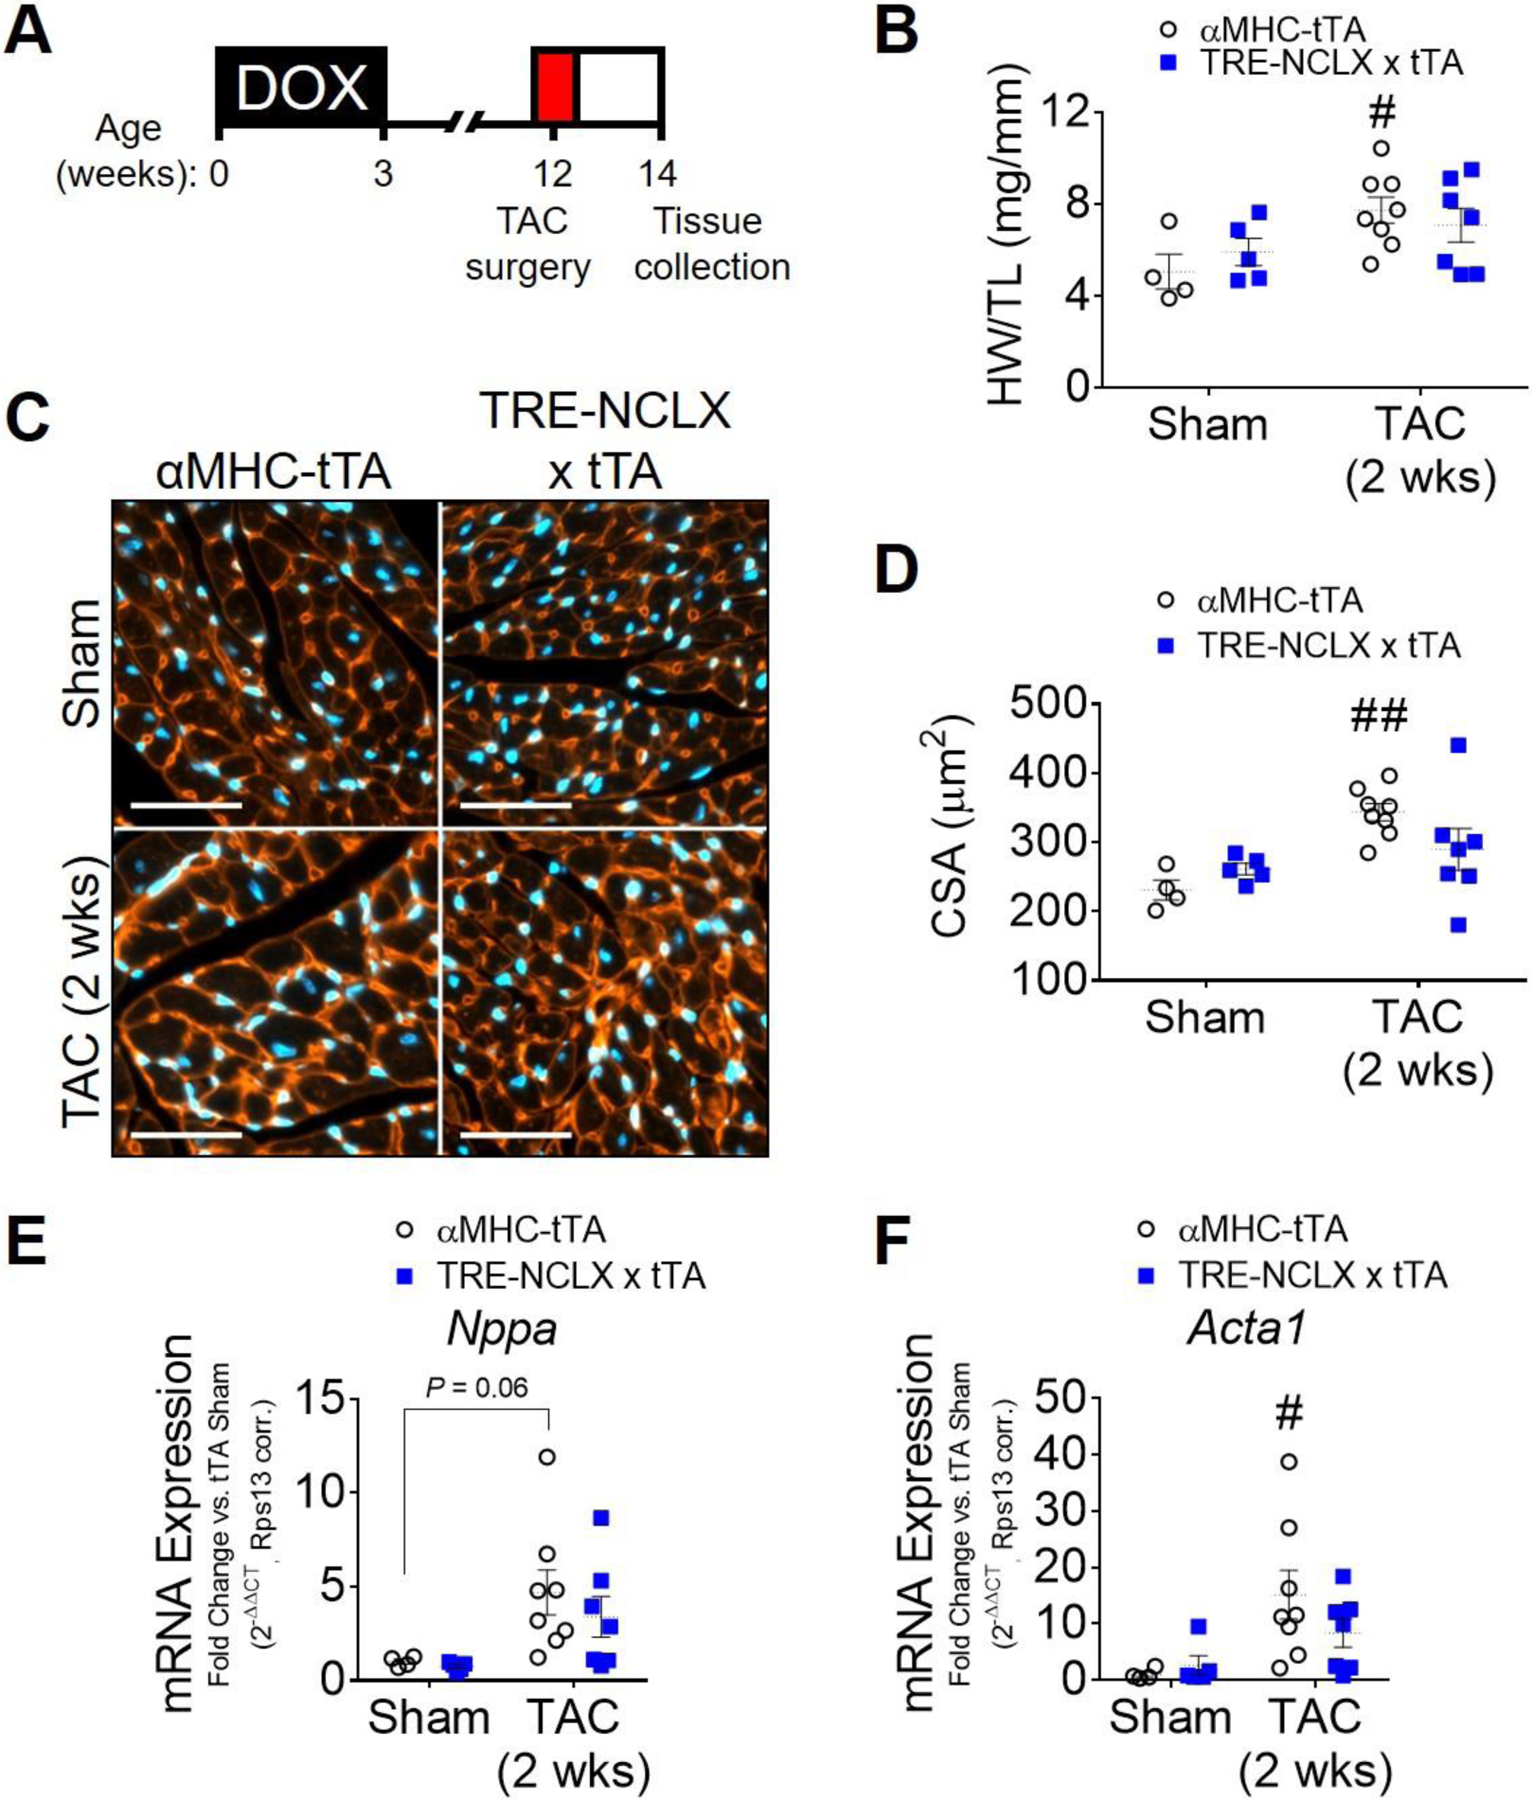
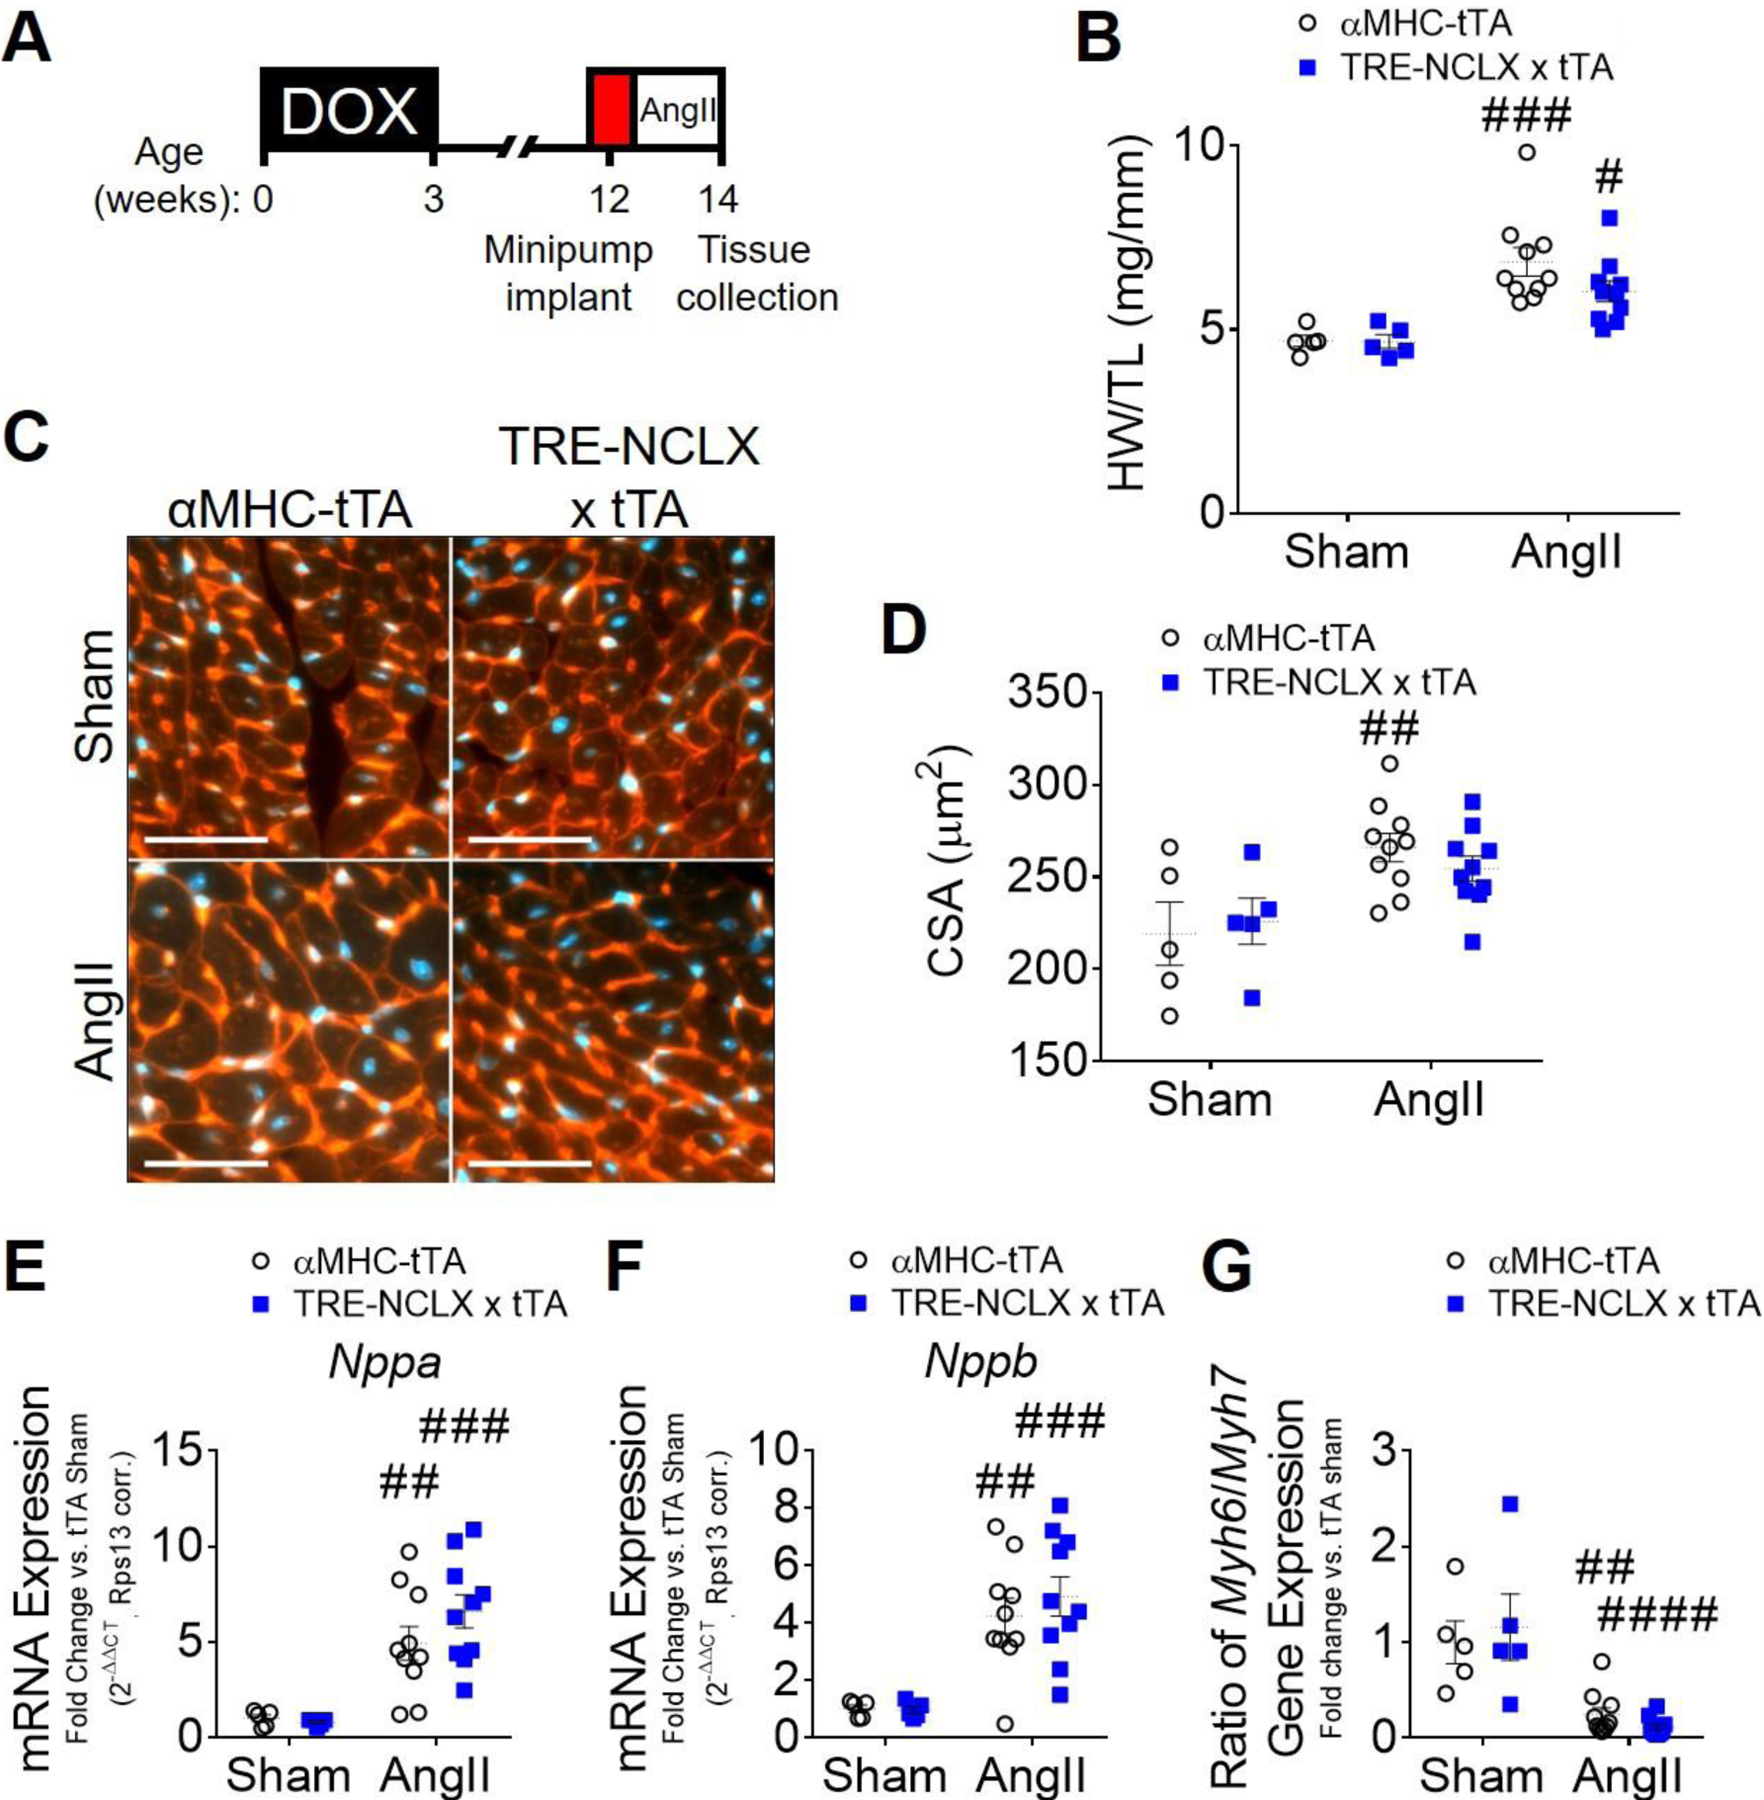
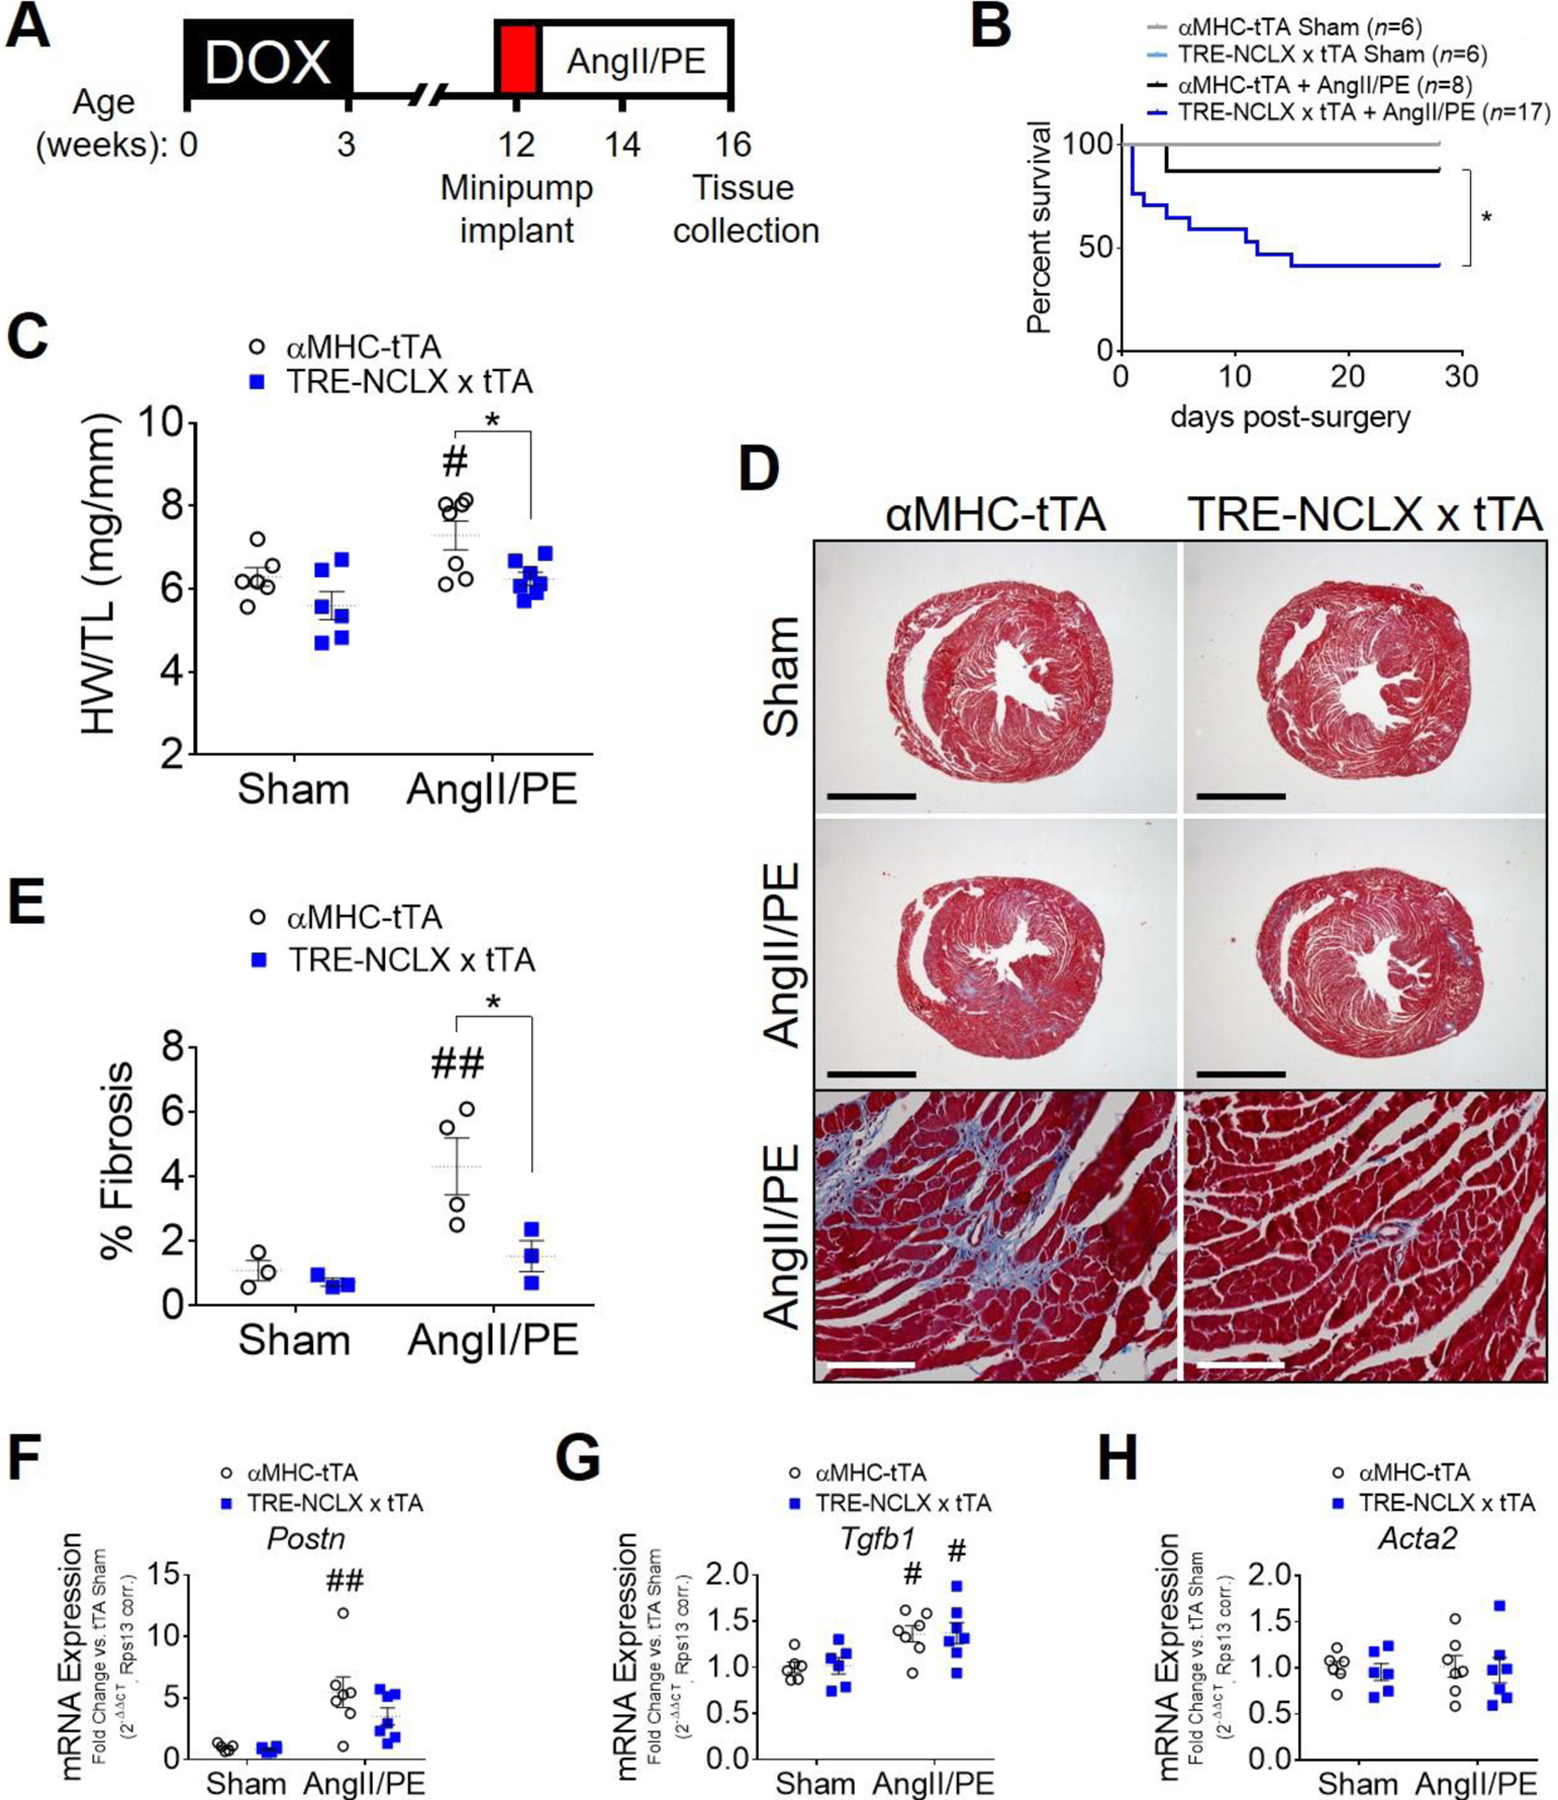
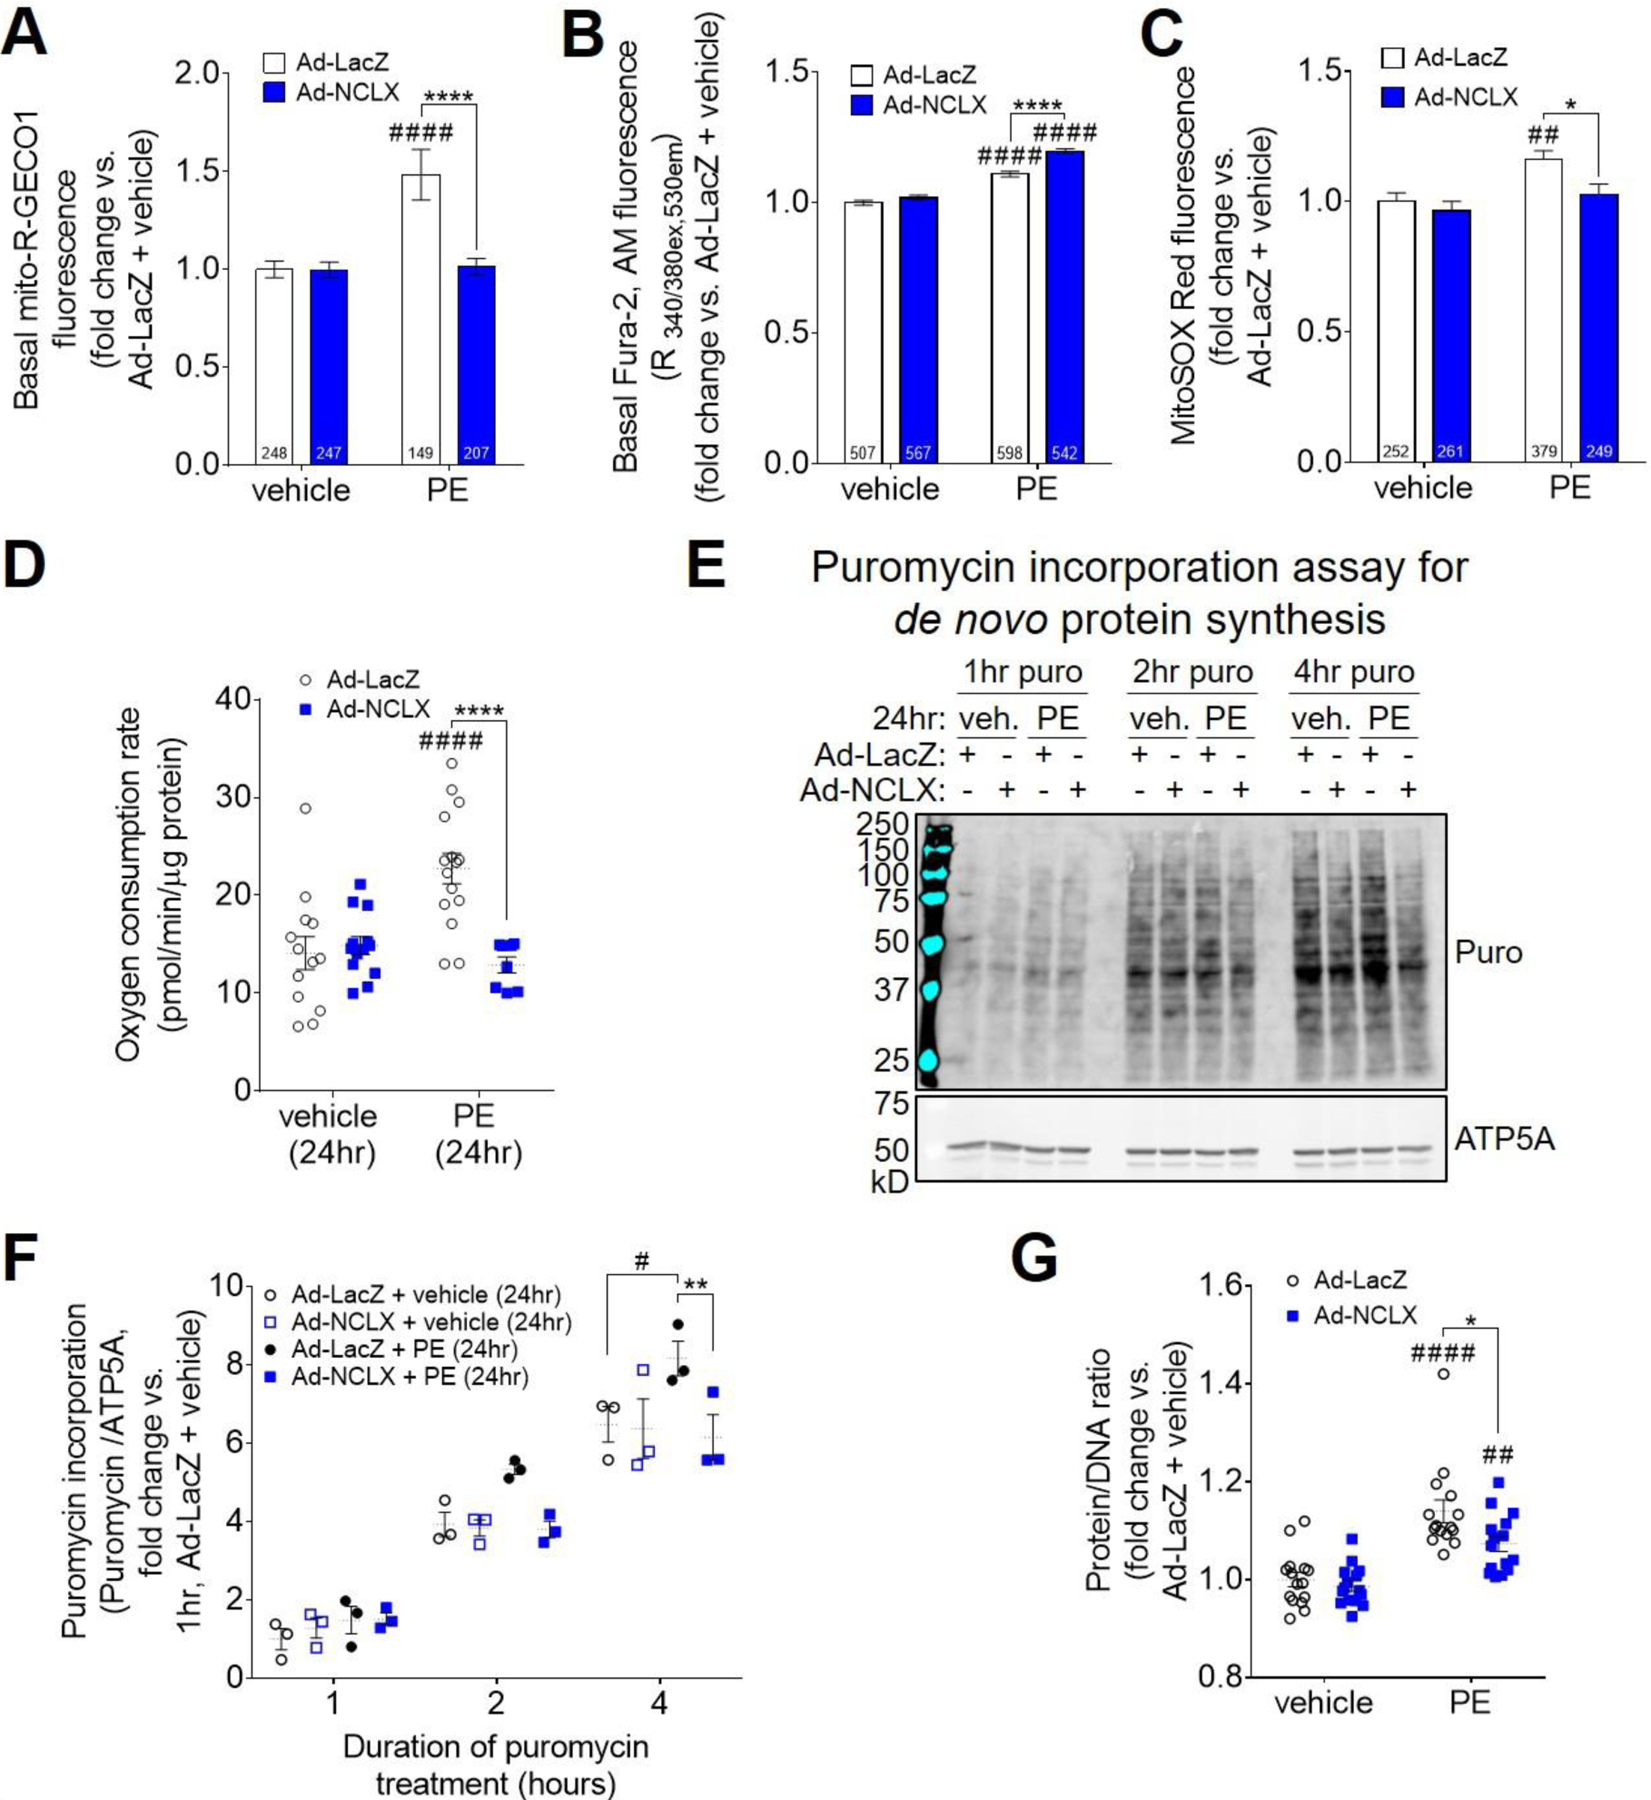
Mitochondrial calcium (mCa2+) uptake couples changes in cardiomyocyte energetic demand to mitochondrial ATP production. However, excessive mCa2+ uptake triggers permeability transition and necrosis. Despite these established roles during acute stress, the involvement of mCa2+ signaling in cardiac adaptations to chronic stress remains poorly defined. Changes in NCLX expression are reported in heart failure (HF) patients and models of cardiac hypertrophy. Therefore, we hypothesized that altered mCa2+ homeostasis contributes to the hypertrophic remodeling of the myocardium that occurs upon a sustained increase in cardiac workload. The impact of mCa2+ flux on cardiac function and remodeling was examined by subjecting mice with cardiomyocyte-specific overexpression (OE) of the mitochondrial Na+/Ca2+ exchanger (NCLX), the primary mediator of mCa2+ efflux, to several well-established models of hypertrophic and non-ischemic HF. Cardiomyocyte NCLX-OE preserved contractile function, prevented hypertrophy and fibrosis, and attenuated maladaptive gene programs in mice subjected to chronic pressure overload. Hypertrophy was attenuated in NCLX-OE mice, prior to any decline in cardiac contractility. NCLX-OE similarly attenuated deleterious cardiac remodeling in mice subjected to chronic neurohormonal stimulation. However, cardiomyocyte NCLX-OE unexpectedly reduced overall survival in mice subjected to severe neurohormonal stress with angiotensin II + phenylephrine. Adenoviral NCLX expression limited mCa2+ accumulation, oxidative metabolism, and de novo protein synthesis during hypertrophic stimulation of cardiomyocytes in vitro. Our findings provide genetic evidence for the contribution of mCa2+ to early pathological remodeling in non-ischemic heart disease, but also highlight a deleterious consequence of increasing mCa2+ efflux when the heart is subjected to extreme, sustained neurohormonal stress.

Keywords: Calcium; Mitochondria; NCLX; anabolism; heart failure; hypertrophy.


Conflict of interest statement

DISCLOSURE AND CONFLICT OF INTEREST

J.W.E. is a paid consultant for Mitobridge and Janssen.

Figures

Extended Figure 1:
Extended Figure 1:. Full-length blots for Figure 1B.
Arrow indicates full-length NCLX.
Extended Figure 2:
Extended Figure 2:. Full-length blots for Figure 5E.
Arrow indicates ATP5A band.
Figure 1:
Figure 1:. Cardiomyocyte-specific NCLX overexpression protects against pressure overload-induced HF and pathological remodeling.
A) Genetic approach for doxycycline-controlled, cardiomyocyte-specific expression of a human NCLX transgene in mice. TRE-NCLX mice expressing human NCLX cDNA under the control of a tetracycline-responsive promoter were crossed to αMHC-tTA (cardiomyocyte-specific, doxycycline-off) transgenic mice [75]. All mice were fed doxycycline-containing chow during development and through three weeks of age to allow for normal cardiac development. NCLX transgene expression was induced by removal of doxycycline at the time of weaning at 3 weeks of age. B-C) Western blots for NCLX protein expression in heart lysates from adult αMHC-tTA and TRE-NCLX x αMHC-tTA mice, and quantification of NCLX expression normalized to total OXPHOS complexes I-V as a mitochondrial loading control. Data analyzed by t-test. *P<0.05. (n=4 mice/group). D) Timeline of transverse aortic constriction (TAC) experimental protocol. DOX, doxycycline administration. Left ventricular end diastolic dimension (LVEDD) (E), end systolic dimension (LVESD) (F), and percent fractional shortening (%FS) (G) over 12 weeks after TAC or sham surgery. Data analyzed by 2-way ANOVA with Tukey’s post-hoc test. *P <0.05, **P<0.01, ***P<0.001 αMHC-tTA TAC vs. TRE-NCLX x αMHC-tTA TAC. #P <0.05, ####P<0.0001 αMHC-tTA sham vs. TAC. (n=7–18 mice / group). H) Heart weight-to-tibia length ratio (HW/TL) 12 weeks post sham or TAC surgery. Data analyzed by 2-way ANOVA with Sidak’s post-hoc test. #P<0.05 vs. sham. (n=7–18 mice / group). I) Left ventricular tissue at 12 weeks post sham or TAC surgery, stained with wheat germ agglutinin (WGA, red) to delineate sarcolemma and with DAPI (blue). Scale bars = 50 µm. J) Quantification of cardiomyocyte cross-sectional area (CSA). Data analyzed by 2-way ANOVA with Sidak’s post-hoc test. ###P<0.001 vs. sham; *P < 0.05 αMHC-tTA vs. TRE-NCLX x αMHC-tTA. (n=3–5 mice / group). K) Masson’s trichrome stain for myocardial collagen deposition (blue) at 12 weeks post-surgery. Scale bars = 100 µm. L) Quantification of fibrotic area as percent of tissue area. Data analyzed by 2-way ANOVA with Sidak’s post-hoc test. ##P<0.01 vs. sham; *P < 0.05 αMHC-tTA vs. TRE-NCLX x αMHC-tTA. (n=3–5 mice / group). qPCR quantification of mRNA expression of fetal (M-N) and pro-fibrotic (O-P) genes in hearts of mice 12 weeks after sham or TAC surgeries. Nppa, natriuretic peptide type A; Acta1, α-skeletal muscle actin; Postn, periostin; Spp1, osteopontin. Data analyzed by 2-way ANOVA with Sidak’s post-hoc test. #P<0.05, ##P<0.01 vs. sham; *P < 0.05, **P < 0.01 αMHC-tTA vs. TRE-NCLX x αMHC-tTA. (n=3–7 mice / group).
Figure 2:
Figure 2:. Cardiomyocyte NCLX overexpression attenuates early pressure overload-induced cardiac hypertrophy.
A) Timeline of 2-week transverse aortic constriction experimental protocol. DOX, doxycycline administration. B) Heart weight-to-tibia length ratio (HW/TL) of αMHC-tTA and TRE-NCLX x αMHC-tTA mice at 2 weeks post sham or TAC surgery. Data analyzed by 2-way ANOVA with Sidak’s post-hoc test. #P<0.05 vs. sham. (n=4–8 mice / group). C) Left ventricular tissue at 2 weeks post sham or TAC surgery, stained with wheat germ agglutinin (WGA, red) to delineate sarcolemma and with DAPI (blue). Scale bars = 50 µm. D) Quantification of cardiomyocyte cross-sectional area (CSA). Data analyzed by 2-way ANOVA with Sidak’s post-hoc test. ##P<0.01 vs. sham. (n=4–8 mice / group). E-F) qPCR quantification of mRNA expression of fetal genes in hearts of mice 2 weeks after sham or TAC surgeries. Nppa, natriuretic peptide type A; Acta1, α-skeletal muscle actin. Data analyzed by 2-way ANOVA with Sidak’s post-hoc test. #P<0.05 vs. sham. (n=4–8 mice / group).
Figure 3:
Figure 3:. Cardiomyocyte NCLX overexpression attenuates hypertrophy in mice infused with angiotensin II.
A) Timeline of angiotensin II (AngII) infusion experimental protocol. DOX, doxycycline administration. B) Heart weight-to-tibia length ratio (HW/TL) of αMHC-tTA and TRE-NCLX x αMHC-tTA mice 2 weeks after sham or angiotensin II minipump implantation surgery. Data analyzed by 2-way ANOVA with Sidak’s post-hoc test. #P<0.05, ###P<0.001 vs. sham. (n=5–10 mice / group). C) Left ventricular tissue 2 weeks after sham or angiotensin II minipump implantation surgery, stained with wheat germ agglutinin (WGA, red) to delineate sarcolemma and with DAPI (blue). Scale bars = 50 µm. D) Quantification of cardiomyocyte cross-sectional area (CSA). Data analyzed by 2-way ANOVA with Sidak’s post-hoc test. ##P<0.01 vs. sham. (n=5–10 mice / group). E-G) qPCR quantification of mRNA expression of fetal genes in hearts of αMHC-tTA and TRE-NCLX x αMHC-tTA mice 2 weeks after sham or angiotensin II minipump implantation surgery. Nppa, natriuretic peptide type A; Nppb, natriuretic peptide type b; Myh6, α-myosin heavy chain; Myh7, β-myosin heavy chain. Data analyzed by 2-way ANOVA with Sidak’s post-hoc test. ##P<0.01, ###P<0.001, ####P<0.0001 vs. sham. (n=5–10 mice / group).
Figure 4:
Figure 4:. Cardiomyocyte NCLX overexpression attenuates remodeling but reduces survival in mice infused with chronic high-dose angiotensin II + phenylephrine.
A) Timeline of angiotensin II + phenylephrine (AngII/PE) infusion experimental protocol. DOX, doxycycline administration. B) Kaplan-Meier survival curve of αMHC-tTA and TRE-NCLX x αMHC-tTA mice for 4 weeks after sham or AngII/PE osmotic minipump implantation surgeries. The number of animals in each group at the start of the study is indicated in parentheses. Data analyzed by log-rank (Mantel-Cox) test. *P<0.05 αMHC-tTA + AngII/PE vs. TRE-NCLX x αMHC-tTA + AngII/PE. C) Heart weight-to-tibia length ratio (HW/TL) of αMHC-tTA and TRE-NCLX x αMHC-tTA mice 4 weeks after sham or AngII/PE minipump implantation surgery. Data analyzed by 2-way ANOVA with Sidak’s post-hoc test. #P<0.05 vs. sham; *P < 0.05 αMHC-tTA vs. TRE-NCLX x αMHC-tTA. (n=5–7 mice / group). D) Masson’s trichrome stain for myocardial collagen deposition (blue) in αMHC-tTA and TRE-NCLX x αMHC-tTA hearts 4 weeks after sham or AngII/PE minipump implantation surgery. Black scale bars for whole-heart cross sections = 2mm. White scale bars for higher magnification micrographs (bottom row) = 100 µm. E) Quantification of fibrotic area as percent of tissue area. Data analyzed by 2-way ANOVA with Sidak’s post-hoc test. ##P<0.01 vs. sham; *P < 0.05 αMHC-tTA vs. TRE-NCLX x αMHC-tTA. (n=3–4 mice / group). F-H) qPCR quantification of mRNA expression of pro-fibrotic genes in hearts of mice after 4 weeks of AngII/PE infusion. Postn, periostin; Tfgb1, transforming growth factor β−1; Acta2, α-smooth muscle actin. Data analyzed by 2-way ANOVA with Sidak’s post-hoc test. #P<0.05, ##P<0.01 vs. sham. (n=5–7 mice / group).
Figure 5:
Figure 5:. NCLX expression limits oxidative capacity and biosynthetic potential of cardiomyocytes during hypertrophic stimulation in vitro.
A) Basal, steady-state mCa2+ content in neonatal rat ventricular myocytes (NRVMs) transduced with adenovirus encoding β-galactosidase (Ad-LacZ) or human NCLX (Ad-NCLX) and treated with vehicle or phenylephrine (PE), as indicated by fluorescence of the genetically-encoded mitochondrial Ca2+ reporter, mito-R-GECO1. Data analyzed by 2-way ANOVA with Sidak’s post-hoc test. ####P<0.0001 vs. vehicle; ****P<0.0001 Ad-LacZ vs. Ad-NCLX. Cell number per experimental group (n) is indicated within the corresponding bar of the graph. Individual data points are depicted in Supplemental Fig. S8A. B) Basal, steady-state cytosolic Ca2+ level in NRVMs, as indicated by fluorescence of the ratiometric Ca2+ reporter dye, Fura-2, AM. Data analyzed by 2-way ANOVA with Sidak’s post-hoc test. ####P<0.0001 vs. vehicle; ****P<0.0001 Ad-LacZ vs. Ad-NCLX. Cell number per experimental group (n) is indicated within the corresponding bar of the graph. Individual data points are depicted in Supplemental Fig. S8B. C) Mitochondrial superoxide production in NRVMs, as indicated by fluorescence of the dye MitoSOX Red. Data analyzed by 2-way ANOVA with Sidak’s post-hoc test. ##P<0.01 vs. vehicle; *P<0.05 Ad-LacZ vs. Ad-NCLX. Cell number per experimental group (n) is indicated within the corresponding bar of the graph. Individual data points are depicted in Supplemental Fig. S8C. D) Basal oxygen consumption rate per unit cellular protein in NRVMs after 24 hours of treatment with vehicle or phenylephrine. Data analyzed by 2-way ANOVA with Sidak’s post-hoc test. ####P<0.0001 vs. vehicle; ****P<0.0001 Ad-LacZ vs. Ad-NCLX. (n=8–15 replicates / group). E) Western blots for puromycin incorporation, and mitochondrial loading control ATP5A, in NRVMs treated with puromycin (puro) for 1–4 hours starting at 24 hours of phenylephrine stimulation. Corresponding full-length western blots are shown in Extended Fig. 2. F) Quantification of cellular puromycin incorporation normalized to loading control, ATP5A. Data analyzed by 2-way ANOVA with Sidak’s post-hoc test. #P<0.05 vs. vehicle; **P<0.01 Ad-LacZ vs. Ad-NCLX. (n=3 replicates / group). G) Protein/DNA ratio in NRVMs after 48 hours of vehicle or PE treatment. Data analyzed by 2-way ANOVA with Sidak’s post-hoc test. ##P<0.01, ####P<0.001 vs. vehicle; *P<0.05 Ad-LacZ vs. Ad-NCLX. (n=15 replicates / group).

References

    1. McCormack JG, Halestrap AP, Denton RM, Role of calcium ions in regulation of mammalian intramitochondrial metabolism, Physiological reviews 70(2) (1990) 391–425. - PubMed
    1. Griffiths EJ, Rutter GA, Mitochondrial calcium as a key regulator of mitochondrial ATP production in mammalian cells, Biochim Biophys Acta 1787(11) (2009) 1324–33. - PubMed
    1. Garbincius JF, Luongo TS, Elrod JW, The debate continues - What is the role of MCU and mitochondrial calcium uptake in the heart?, Journal of molecular and cellular cardiology 143 (2020) 163–174. - PMC - PubMed
    1. Garbincius JF, Elrod JW, Mitochondrial calcium exchange in physiology and disease, Physiological reviews 102(2) (2022) 893–992. - PMC - PubMed
    1. Baughman JM, Perocchi F, Girgis HS, Plovanich M, Belcher-Timme CA, Sancak Y, Bao XR, Strittmatter L, Goldberger O, Bogorad RL, Koteliansky V, Mootha VK, Integrative genomics identifies MCU as an essential component of the mitochondrial calcium uniporter, Nature 476(7360) (2011) 341–5. - PMC - PubMed

Publication types