. 2023 Jan 10;7(1):145-158.
doi: 10.1182/bloodadvances.2021006941.

The immune microenvironment shapes transcriptional and genetic heterogeneity in chronic lymphocytic leukemia

Affiliations

The immune microenvironment shapes transcriptional and genetic heterogeneity in chronic lymphocytic leukemia

Clare Sun et al. Blood Adv. .

Abstract

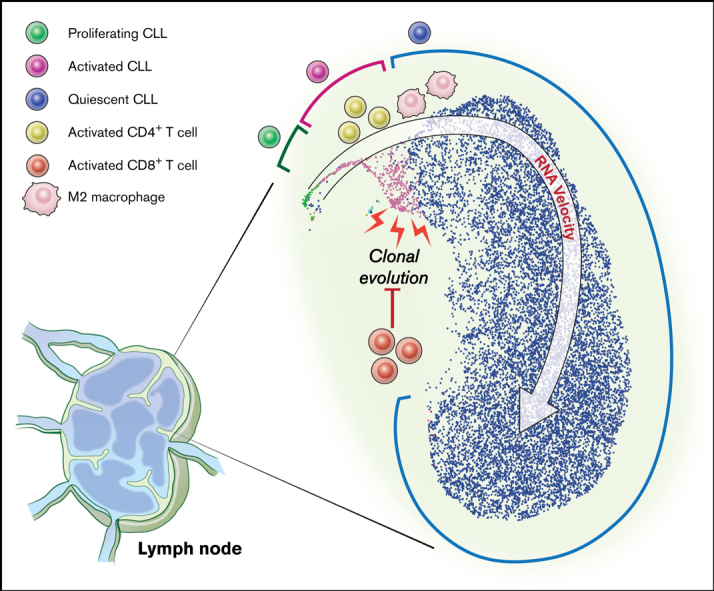
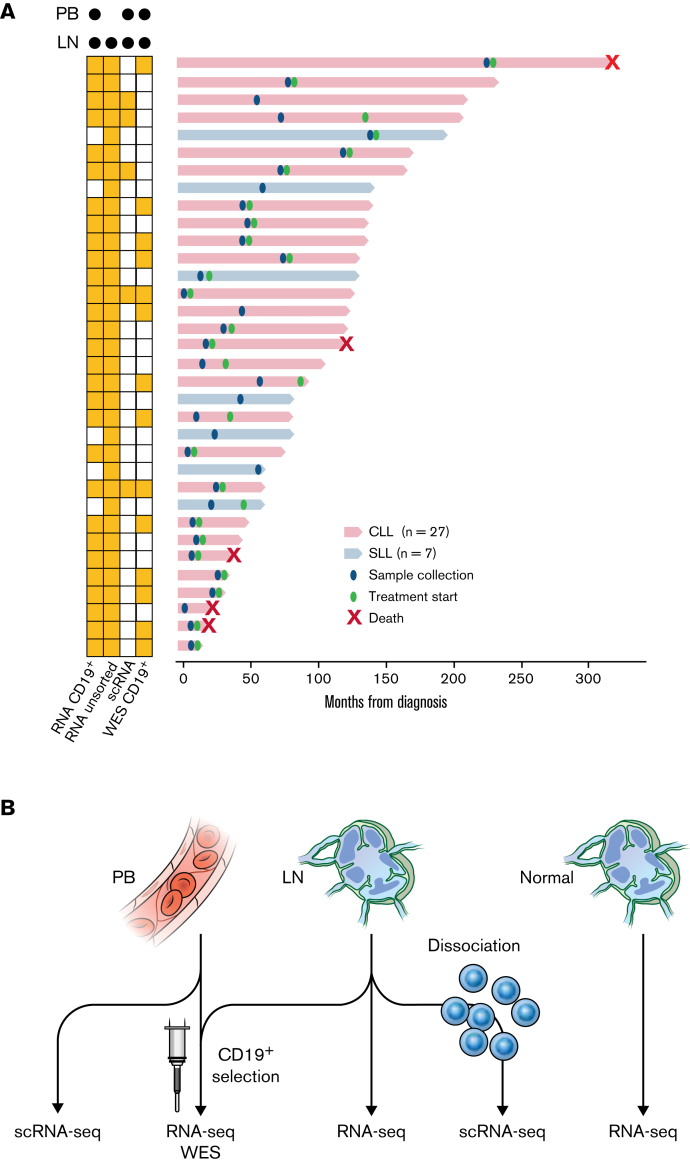
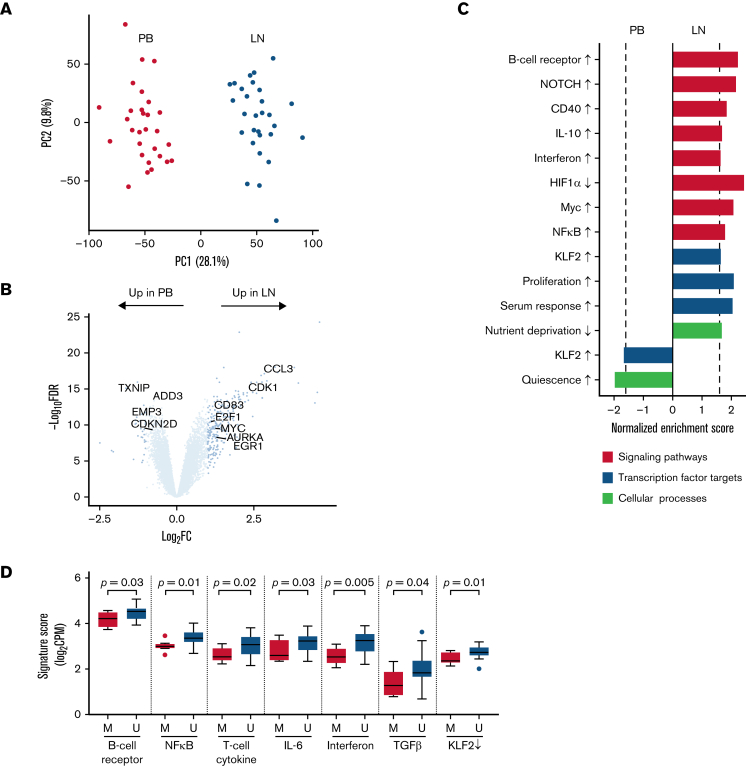
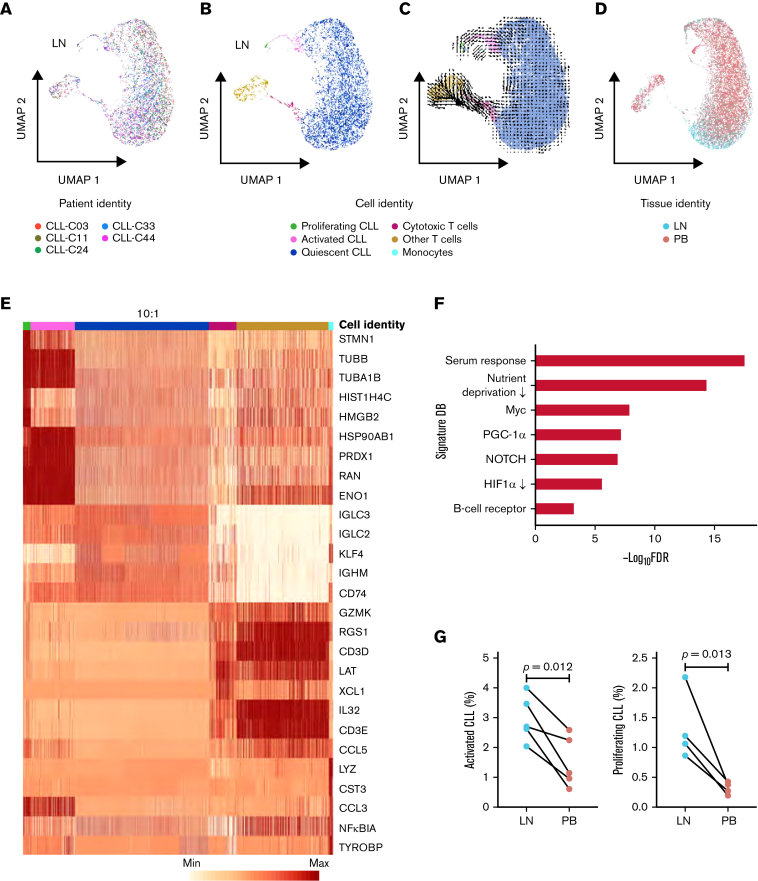
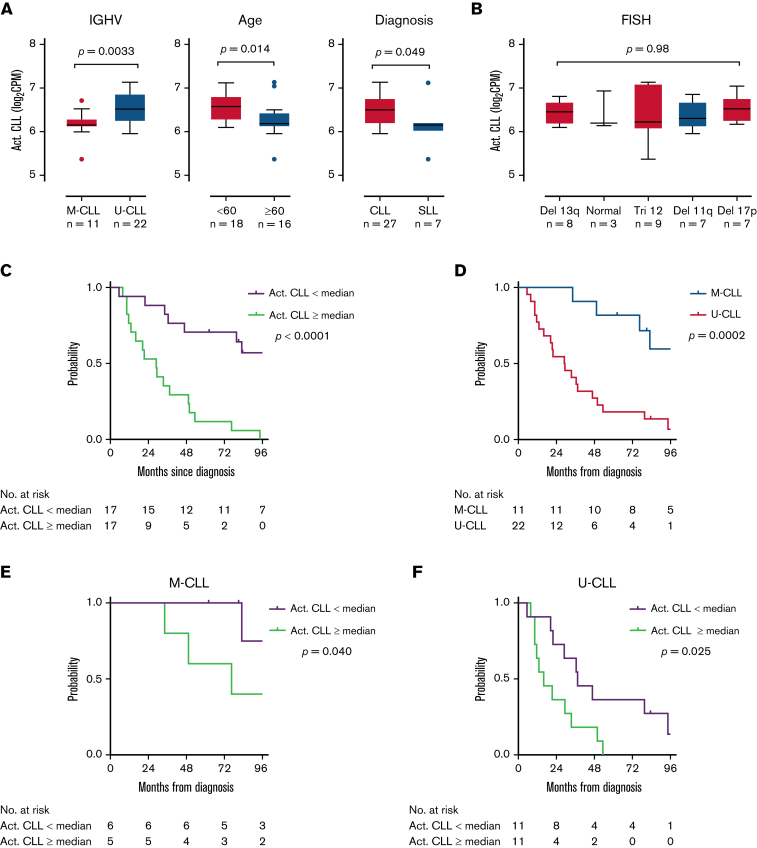
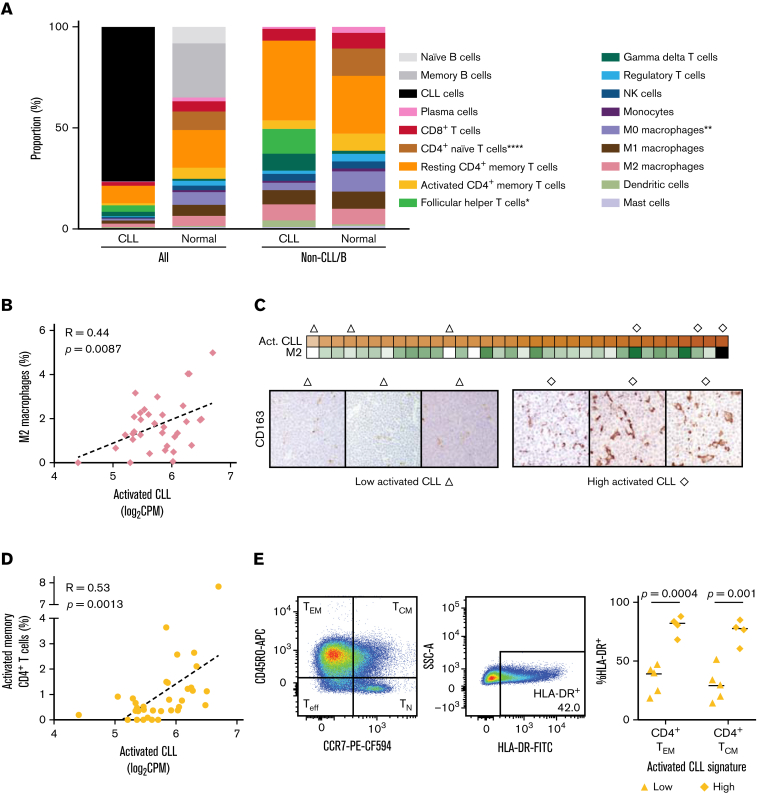
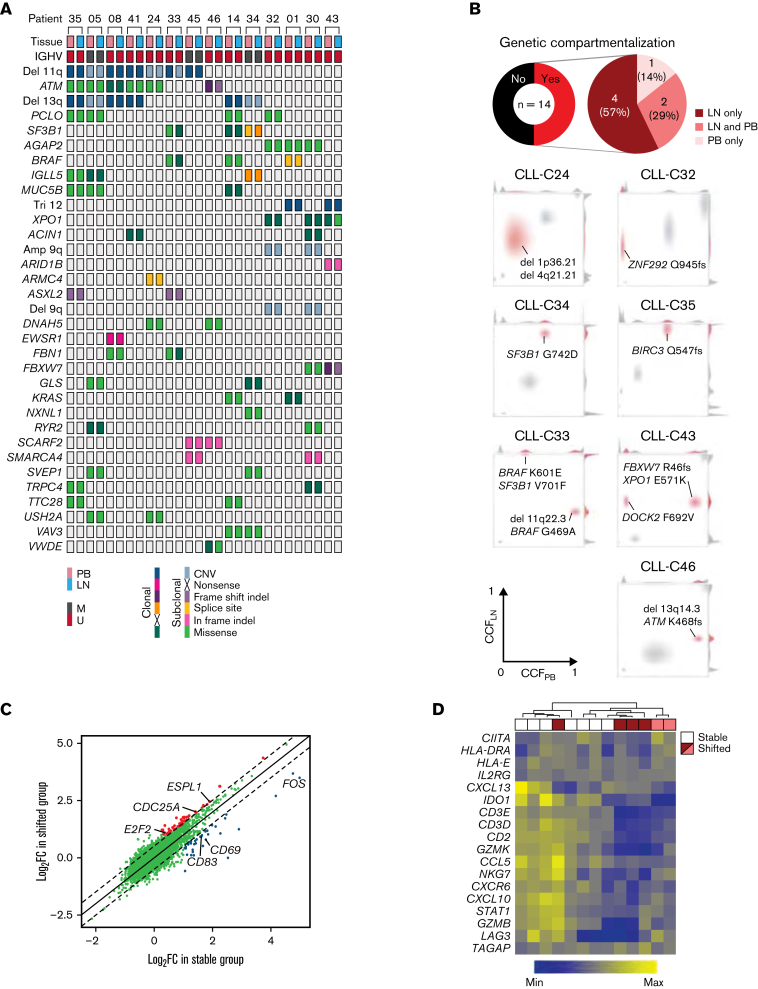
In chronic lymphocytic leukemia (CLL), B-cell receptor signaling, tumor-microenvironment interactions, and somatic mutations drive disease progression. To better understand the intersection between the microenvironment and molecular events in CLL pathogenesis, we integrated bulk transcriptome profiling of paired peripheral blood (PB) and lymph node (LN) samples from 34 patients. Oncogenic processes were upregulated in LN compared with PB and in immunoglobulin heavy-chain variable (IGHV) region unmutated compared with mutated cases. Single-cell RNA sequencing (scRNA-seq) distinguished 3 major cell states: quiescent, activated, and proliferating. The activated subpopulation comprised only 2.2% to 4.3% of the total tumor bulk in LN samples. RNA velocity analysis found that CLL cell fate in LN is unidirectional, starts in the proliferating state, transitions to the activated state, and ends in the quiescent state. A 10-gene signature derived from activated tumor cells was associated with inferior treatment-free survival (TFS) and positively correlated with the proportion of activated CD4+ memory T cells and M2 macrophages in LN. Whole exome sequencing (WES) of paired PB and LN samples showed subclonal expansion in LN in approximately half of the patients. Since mouse models have implicated activation-induced cytidine deaminase in mutagenesis, we compared AICDA expression between cases with and without clonal evolution but did not find a difference. In contrast, the presence of a T-cell inflamed microenvironment in LN was associated with clonal stability. In summary, a distinct minor tumor subpopulation underlies CLL pathogenesis and drives the clinical outcome. Clonal trajectories are shaped by the LN milieu, where T-cell immunity may contribute to suppressing clonal outgrowth. The clinical study is registered at clinicaltrials.gov as NCT00923507.


Conflict of interest statement

Conflict-of-interest disclosure: C.S. receives research support from Genmab. M.J.B. is an employee at AstraZeneca. S.H.G. is a consultant for Novalgen Ltd and holds patents related to ROR1 therapies; has received honoraria, conference support, and speakers fees from AstraZeneca, AbbVie, and Janssen. N.S.S. is a consultant for and has received speaker fees from AbbVie, Pharmacyclics LLC, an AbbVie company, and Janssen; and is a member of the advisory board for TG Therapeutics, Innocare, BeiGene, KyowaKirin, ADC therapeutics, and Kite. G.G. receives research funds from IBM and Pharmacyclics; and is an inventor on patent applications related to MSMuTect, MSMutSig, MSIDetect, POLYSOLVER, and SignatureAnalyzer-GPU; is a founder, consultant, and holds privately held equity in Scorpion Therapeutics. C.J.W. holds equity in BioNTech, Inc and receives research funding from Pharmacyclics. A.W. receives research support from Pharmacyclics LLC, an AbbVie Company, Acerta LLC, a member of the AstraZeneca Group, Merck, Verastem, Nurix, and Genmab. The remaining authors declare no competing financial interests.

Figures

None
Graphical abstract
Figure 1.
Figure 1.
Patient samples and experimental design. (A) Swimmer plot of each patient from the time of diagnosis to last follow-up or death. Diagnosis of CLL or small lymphocytic lymphoma and timing of sample collection and treatment initiation are shown. Some patients had not received the first treatment at the last follow-up. The types of sequencing performed on PB and LN samples are indicated on the left. (B) Illustration of the types of sequencing performed: (1) bulk RNA-seq (n = 29); (2) WES (n = 14) of CD19+ tumor cells from paired PB and LN samples; (3) scRNA-seq of paired PB and LN samples (n = 5); (4) bulk RNA-seq of unsorted CLL LN samples (n = 34); and (5) bulk RNA-seq of unsorted normal LN samples (n = 4).
Figure 2.
Figure 2.
The CLL transcriptome is modulated by the tumor microenvironment. (A) Principal component analysis of bulk RNA-seq in CD19+ tumor cells from paired PB (red) and LN (green) samples (n = 29 pairs). (B) Volcano plot of log2 fold-change (FC) in gene expression between PB and LN bulk RNA-seq vs -log10 false discovery rate (FDR). Differentially expressed genes (dark blue, n = 285) were defined as FC ≥2 and FDR <0.05. (C) Gene signatures enriched (normalized enrichment score ≥|1.6| as shown by the dotted line and FDR <0.05) in either PB or LN bulk RNA-seq. Signatures were categorized as signaling pathways, transcription factor targets, and cellular processes. Signatures comprised of upregulated genes are indicated by an up arrow (↑) while downregulated genes are indicated by a down arrow (↓). (D) Comparison of the indicated signatures between mutated (M; n = 8) and unmutated (U; n = 21) CLL. A signature score is the average expression of genes comprising each signature for a given sample. Box and whiskers show the median, IQR, and 1.5 times IQR of the indicated signature scores across LN samples. IQR, interquartile range.
Figure 3.
Figure 3.
Single-cell transcriptomic analysis reveals intratumoral heterogeneity in LNs. (A) Uniform manifold approximation and projection (UMAP) of integrated scRNA-seq data from 15 107 single cells across 5 LN samples. Each color represents a different LN sample. (B) Clustering of LN single cells into major cell lineages and subpopulations. Each color represents a different cell identity cluster. CLL cells clustered into 3 subpopulations (proliferating, activated, quiescent) based on differences in transcriptional profiles. (C) RNA velocities derived from deterministic modeling projected on a UMAP of LN samples. CLL cells begin in the proliferating state, transition to the activated state, and end in the quiescent state. (D) UMAP of single cells from PB and LN (n = 5 pairs). Cell rendering after integration of PB and LN data is slightly different from that of LN data alone, as expected when computed from combined data. (E) Heatmap of the 5 most differentially expressed genes in each cell identity cluster. The color scale represents the number of reads mapping to the indicated gene per 10 000 reads. The size of the quiescent CLL population has been downscaled to improve the visualization of smaller clusters. Each column representing a quiescent CLL cell is 0.1× the width of columns representing other cells. (F) Significant overlap (hypergeometric test, FDR <0.05) between genes upregulated in activated CLL cells in LN and the indicated gene signatures. (G) Percentage of activated and proliferating CLL cells in LN and PB. Connecting lines indicate paired samples from each patient.
Figure 4.
Figure 4.
The activated CLL signature is associated with disease aggressiveness. (A,B) Comparison of the activated CLL signature between clinical subgroups. The activated CLL signature was defined as the 10 most differentially expressed genes between activated and quiescent CLL cells in the scRNA-seq dataset. Signature expression was then calculated in bulk RNA-seq data of LN samples. Box and whiskers represent the median, IQR, and 1.5 times IQR. (C-F) Kaplan-Meier plots of TFS in patients with (C) low vs high (below vs equal to or above median) expression of the activated CLL signature, (D) M-CLL vs U-CLL, (E) low vs high signature expression in patients with M-CLL, and (F) low vs high signature expression in patients with U-CLL.
Figure 5.
Figure 5.
Activated CLL cells interact with the immune microenvironment. (A) Mean abundance of the indicated cell types as estimated by CIBERSORT deconvolution of bulk RNA-seq data from CLL (n = 34) and normal LN samples (n = 4). There were significantly fewer follicular helper T cells (P < .05) and more CD4+ naïve T cells (P < .0001) and uncommitted macrophages in CLL LNs (P < .01) than normal LNs. (B) Correlation between the activated CLL signature and the abundance of M2 macrophages as estimated by CIBERSORT deconvolution of bulk RNA-seq data (n = 34). (C) Top: heatmap of activated CLL signature expression and CIBERSORT estimated abundance of M2 macrophages. Bottom: triangle and diamond symbols identify LN samples used for immunohistochemical staining of CD163+ M2 macrophages with low and high expression of the activated CLL signature. The average number of CD163+ cells per high-power field (40×) in each sample is provided immediately below. (D) Correlation between the activated CLL signature and the abundance of activated memory CD4+ T cells as estimated by CIBERSORT deconvolution of bulk RNA-seq data (n = 34). (E) Left: gating strategy of HLA-DR+ CD4+ effector memory (TEM CD3+CD19-CD14-CD4+CD8-CD45RO+CCR7-) and central memory (TCM CD3+CD19-CD14-CD4+CD8-CD45RO+CCR7+) cells in a representative flow cytometry dot plot. Right: proportion of CD4+ TEM and TCM cells that are HLA-DR+ in LN samples with low (n = 5) and high (n = 4) expression of the activated CLL signature.
Figure 6.
Figure 6.
The immune microenvironment constrains clonal expansion. (A) Distribution of CNAs and nonsilent mutations in WES of paired PB and LN samples in 14 patients. Only CNAs or genes mutated in ≥2 patients are shown. No clonal inframe indels or subclonal nonsense mutations were detected. (B) Top: pie charts of the proportion of patients with genetic compartmentalization of subclones defined as an absolute difference in CCF >0.25 between PB and LN by WES. Bottom: density plots of CCF in PB and LN in patients demonstrating subclonal expansion in each compartment (CLL-C33 and CLL-C43), in LN only (CLL-C24, CLL-C32, CLL-C34, and CLL-C35), and PB only (CLL-C46). The subclone(s) with genetic compartmentalization are highlighted in red in each patient. (C) Comparison of mean FC in gene expression by bulk RNA-seq in LN relative to PB between patients with (shifted) and without (stable) subclonal expansion in LN. Each dot is the FC in the expression of a gene in LN relative to PB averaged across 6 patients in the shifted group (y-axis) and 7 patients in the stable group (x-axis). Colored dots are genes with a significant difference in FC between these 2 groups (Δlog2FC >0.5; FDR <0.05). (D) Heatmap of a T-cell inflammatory signature expression by bulk RNA-seq and hierarchal clustering dendrogram of stable (n = 7) and shifted (n = 6) patients. The top row shows stable patients in white and shifted patients in red or pink. Red and pink colors correspond to patients with expanded subclone(s) in LN only and those with expanded subclone(s) in LN and PB, respectively. CNAs, copy number alterations.

References

    1. Herishanu Y, Pérez-Galán P, Liu D, et al. The lymph node microenvironment promotes B-cell receptor signaling, NF-kappaB activation, and tumor proliferation in chronic lymphocytic leukemia. Blood. 2011;117(2):563–574. - PMC - PubMed
    1. Granziero L, Ghia P, Circosta P, et al. Survivin is expressed on CD40 stimulation and interfaces proliferation and apoptosis in B-cell chronic lymphocytic leukemia. Blood. 2001;97(9):2777–2783. - PubMed
    1. Aguilar-Hernandez MM, Blunt MD, Dobson R, et al. IL-4 enhances expression and function of surface IgM in CLL cells. Blood. 2016;127(24):3015–3025. - PubMed
    1. Nishio M, Endo T, Tsukada N, et al. Nurselike cells express BAFF and APRIL, which can promote survival of chronic lymphocytic leukemia cells via a paracrine pathway distinct from that of SDF-1alpha. Blood. 2005;106(3):1012–1020. - PMC - PubMed
    1. Ghia P, Strola G, Granziero L, et al. Chronic lymphocytic leukemia B cells are endowed with the capacity to attract CD4+, CD40L+ T cells by producing CCL22. Eur J Immunol. 2002;32(5):1403–1413. - PubMed

Publication types

Substances

Associated data