. 2022 Mar 10:12:840616.
doi: 10.3389/fonc.2022.840616. eCollection 2022.

Trends in Disease Burden of Chronic Lymphocytic Leukemia at the Global, Regional, and National Levels From 1990 to 2019, and Projections Until 2030: A Population-Based Epidemiologic Study

Affiliations

Trends in Disease Burden of Chronic Lymphocytic Leukemia at the Global, Regional, and National Levels From 1990 to 2019, and Projections Until 2030: A Population-Based Epidemiologic Study

Yang Ou et al. Front Oncol. .

Abstract

Background: The prognosis of chronic lymphocytic leukemia (CLL) has been improved dramatically, but there are limited studies focusing on CLL disease burden on a global scale. We aimed to evaluate the accurate assessment of the disease burden of CLL that may provide more detailed epidemiological information for rational policies.

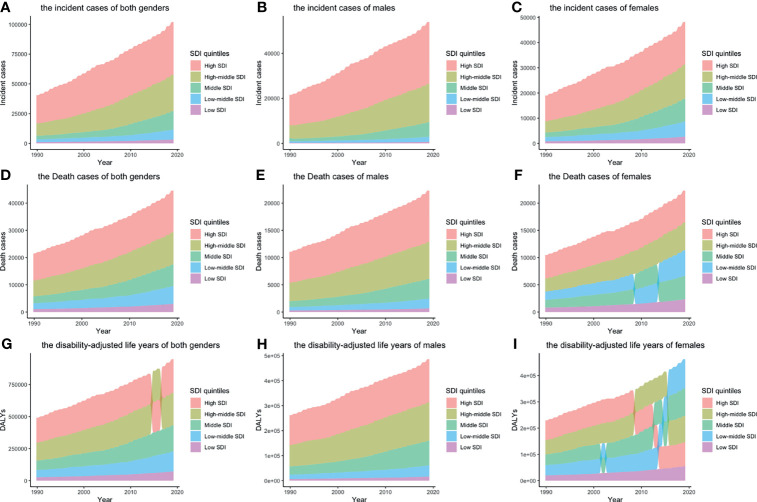
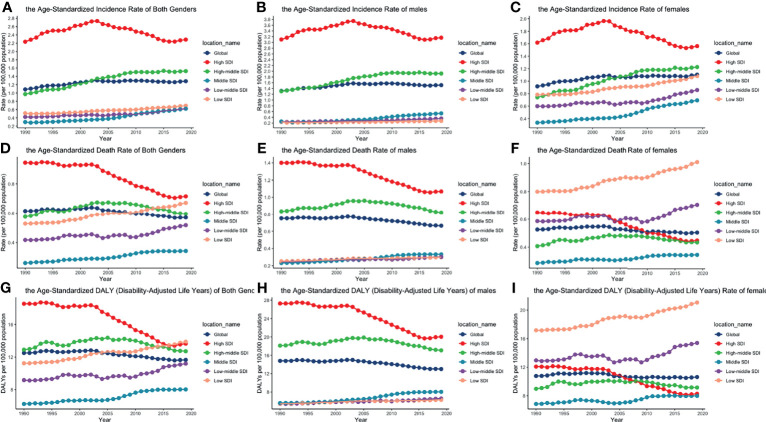
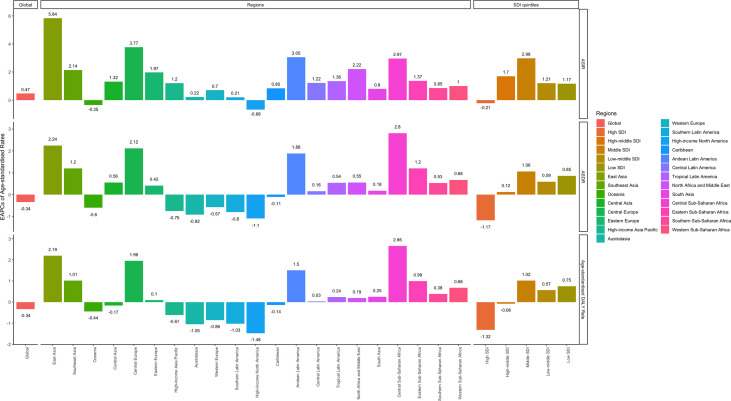
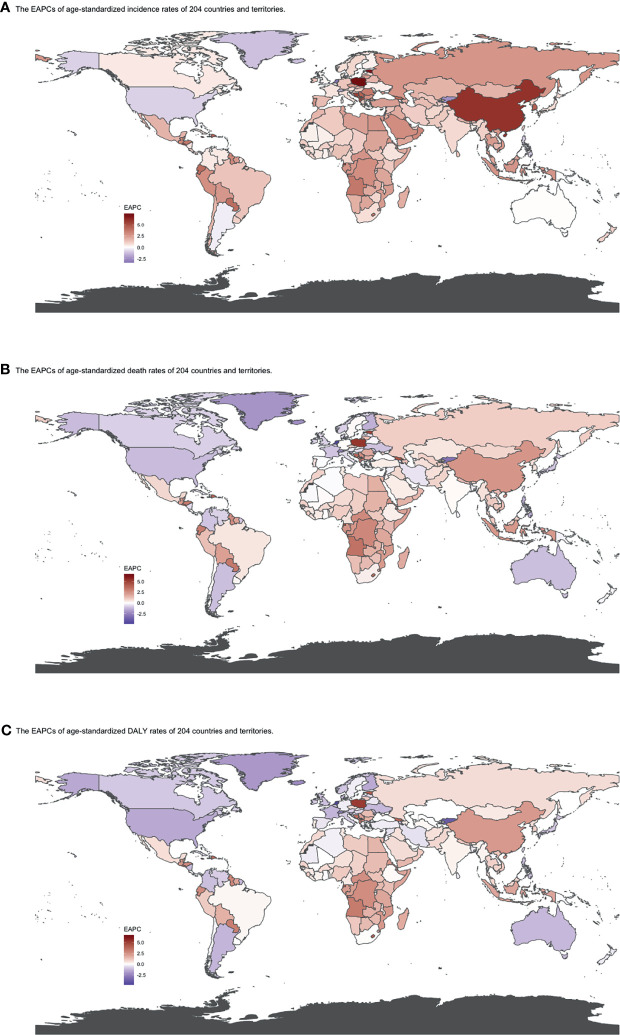
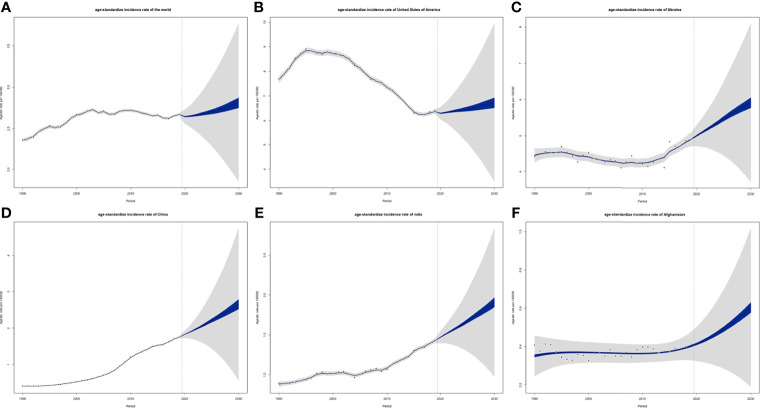
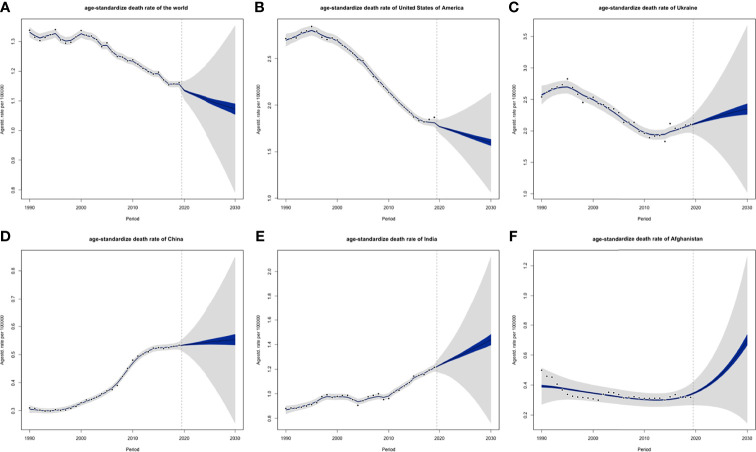
Methods: The main source of the data was the Global Burden of Disease (GBD) study 2019. Incident cases, death cases, disability-adjusted life years (DALYs), and their corresponding age-standardized rates (ASRs) from 1990 to 2019 were used to describe the burden of CLL. Data about attributable risk factors were also extracted and analyzed. Bayesian age-period-cohort (BAPC) models were used to assess and project the incidence and mortality rates till 2030.

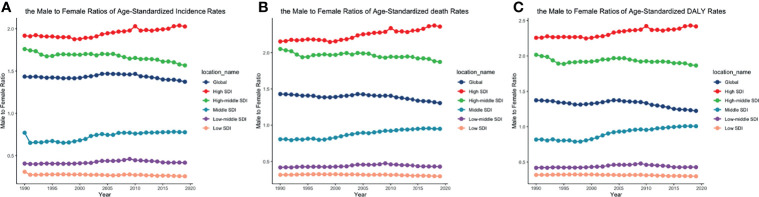
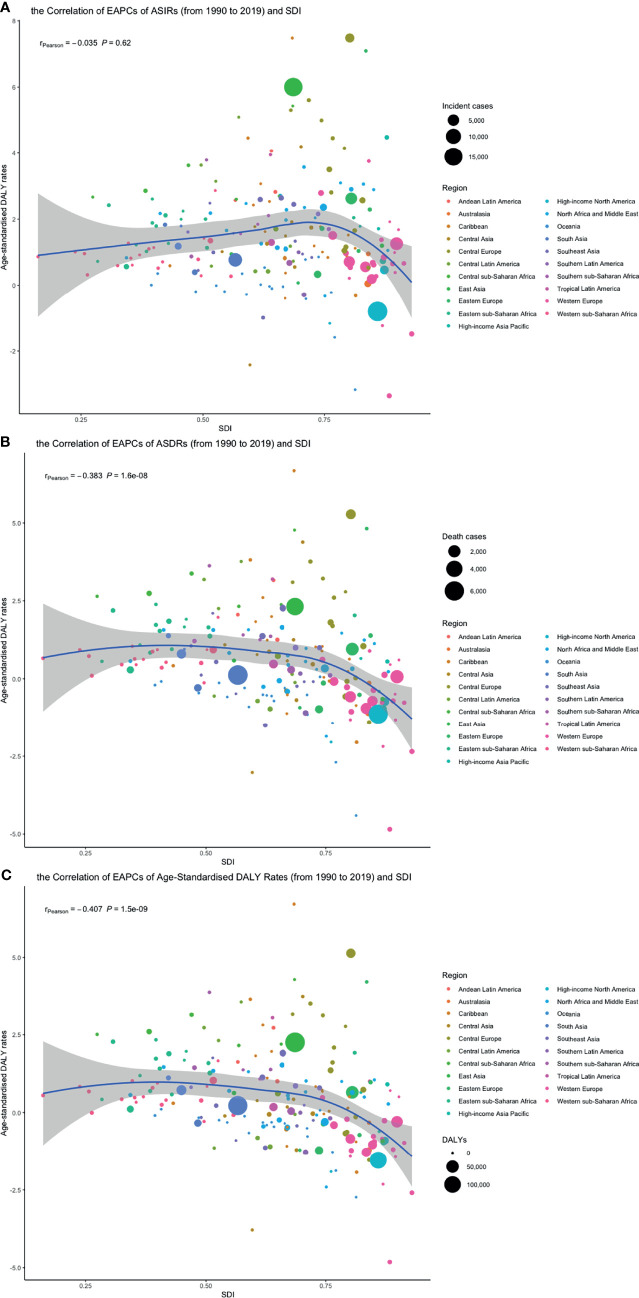
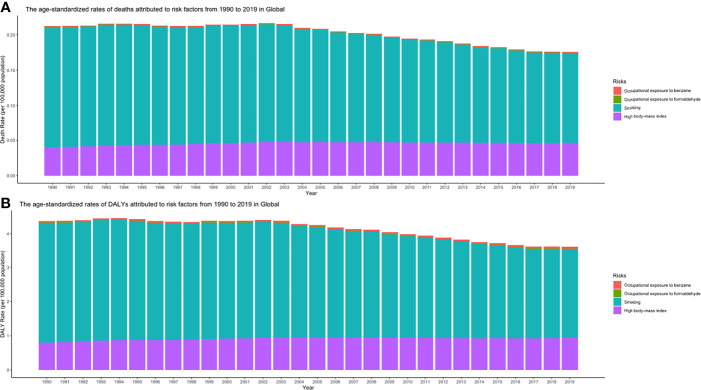
Results: Globally, the incidence of CLL had been increasing. Deaths and DALYs decreased slightly. The burden of death and DALY is affected by socio-demographic index (SDI). The incidence rate, death rate, and DALY rate of CLL increased significantly with age. Male-to-female ratios of incidence rates varied in different SDI quintiles. Smoking, high body mass index, and occupational exposure to benzene or formaldehyde were the potential risk factors related to CLL. Global ASIRs might tend to increase until 2030, while ASDR would decrease until 2030.

Conclusion: The disease burden of CLL decreased in higher SDI countries but increased in lower ones. Strategies for early detection of asymptomatic CLL, development of novel drugs, and measures against attributable factors should be implemented to combat CLL burden.

Keywords: chronic lymphocytic leukemia; death; disability-adjusted life years; epidemiology; incidence.


Conflict of interest statement

The authors declare that the research was conducted in the absence of any commercial or financial relationships that could be construed as a potential conflict of interest.

Figures

Figure 1
Figure 1
Incident cases, death cases, and DALYs of different SDI quintiles from 1990 to 2019 by gender: (A) incident cases of both genders; (B) incident cases of males; (C) incident cases of females; (D) death cases of both genders; (E) death cases of males; (F) death cases of females; (G) DALYs of both genders; H: DALYs of males; I: DALYs of females. Alluvia represent numbers of different SDI quintiles, from the highest (the SDI quintile with largest number) to the lowest (the SDI quintile with smallest number). (DALY, disability-adjusted life year; SDI, socio-demographic index).
Figure 2
Figure 2
ASIRs, ASDRs, and age-standardized DALY rates of different SDI quintiles from 1990 to 2019 by gender: (A) ASIRs of both genders; (B) ASIRs of males; (C) ASIRS of females; (D) ASDRs of both genders; (E) ASDRs of males; (F) ASDRs of females; (G) age-standardized DALY rates of both genders; (H) age-standardized DALY rates of males; (I) age-standardized DALY rates of females. (ASIR, age-standardized incidence rate; ASDR, age-standardized death rate; DALY, disability-adjusted life year; SDI, socio-demographic index).
Figure 3
Figure 3
EAPCs of ASIR (upper), ASDRs (middle), and age-standardized DALY rates (lower), in the global (left), regional (middle) and SDI (right) levels. (ASIR, age-standardized incidence rate; ASDR, age-standardized death rate; DALY, disability-adjusted life year; SDI, socio-demographic index).
Figure 4
Figure 4
Map of (A) ASIR, (B) ASDRs, and (C) age-standardized DALY rates by country in 2019. Heat gradient represents age-standardized rates from pink (highest) to dark green (lowest). (ASIR, age-standardized incidence rate; ASDR, age-standardized death rate; DALY, disability-adjusted life year; EAPC, estimated annual percentage change).
Figure 5
Figure 5
EAPCs of (A) ASIR, (B) ASDRs, and (C) age-standardized DALY rates by country from 1990 to 2019. Heat gradient represents the change trends of EAPCs from red (highest) to blue (lowest). Blue indicates a downward trend and Red indicates an upward trend. (ASIR, age-standardized incidence rate; ASDR, age-standardized death rate; DALY, disability-adjusted life year; EAPC, estimated annual percentage change).
Figure 6
Figure 6
The male-to-female ratios of (A) ASIR, (B) ASDRs, and (C) age-standardized DALY rates by SDI quintiles from 1990 to 2019. (ASIR, age-standardized incidence rate; ASDR, age-standardized death rate; DALY, disability-adjusted life year; SDI, socio-demographic index).
Figure 7
Figure 7
The burden of incidence, deaths, and DALY by gender and age groups in 2019. (A) Incident cases; (B) Incidence rates; (C) death cases; (D) death rates; (E) DALY rates; (F) DALY cases (DALY, disability-adjusted life year).
Figure 8
Figure 8
Proportion of age groups on (A) incident cases, (B) death cases, and (C) DALYs by SDI quintiles in 2019 (DALY, disability-adjusted life year; SDI, socio-demographic index).
Figure 9
Figure 9
The burden of incidence, deaths, and DALY of 3 age groups from 1990 to 2019. (A) Incident cases; (B) Incidence rates; (C) death cases; (D) death rates; (E) DALY rates; (F) DALYs (ASIR, age-standardized incidence rate; ASDR, age-standardized death rate; DALY, disability-adjusted life year).
Figure 10
Figure 10
The correlation between EAPCs of (A) ASIR, (B) ASDRs, and (C) age-standardized DALY rates from 1990 to 2019 and SDI in 2019. The circles represent 204 countries or territories, the size of circle represents the number of incident cases, death cases or DALY, and the color of circle represents the region which the country or territory belongs to. (ASIR, age-standardized incidence rate; ASDR, age-standardized death rate; DALY, disability-adjusted life year; SDI, socio-demographic index; EAPC, estimated annual percentage change, SDI, socio-demographic index).
Figure 11
Figure 11
The change trend and correlation between (A) ASIR, (B) ASDRs, and (C) age-standardized DALY rates and SDI from 1990 to 2019. The color of circle represents the 21 different regions. (ASIR, age-standardized incidence rate; ASDR, age-standardized death rate; DALY, disability-adjusted life year; SDI, socio-demographic index; SDI, socio-demographic index).
Figure 12
Figure 12
(A) ASDRs and (B) age-standardized DALY rates attributed to risk factors from 1990 to 2019 in Global (ASDR, age-standardized death rate; DALY, disability-adjusted life year).
Figure 13
Figure 13
Projections of ASIRs of (A) the world, (B) USA, (C) Ukraine, (D) China, (E) India and (F) Afghanistan from 2020 to 2030: blue areas are 5% confidence intervals and grey areas are 95% confidence intervals; black dots are observation value from 1990 to 2019 (ASIR, age-standardized incidence rate).
Figure 14
Figure 14
Projections of ASDRs of (A) the world, (B) USA, (C) Ukraine, (D) China, (E) India and (F) Afghanistan from 2020 to 2030: blue areas are 5% confidence intervals and grey areas are 95% confidence intervals; black dots are observation value from 1990 to 2019 (ASDR, age-standardized death rate; DALY).

References

    1. Siegel RL, Miller KD, Fuchs HE, Jemal A. Cancer Statistics, 2021. CA: Cancer J Clin (2021) 71(1):7–33. doi: 10.3322/caac.21654 - DOI - PubMed
    1. Hernández JA, Land KJ, McKenna RW. Leukemias, Myeloma, and Other Lymphoreticular Neoplasms. Cancer (1995) 75(1 Suppl):381–94. doi: 10.1002/1097-0142(19950101)75:1+<381::AID-CNCR2820751320>3.0.CO;2-B - DOI - PubMed
    1. Smith A, Howell D, Patmore R, Jack A, Roman E. Incidence of Haematological Malignancy by Sub-Type: A Report From the Haematological Malignancy Research Network. Br J Cancer (2011) 105(11):1684–92. doi: 10.1038/bjc.2011.450 - DOI - PMC - PubMed
    1. Yamamoto JF, Goodman MT. Patterns of Leukemia Incidence in the United States by Subtype and Demographic Characteristics, 1997-2002. Cancer Causes Control CCC (2008) 19(4):379–90. doi: 10.1007/s10552-007-9097-2 - DOI - PubMed
    1. Yang S, Varghese AM, Sood N, Chiattone C, Akinola NO, Huang X, et al. . Ethnic and Geographic Diversity of Chronic Lymphocytic Leukaemia. Leukemia (2021) 35(2):433–9. doi: 10.1038/s41375-020-01057-5 - DOI - PubMed

LinkOut - more resources