

Prevalence, Years Lived With Disability, and Time Trends for 16 Causes of Blindness and Vision Impairment: Findings Highlight Retinopathy of Prematurity
- PMID: 35359888
- PMCID: PMC8962664
- DOI: 10.3389/fped.2022.735335
Prevalence, Years Lived With Disability, and Time Trends for 16 Causes of Blindness and Vision Impairment: Findings Highlight Retinopathy of Prematurity
Abstract
Background: Cause-specific prevalence data of vision loss and blindness is fundamental for making public health policies and is essential for prioritizing scientific advances and industry research.
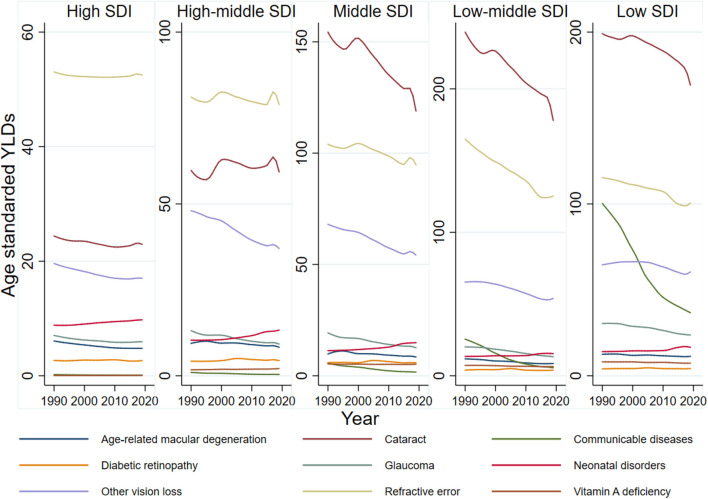
Methods: Cause-specific vision loss data from the Global Health Data Exchange was used. The burden of vision loss was measured by prevalence and years lived with disability (YLDs).
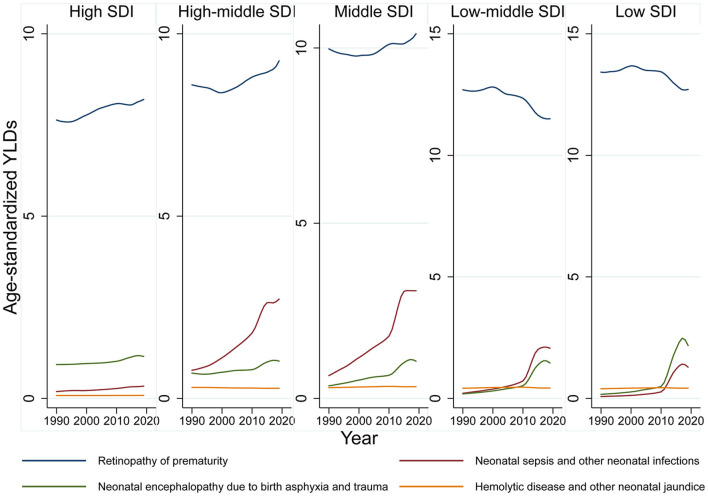
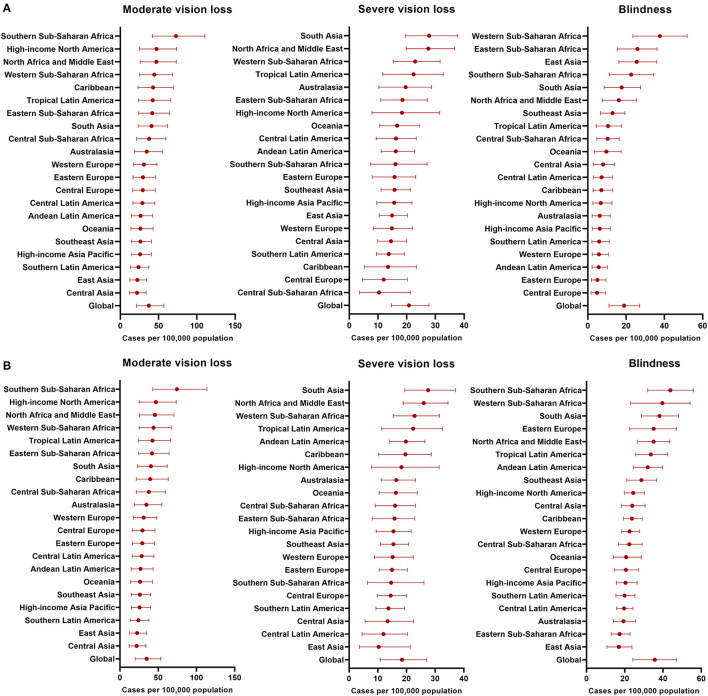
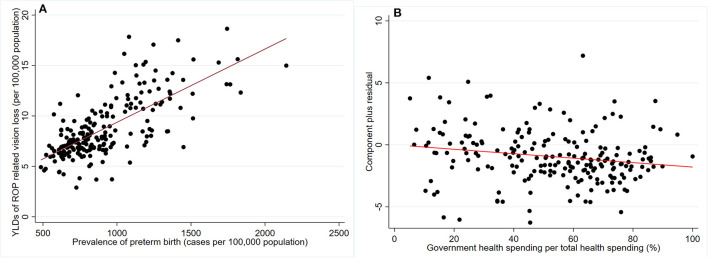
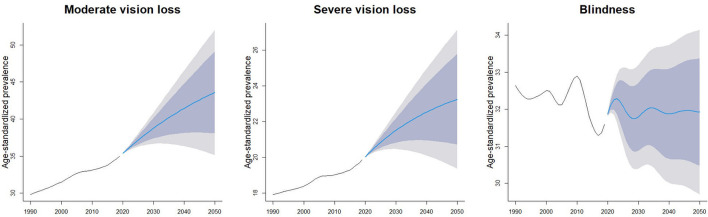
Findings: In 2019, uncorrected refractory error and cataract were the most common causes for vision loss and blindness globally. Women have higher rates of cataract, age-related macular degeneration (AMD), and diabetic retinopathy (DR) than men. In the past 30 years, the prevalence of moderate/severe vision loss and blindness due to neonatal disorders has increased by 13.73 and 33.53%, respectively. Retinopathy of prematurity (ROP) is the major cause of neonatal disorders related vision loss. In 2019, ROP caused 101.6 thousand [95% uncertainty intervals (UI) 77.5-128.2] cases of vision impairment, including 49.1 thousand (95% UI 28.1-75.1) moderate vision loss, 27.5 thousand (95% UI 19.3-36.60) severe vision loss and, 25.0 thousand (95% UI 14.6-35.8) blindness. The prevalence of new-onset ROP in Africa and East Asia was significantly higher than other regions. Variation of preterm birth prevalence can explain 49.8% geometry variation of ROP-related vision loss burden among 204 countries and territories. After adjusting for preterm prevalence, government health spending per total health spending (%), rather than total health spending per person, was associated with a reduced burden of ROP-related vision loss in 2019 (-0.19 YLDs for 10% increment). By 2050, prevalence of moderate, severe vision loss and blindness due to ROP is expected to reach 43.6 (95% UI 35.1-52.0), 23.2 (95% UI 19.4-27.1), 31.9 (95% UI 29.7-34.1) per 100,000 population.
Conclusion: The global burden of vision loss and blindness highlights the prevalent of ROP, a major and avoidable cause for childhood vision loss. Advanced screening techniques and treatments have shown to be effective in preventing ROP-related vision loss and are urgently needed in regions with high ROP-related blindness rates, including Africa and East Asia.
Keywords: blindness; prevalence; retinopathy of prematurity; visual impairment; years lived with disability.
Copyright © 2022 Zhang, Liu, Dong, Li, Li, Zhou, Wu, Wang and Wei.
Conflict of interest statement
The authors declare that the research was conducted in the absence of any commercial or financial relationships that could be construed as a potential conflict of interest.
Figures
Similar articles
-
National sex- and age-specific burden of blindness and vision impairment by cause in Mexico in 2019: a secondary analysis of the Global Burden of Disease Study 2019.Lancet Reg Health Am. 2023 Jul 11;24:100552. doi: 10.1016/j.lana.2023.100552. eCollection 2023 Aug. Lancet Reg Health Am. 2023. PMID: 37457139 Free PMC article.
-
Prevalence and causes of vision loss in East Asia in 2015: magnitude, temporal trends and projections.Br J Ophthalmol. 2020 May;104(5):616-622. doi: 10.1136/bjophthalmol-2018-313308. Epub 2019 Aug 28. Br J Ophthalmol. 2020. PMID: 31462416
-
Global burden and gender disparity of vision loss associated with diabetes retinopathy.Acta Ophthalmol. 2021 Jun;99(4):431-440. doi: 10.1111/aos.14644. Epub 2020 Oct 29. Acta Ophthalmol. 2021. PMID: 33124190
-
Prevalence and causes of blindness and vision impairment: magnitude, temporal trends and projections in South and Central Asia.Br J Ophthalmol. 2019 Jul;103(7):871-877. doi: 10.1136/bjophthalmol-2018-312292. Epub 2018 Nov 8. Br J Ophthalmol. 2019. PMID: 30409914
-
Causes of blindness and vision impairment in 2020 and trends over 30 years, and prevalence of avoidable blindness in relation to VISION 2020: the Right to Sight: an analysis for the Global Burden of Disease Study.Lancet Glob Health. 2021 Feb;9(2):e144-e160. doi: 10.1016/S2214-109X(20)30489-7. Epub 2020 Dec 1. Lancet Glob Health. 2021. PMID: 33275949 Free PMC article.
Cited by
-
Alteration of Tear Metabolomics Profiling in Infants With Retinopathy of Prematurity.Invest Ophthalmol Vis Sci. 2025 Jun 2;66(6):61. doi: 10.1167/iovs.66.6.61. Invest Ophthalmol Vis Sci. 2025. PMID: 40540260 Free PMC article.
-
The impact after 20 years of an early detection program for severe retinopathy of prematurity in a Latin American city.Indian J Ophthalmol. 2023 Nov;71(11):3494-3500. doi: 10.4103/IJO.IJO_889_23. Indian J Ophthalmol. 2023. PMID: 37870013 Free PMC article.
-
Screening and surveillance for retinopathy of prematurity: A Wilson and Jungner framework approach.J Glob Health. 2023 May 19;13:03028. doi: 10.7189/jogh.13.03028. J Glob Health. 2023. PMID: 37199471 Free PMC article. No abstract available.
-
Reduction of pathological retinal neovascularization, vessel obliteration, and artery tortuosity by PEDF protein in an oxygen-induced ischemic retinopathy rat model.FASEB Bioadv. 2024 Jul 19;6(9):311-326. doi: 10.1096/fba.2024-00059. eCollection 2024 Sep. FASEB Bioadv. 2024. PMID: 39399476 Free PMC article.
-
Characterization and prevalence of ocular comorbidities and risk of legal blindness across the United States.Eye (Lond). 2024 Nov;38(16):3118-3124. doi: 10.1038/s41433-024-03238-3. Epub 2024 Jul 31. Eye (Lond). 2024. PMID: 39085595 Free PMC article.
References
-
- Bourne R, Steinmetz JD, Flaxman S, Briant PS, Taylor HR, Resnikoff S, et al. . Trends in prevalence of blindness and distance and near vision impairment over 30 years: an analysis for the Global Burden of Disease Study. Lancet Global Health. (2021) 9:e130–43. 10.1016/S2214-109X(20)30425-3 - DOI - PMC - PubMed
-
- Blindness GBD Vision Impairment C Vision Vision Loss Expert Group of the Global Burden of Disease S . Causes of blindness and vision impairment in 2020 and trends over 30 years, and prevalence of avoidable blindness in relation to VISION 2020: the Right to Sight: an analysis for the Global Burden of Disease Study. Lancet Global Health. (2020) 9:E144–60. 10.1016/S2214-109X(20)30489-7 - DOI - PMC - PubMed
-
- Tekle AH, Zouré HG, Noma M, Boussinesq M, Coffeng LE, Stolk WA, et al. . Progress towards onchocerciasis elimination in the participating countries of the African Programme for Onchocerciasis Control: epidemiological evaluation results. Inf Dis Poverty. (2016) 5:66. 10.1186/s40249-016-0160-7 - DOI - PMC - PubMed
LinkOut - more resources
Full Text Sources
Miscellaneous