. 2022 Mar 14:13:827760.
doi: 10.3389/fimmu.2022.827760. eCollection 2022.

Effects of Receptor Specificity and Conformational Stability of Influenza A Virus Hemagglutinin on Infection and Activation of Different Cell Types in Human PBMCs

Affiliations

Effects of Receptor Specificity and Conformational Stability of Influenza A Virus Hemagglutinin on Infection and Activation of Different Cell Types in Human PBMCs

Jens Dorna et al. Front Immunol. .

Abstract

Humans can be infected by zoonotic avian, pandemic and seasonal influenza A viruses (IAVs), which differ by receptor specificity and conformational stability of their envelope glycoprotein hemagglutinin (HA). It was shown that receptor specificity of the HA determines the tropism of IAVs to human airway epithelial cells, the primary target of IAVs in humans. Less is known about potential effects of the HA properties on viral attachment, infection and activation of human immune cells. To address this question, we studied the infection of total human peripheral blood mononuclear cells (PBMCs) and subpopulations of human PBMCs with well characterized recombinant IAVs differing by the HA and the neuraminidase (NA) but sharing all other viral proteins. Monocytes and all subpopulations of lymphocytes were significantly less susceptible to infection by IAVs with avian-like receptor specificity as compared to human-like IAVs, whereas plasmacytoid dendritic cells (pDCs) and myeloid dendritic cells were equally susceptible to IAVs with avian-like and human-like receptor specificity. This tropism correlated with the surface expression of 2-3-linked sialic acids (avian-type receptors) and 2-6-linked sialic acids (human-type receptors). Despite a reduced infectivity of avian-like IAVs for PBMCs, these viruses were not less efficient than human-like IAVs in terms of cell activation as judged by the induction of cellular mRNA of IFN-α, CCL5, RIG-I, and IL-6. Elevated levels of IFN-α mRNA were accompanied by elevated IFN-α protein secretion in primary human pDC. We found that high basal expression in monocytes of antiviral interferon-induced transmembrane protein 3 (IFITM3) limited viral infection in these cells. siRNA-mediated knockdown of IFITM3 in monocytes demonstrated that viral sensitivity to inhibition by IFITM3 correlated with the conformational stability of the HA. Our study provides new insights into the role of host- and strain-specific differences of HA in the interaction of IAVs with human immune cells and advances current understanding of the mechanisms of viral cell tropism, pathogenesis and markers of virulence.

Keywords: hemagglutinin; influenza; primary immune cells; receptor specificity; tropism.


Conflict of interest statement

The authors declare that the research was conducted in the absence of any commercial or financial relationships that could be construed as a potential conflict of interest.

Figures
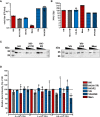
Figure 1
Figure 1
Characterization of virus stocks. (A) Viral titers in focus-forming units (FFU) per ml were determined using focus-formation assay in MDCK cells. Mean data of 3 independent experiments, each performed in triplicates are shown. (B) Hemagglutination titers with chicken red blood cells of viral suspensions diluted to viral infectious titers 1x10⁷ FFU/ml. Mean HAU of 5 independent experiments are shown. P values were determined by ANOVA followed by Turkey’s multiple comparison test and shown if significant. (C) Exemplary western blot for IAV M1 protein using samples containing 2x10⁶, 1x10⁶ and 0.5x10⁶ FFU of the indicated viruses. (D) Quantification of viral M1 protein after Western blotting. Band intensity of the M1 protein was normalized to HK in each dilution. Mean data of 3 independent western blots are shown. Significance determined by ANOVA followed by Dunnett’s multiple comparison test compared to HK within each FFU of virus. P values shown if significant.
Figure 2
Figure 2
Infection of PBMCs with HK and its HA variants HK-H17R and HK-R2. (A) Human PBMCs and (B) MDCK cells were incubated with IAVs at MOIs of 3, 0.3 and 0.03 for 8 hours. FACS analysis was used to determine the percentage of NP positive cells. Uninfected cells (MOCK) and cells inoculated with BPL-inactivated viruses at the dose corresponding to MOI 3 were used as controls. The mean of NP-positive cells ± SD are shown for at least 4 independent donors. Significance determined by ANOVA followed by Dunnett’s multiple comparison test compared to HK. P values shown if significant. *p < 0.05, ****p < 0.0001.
Figure 3
Figure 3
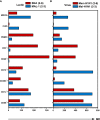
Infection of PBMCs with IAV differing in HA. Primary human PBMCs were infected with 3 MOI of the seasonal human (Mem), pandemic human (HK, HK-H17R) and avian viruses (VN, VN-K58I, HK-R2) for 8 hours. FACS analysis was used to determine the percentage of NP positive cells. The mean of NP-positive cells ± SD are shown for at least 3 independent donors. Significance determined by ANOVA followed by Turkey’s multiple comparison test. P values shown if significant *p < 0.05, **p < 0.01, ****p < 0.0001.
Figure 4
Figure 4
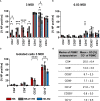
Influence of receptor specificity and conformational stability on the infection pattern in subpopulations of human PBMCs. (A, B) Human PBMCs or (C) MACS-isolated subpopulations were incubated for 8 hours with indicated viruses at MOI 3 (A, C) or MOI 0.03 (B). Flow cytometric analysis was used to determine the intracellular expression of viral NP and the expression of cell type specific CD-molecules (CD4+, T helper cells; CD8+, cytotoxic T cells; CD20+, B cells; CD56+, NK cells; CD14+, monocytes; CD303+, plasmacytoid dendritic cells; CD1c+, myeloid dendritic cells). The mean values of NP-positive cells ± SD are shown for at least 3 independent donors. Significance determined by ANOVA followed by Dunnett’s multiple comparison test compared to HK. P values shown if significant *p < 0.05, **p < 0.01, ***p < 0.001, ****p < 0.0001. (D) Mean ± SD [%] of CD-marker positive cells of each subpopulation of PBMCs after 8 hours of infection. Data from at least 3 independent donors are shown.
Figure 5
Figure 5
Binding of biotinylated lectins and viruses to human PBMCs. The MDCK and CHO cells and PBMCs were incubated for 1 hour with (A) biotinylated Sambucus nigra lectin (SNA, final concentration 0.4 µg/ml) or biotinylated Maackia amurensis lectin 1 (MAL-1, final concentration 1 µg/ml) at room temperature or (B) with biotinylated IAVs Mem-H1N1(final concentration 200 µg/ml) or Mal-H1N1 (final concentration 10 µg/ml) at 4 °C. Lectin or virus binding was detected as mean fluorescence intensity (MFI) after staining with streptavidin–APC. Cells were then fixed and stained for subpopulation as described in Material and Methods and subjected to flow cytometric analysis. Data of one representative donor are shown.
Figure 6
Figure 6
Effect of extracellular pH on infection in (A) MDCK cells and (B) human PBMCs. The MDCK cells and PBMCs were incubated with IAVs at MOI 3 and 0.3, respectively, at different pH for 8 hours. Flow cytometric analysis was used to determine the intracellular expression of viral NP. The mean of NP positive cells ± SD are shown for 3 independent donors and MDCK infections. Significance determined by ANOVA followed by Dunnett’s multiple comparison test compared to HK. P values shown if significant *p < 0.05, **p < 0.01.
Figure 7
Figure 7
Detection of IFITM3 expression in PBMC subpopulations. (A) Western blot for IFITM3 (upper part) and actin (lower part) using 200.000 cells/lane of either total PBMCs or sorted subpopulations of PBMCs (representative data for the cells from one donor). (B) Quantification of three WB from independent donors for basal IFITM3 expression in PBMCs and subpopulations as in (A). Intensity values of western blot analysis were normalized to non-fractionated PBMCs value and expressed as mean [%] ± SD. Significance determined by ANOVA followed by Newmann-Keuls multiple comparison test. P values shown if significant *p < 0.05, **p < 0.01, ***p < 0.001, ****p < 0.0001. (C) Western blot analysis of IFITM3 in myeloid cells isolated by FACS. 100.000 cells/lane of monocytes (CD14+), mDCs (CD1c+) of two individual donors and a pooled lysate of pDCs (CD303+) from these donors were used for detection of IFITM3 (upper panel) and actin (lower panel).
Figure 8
Figure 8
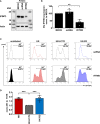
Assessment of IAV infection in primary human macrophages after siRNA-mediated IFITM3 knock down. (A) Representative western blot for IFITM3 (upper part) and actin (lower part) using elutriated, GM-CSF differentiated macrophages mock-treated or treated with scrambled or IFITM3-specific siRNA. (B) Quantification of IFITM3 knock down normalized to MOCK using 4 independent experiments. Significance determined by ANOVA followed by Dunnett’s multiple comparison test. P values shown if significant **p< 0.01. (C) Detection of intracellular NP by FACS 8 hours post infection in scRNA or specific IFITM3 siRNA treated primary human macrophages infected with the indicated viruses at MOI 0.3. (D) Fold differences in virus infected cells (NP+) normalized to the scRNA-sample using cells from 4 different donors. Significance determined by ANOVA followed by Dunnett’s multiple comparison test. P values shown if significant ***p < 0.001.
Figure 9
Figure 9
Regulation of cytokines in primary human PBMCs during infection with HK and its HA variants. (A) mRNA expression of cytokines (IFN-α, CCL5, IL-6) and nucleic acid sensor (RIG-I) of PBMCs inoculated at MOI 3 with HK and its HA variants HK-H17R and HK-R2 measured 6 hours p.i. using RT-PCR. Mean expression values +SD of four donors in duplicates are shown. Raw data of cytokines were normalized to the expression of the housekeeping gene RPS11 and related to HK infected samples. Significance determined by ANOVA followed by Turkey’s multiple comparison test. P values shown if significant *p < 0.05, **p < 0.01, ***p < 0.001. (B, C) MACS-isolated pDCs were either inoculated with recombinant IAVs at MOI 1 or stimulated with synthetic TLR-ligand ODN 2216 for 24 hours. Concentrations of (B) IFN-α or (C) IL-6 in the cell supernatants were determined by ELISA and depicted as mean amount of cytokine [ng/ml] +SD of two donors in duplicates.

Similar articles

Cited by

References

    1. Mostafa A, Abdelwhab EM, Mettenleiter TC, Pleschka S. Zoonotic Potential of Influenza A Viruses: A Comprehensive Overview. Viruses (2018) 10:1–38. doi: 10.3390/v10090497 - DOI - PMC - PubMed
    1. Reperant LA, Kuiken T, Osterhaus ADME. Adaptive Pathways of Zoonotic Influenza Viruses: From Exposure to Establishment in Humans. Vaccine (2012) 30:4419–34. doi: 10.1016/j.vaccine.2012.04.049 - DOI - PubMed
    1. Reperant LA, Kuiken T, Osterhaus ADME. Influenza Viruses: From Birds to Humans. Hum Vaccines Immunother (2012) 8:7–16. doi: 10.4161/hv.8.1.18672 - DOI - PubMed
    1. Munoz O, De Nardi M, van der Meulen K, Van Reeth K, Koopmans M, Harris K, et al. . Genetic Adaptation of Influenza a Viruses in Domestic Animals and Their Potential Role in Interspecies Transmission: A Literature Review. Ecohealth (2016) 13:171–98. doi: 10.1007/s10393-014-1004-1 - DOI - PubMed
    1. Sutton TC. The Pandemic Threat of Emerging H5 and H7 Avian Influenza Viruses. Viruses (2018) 10:1–21. doi: 10.3390/v10090461 - DOI - PMC - PubMed

Publication types

LinkOut - more resources