. 2022 Mar 11:13:867015.
doi: 10.3389/fimmu.2022.867015. eCollection 2022.

A Comprehensive Atlas of Immunological Differences Between Humans, Mice, and Non-Human Primates

Affiliations

A Comprehensive Atlas of Immunological Differences Between Humans, Mice, and Non-Human Primates

Zachary B Bjornson-Hooper et al. Front Immunol. .

Abstract

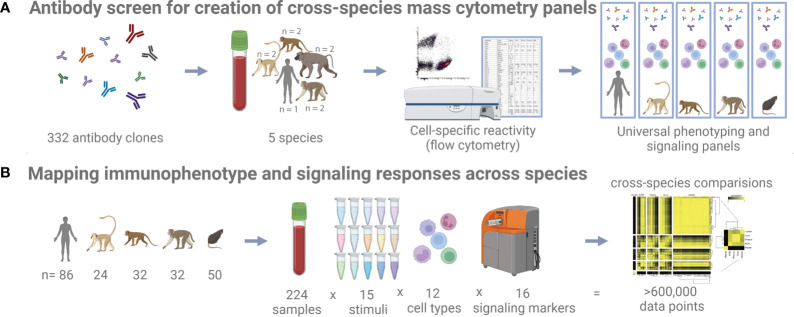
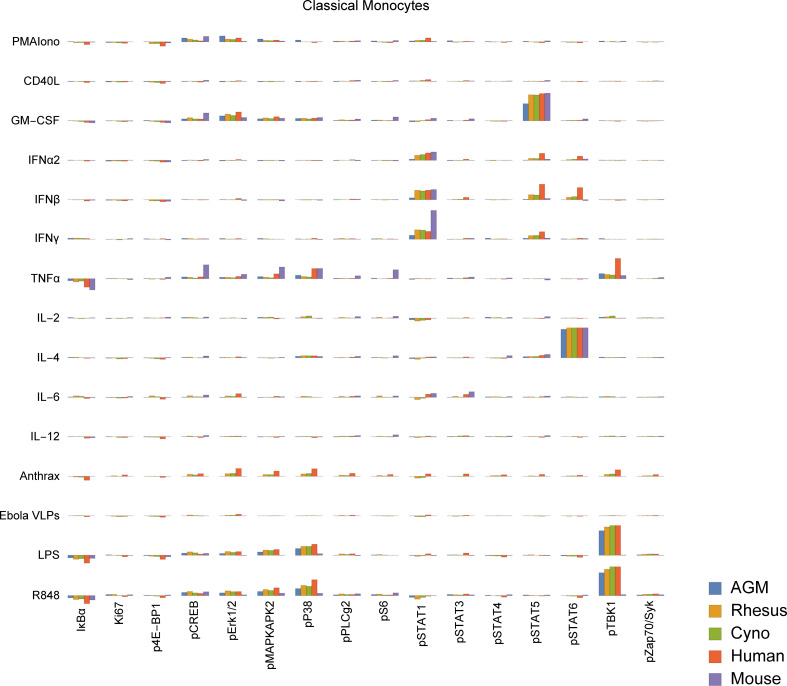
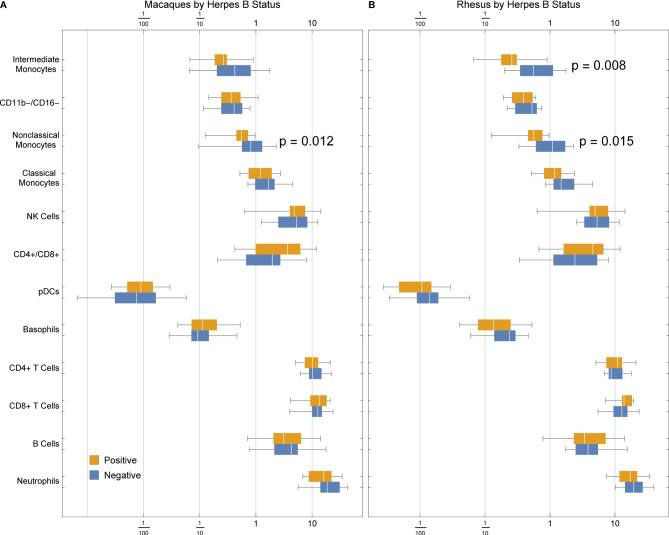
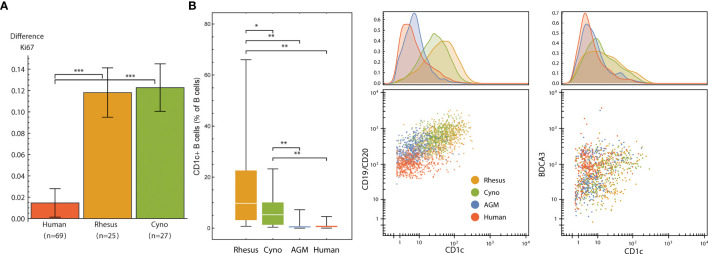
Animal models are an integral part of the drug development and evaluation process. However, they are unsurprisingly imperfect reflections of humans, and the extent and nature of many immunological differences are unknown. With the rise of targeted and biological therapeutics, it is increasingly important that we understand the molecular differences in the immunological behavior of humans and model organisms. However, very few antibodies are raised against non-human primate antigens, and databases of cross-reactivity between species are incomplete. Thus, we screened 332 antibodies in five immune cell populations in blood from humans and four non-human primate species generating a comprehensive cross-reactivity catalog that includes cell type-specificity. We used this catalog to create large mass cytometry universal cross-species phenotyping and signaling panels for humans, along with three of the model organisms most similar to humans: rhesus and cynomolgus macaques and African green monkeys; and one of the mammalian models most widely used in drug development: C57BL/6 mice. As a proof-of-principle, we measured immune cell signaling responses across all five species to an array of 15 stimuli using mass cytometry. We found numerous instances of different cellular phenotypes and immune signaling events occurring within and between species, and detailed three examples (double-positive T cell frequency and signaling; granulocyte response to Bacillus anthracis antigen; and B cell subsets). We also explore the correlation of herpes simian B virus serostatus on the immune profile. Antibody panels and the full dataset generated are available online as a resource to enable future studies comparing immune responses across species during the evaluation of therapeutics.

Keywords: African green monkey (AGM) (Chlorocebus aethiops); CyTOF mass cytometry; cynomolgus monkey (Macaca fascicularis); mouse, immune cell signaling; rhesus macaque (Macaca mulatta).


Conflict of interest statement

Author KL was employed by BioLegend Inc. The remaining authors declare that the research was conducted in the absence of any commercial or financial relationships that could be construed as a potential conflict of interest.

Figures

Figure 1
Figure 1
Study schematic. (A) 332 antibody clones were tested on five different species by flow cytometry to identify cross-reactive clones. (B) Whole blood samples from five different species and subjected to 15 different stimuli were profiled with a universal mass cytometry antibody panel capable of identifying 12 different cell types.
Figure 2
Figure 2
Frequencies (percent of total) of gated cell types by species. Center line: median; Box: 25th to 75th quantile; Whiskers: 1.5x interquartile range. Statistics: ANOVA with Bonferroni post-test was calculated for each population. Asterisks indicate species that are significantly different from humans *p < 5x10⁻², **p < 1x10⁻², ***p < 1x10⁻³ after Bonferroni correction.
Figure 3
Figure 3
Clustering of species by their cell type frequencies recapitulates the evolutionary tree. The average frequencies of 10 cell types (Neutrophils, Basophils, B Cells, CD8+ T Cells, CD4+ T Cells, CD4+/CD8+ T Cells, pDCs, NK Cells, Classical Monocytes and Nonclassical Monocytes) in each species was calculated and then clustered according to their pairwise correlations between species (right). This major clustering order was preserved in the larger heatmap (left), in which each individual donor is displayed and clustered by their individual cell type frequencies. Metric: PearsonCorrelation[freqs_species_1, freqs_species_2]2; distance function: Euclidean; linkage: average.
Figure 4
Figure 4
Distribution of surface marker expression for each species in neutrophils. (See Figure S3 for other populations). Different markers are grouped together if they were on the same channel and stain similar cell types between species (e.g. CD235a/CD233/Ter119 are all on In113 and stain erythrocytes), and are labeled as “[all species]”, “[primates]/[mice]”, or “[humans]/[non-human-primates]/[mice]”.
Figure 5
Figure 5
Signaling responses (difference of ArcSinh-transformed values; approximately equivalent to fold-change) in classical monocytes by stimulus, activation marker and species (other cell types in Figure S4 ). Note that Bacillus anthracis (“anthrax”) and Ebola VLPs were not available for use as stimuli in mice or AGMs; thus, values for these species are always displayed as zero. We could not gate intermediate monocytes or a “CD11b−/CD16−”-equivalent population in mice; these values are also zero. The Y axis range of all charts is -0.5 to +1.5.
Figure 6
Figure 6
Frequencies of cell types in (A) rhesus and cynomolgus macaques or (B) rhesus macaques only, by herpes B virus status. P values were calculated between serostatus groups using a one-tailed Mann-Whitney U test.
Figure 7
Figure 7
(A) Neutrophil Ki67 induction (mean and standard error of differences of ArcSinh-transformed values) by species after exposure to 22M CFU of gamma-irradiated Bacillus anthracis for 15 minutes. (B) CD1c+ B cells are more abundant in non-human primates than in humans, and CD1c is furthermore expressed at higher levels in NHP B cells, especially in macaques. Left: Abundance of CD1c+ B cells (expressed as % of total B cells) in each species. Middle and right: One representative individual from each species. Dot plots show 500 randomly selected B cells (middle) or 250 randomly selected CD11b-/CD16- DCs (right). Statistics (A, B): Groups were compared using a one-tailed Mann-Whitney U test with asterisks indicating significant differences (*p < 5x10⁻², **p < 1x10⁻², ***p < 1x10⁻³).

References

    1. FDA . US Food and Drug Administration: Animal Rule Information. Available at: https://www.fda.gov/emergency-preparedness-and-response/mcm-regulatory-s... (Accessed December 15, 2021).
    1. Davis MM. A Prescription for Human Immunology . Immunity (2008) 29:835–8. doi: 10.1016/j.immuni.2008.12.003 - DOI - PMC - PubMed
    1. Bente D, Gren J, Strong JE, Feldmann H. Disease Modeling for Ebola and Marburg Viruses. Dis Model Mech (2009) 2:12–7. doi: 10.1242/dmm.000471 - DOI - PMC - PubMed
    1. Richmond A, Su Y. Mouse Xenograft Models vs GEM Models for Human Cancer Therapeutics. Dis Model Mech (2008) 1:78–82. doi: 10.1242/dmm.000976 - DOI - PMC - PubMed
    1. Rogers KA, Scinicariello F, Attanasio R. IgG Fc Receptor III Homologues in Nonhuman Primate Species: Genetic Characterization and Ligand Interactions. J Immunol (2006) 177:3848–56. doi: 10.4049/jimmunol.177.6.3848 - DOI - PubMed

Publication types