

Increased Expression of Viral Sensor MDA5 in Pancreatic Islets and in Hormone-Negative Endocrine Cells in Recent Onset Type 1 Diabetic Donors
- PMID: 35359976
- PMCID: PMC8963204
- DOI: 10.3389/fimmu.2022.833141
Increased Expression of Viral Sensor MDA5 in Pancreatic Islets and in Hormone-Negative Endocrine Cells in Recent Onset Type 1 Diabetic Donors
Abstract
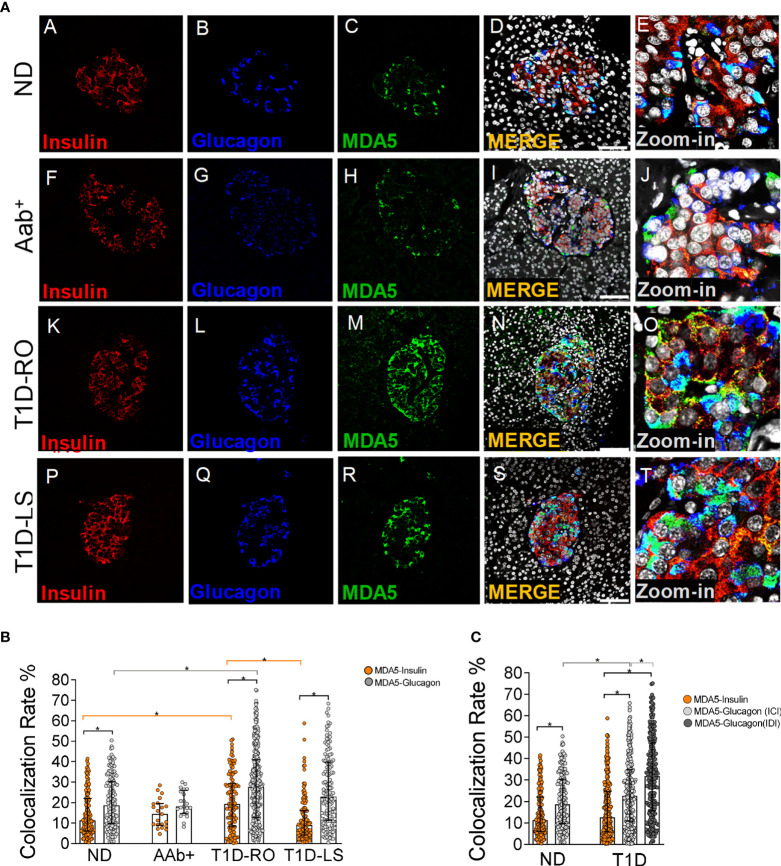
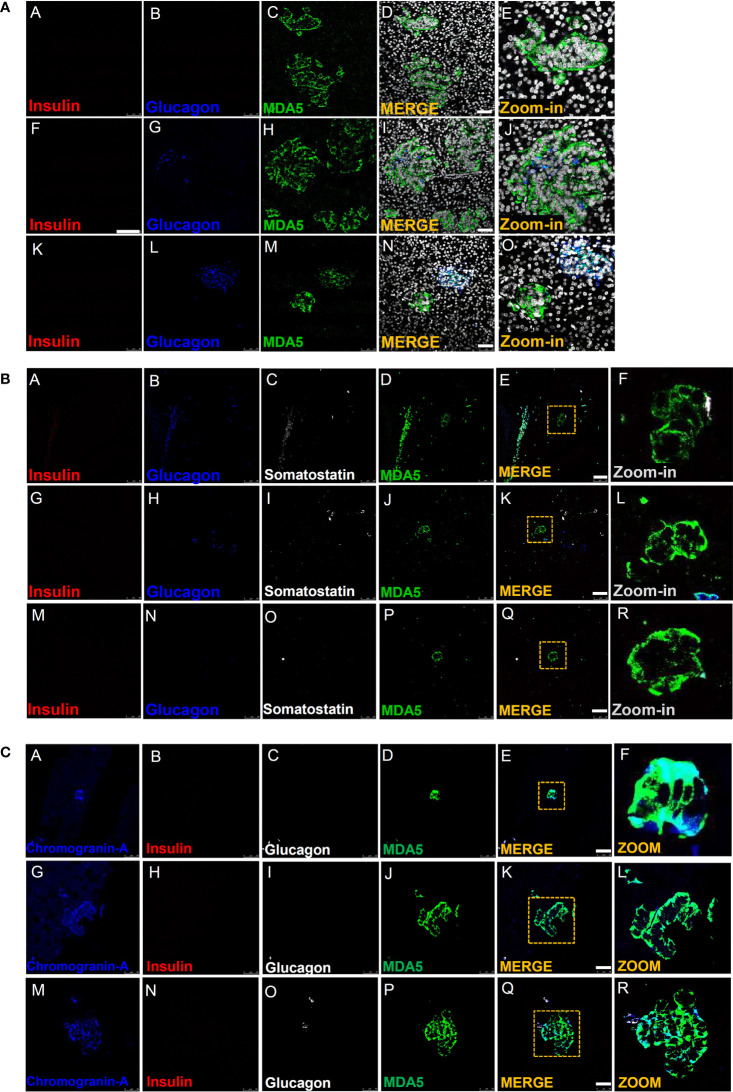
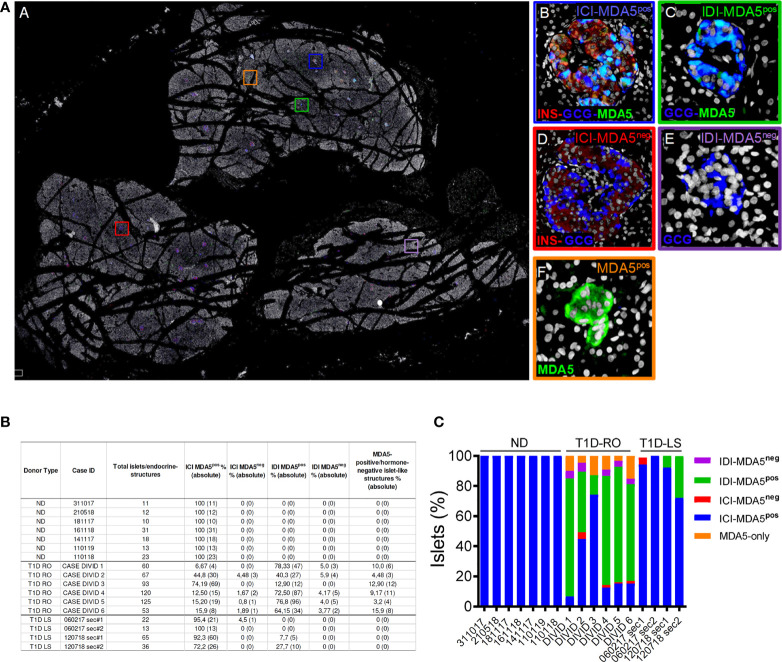
The interaction between genetic and environmental factors determines the development of type 1 diabetes (T1D). Some viruses are capable of infecting and damaging pancreatic β-cells, whose antiviral response could be modulated by specific viral RNA receptors and sensors such as melanoma differentiation associated gene 5 (MDA5), encoded by the IFIH1 gene. MDA5 has been shown to be involved in pro-inflammatory and immunoregulatory outcomes, thus determining the response of pancreatic islets to viral infections. Although the function of MDA5 has been previously well explored, a detailed immunohistochemical characterization of MDA5 in pancreatic tissues of nondiabetic and T1D donors is still missing. In the present study, we used multiplex immunofluorescence imaging analysis to characterize MDA5 expression and distribution in pancreatic tissues obtained from 22 organ donors (10 nondiabetic autoantibody-negative, 2 nondiabetic autoantibody-positive, 8 recent-onset, and 2 long-standing T1D). In nondiabetic control donors, MDA5 was expressed both in α- and β-cells. The colocalization rate imaging analysis showed that MDA5 was preferentially expressed in α-cells. In T1D donors, we observed an increased colocalization rate of MDA5-glucagon with respect to MDA5-insulin in comparison to nondiabetic controls; such increase was more pronounced in recent-onset with respect to long-standing T1D donors. Of note, an increased colocalization rate of MDA5-glucagon was found in insulin-deficient-islets (IDIs) with respect to insulin-containing-islets (ICIs). Strikingly, we detected the presence of MDA5-positive/hormone-negative endocrine islet-like clusters in T1D donors, presumably due to dedifferentiation or neogenesis phenomena. These clusters were identified exclusively in donors with recent disease onset and not in autoantibody-positive nondiabetic donors or donors with long-standing T1D. In conclusion, we showed that MDA5 is preferentially expressed in α-cells, and its expression is increased in recent-onset T1D donors. Finally, we observed that MDA5 may also characterize the phenotype of dedifferentiated or newly forming islet cells, thus opening to novel roles for MDA5 in pancreatic endocrine cells.
Keywords: MDA5; dedifferentiation; enteroviruses; innate immunity; pancreas; pancreatic islet; type 1 diabetes; viral sensor.
Copyright © 2022 Nigi, Brusco, Grieco, Fignani, Licata, Formichi, Aiello, Marselli, Marchetti, Krogvold, Jorgensen, Sebastiani and Dotta.
Conflict of interest statement
The authors declare that the research was conducted in the absence of any commercial or financial relationships that could be construed as a potential conflict of interest.
Figures
Similar articles
-
Pancreatic Alpha-Cells Contribute Together With Beta-Cells to CXCL10 Expression in Type 1 Diabetes.Front Endocrinol (Lausanne). 2020 Sep 15;11:630. doi: 10.3389/fendo.2020.00630. eCollection 2020. Front Endocrinol (Lausanne). 2020. PMID: 33042009 Free PMC article.
-
Distribution of IL-1β immunoreactive cells in pancreatic biopsies from living volunteers with new-onset type 1 diabetes: comparison with donors without diabetes and with longer duration of disease.Diabetologia. 2018 Jun;61(6):1362-1373. doi: 10.1007/s00125-018-4600-8. Epub 2018 Mar 27. Diabetologia. 2018. PMID: 29589071
-
Loss of insulin-expressing extra-islet cells in type 1 diabetes is accompanied with increased number of glucagon-expressing extra-islet cells.Virchows Arch. 2025 Apr;486(4):687-695. doi: 10.1007/s00428-024-03842-4. Epub 2024 Jun 26. Virchows Arch. 2025. PMID: 38922355 Free PMC article.
-
Innate Viral Sensor MDA5 and Coxsackievirus Interplay in Type 1 Diabetes Development.Microorganisms. 2020 Jul 3;8(7):993. doi: 10.3390/microorganisms8070993. Microorganisms. 2020. PMID: 32635205 Free PMC article. Review.
-
Importance of multiple endocrine cell types in islet organoids for type 1 diabetes treatment.Transl Res. 2022 Dec;250:68-83. doi: 10.1016/j.trsl.2022.06.014. Epub 2022 Jun 28. Transl Res. 2022. PMID: 35772687 Free PMC article. Review.
Cited by
-
Detection of Antiviral Tissue Responses and Increased Cell Stress in the Pancreatic Islets of Newly Diagnosed Type 1 Diabetes Patients: Results From the DiViD Study.Front Endocrinol (Lausanne). 2022 Jul 26;13:881997. doi: 10.3389/fendo.2022.881997. eCollection 2022. Front Endocrinol (Lausanne). 2022. PMID: 35957810 Free PMC article.
-
RNA editing deficiency models differential immunogenicity of pancreatic α- and β-cells.Mol Metab. 2025 Aug;98:102183. doi: 10.1016/j.molmet.2025.102183. Epub 2025 Jun 9. Mol Metab. 2025. PMID: 40499651 Free PMC article.
-
The IFIH1-A946T risk variant promotes diabetes in a sex-dependent manner.Front Immunol. 2024 Feb 29;15:1349601. doi: 10.3389/fimmu.2024.1349601. eCollection 2024. Front Immunol. 2024. PMID: 38487540 Free PMC article.
-
Viruses as a potential environmental trigger of type 1 diabetes mellitus (Review).Biomed Rep. 2024 Mar 26;20(5):81. doi: 10.3892/br.2024.1770. eCollection 2024 May. Biomed Rep. 2024. PMID: 38628629 Free PMC article. Review.
-
Why does the immune system destroy pancreatic β-cells but not α-cells in type 1 diabetes?Nat Rev Endocrinol. 2023 Jul;19(7):425-434. doi: 10.1038/s41574-023-00826-3. Epub 2023 Apr 18. Nat Rev Endocrinol. 2023. PMID: 37072614 Review.
References
Publication types
MeSH terms
Substances
LinkOut - more resources
Full Text Sources
Medical