

Acute and Short-Term Autonomic and Hemodynamic Responses to Transcranial Direct Current Stimulation in Patients With Resistant Hypertension
- PMID: 35360028
- PMCID: PMC8962672
- DOI: 10.3389/fcvm.2022.853427
Acute and Short-Term Autonomic and Hemodynamic Responses to Transcranial Direct Current Stimulation in Patients With Resistant Hypertension
Abstract
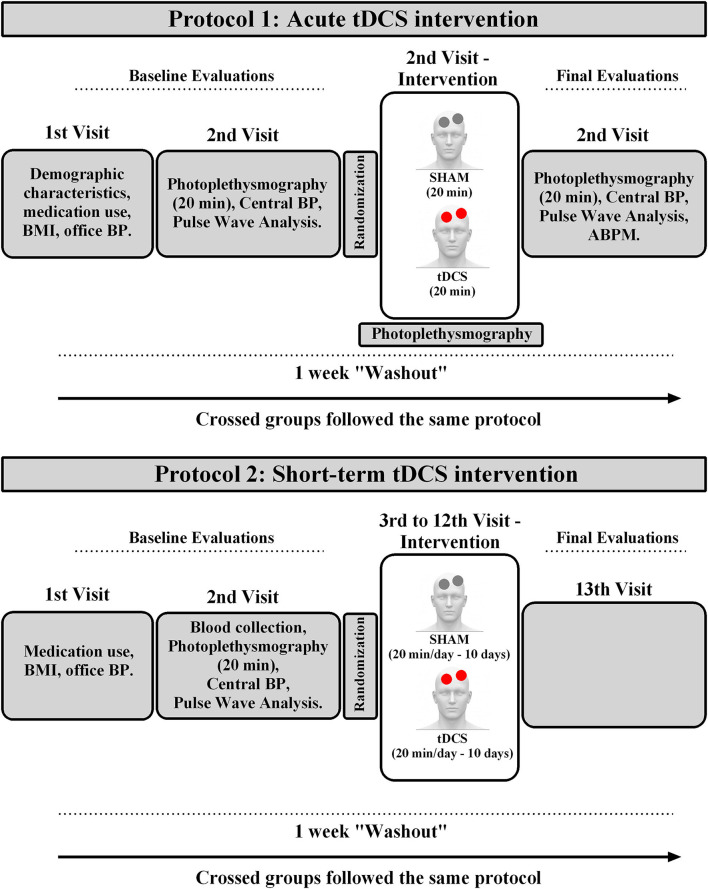
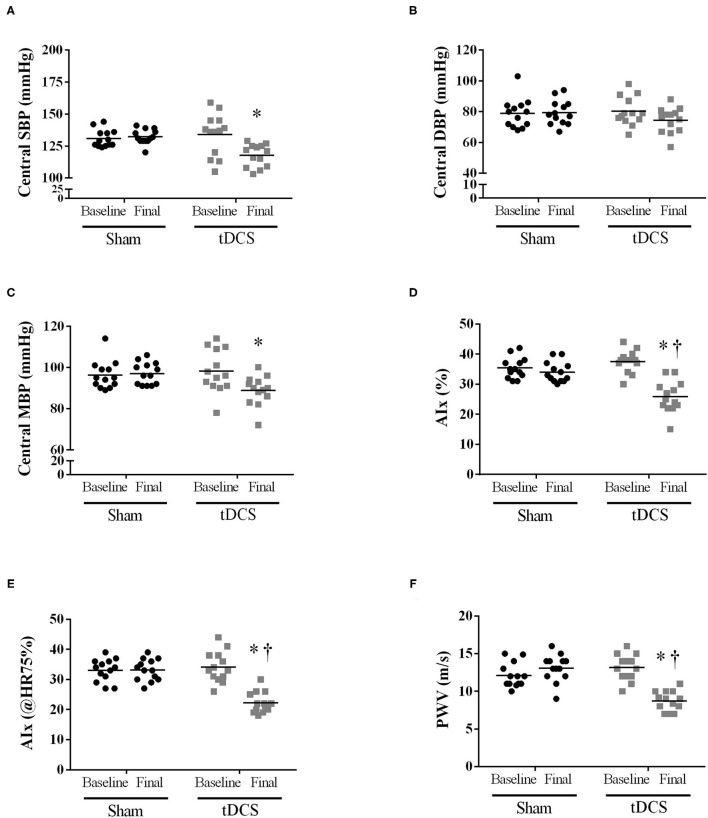
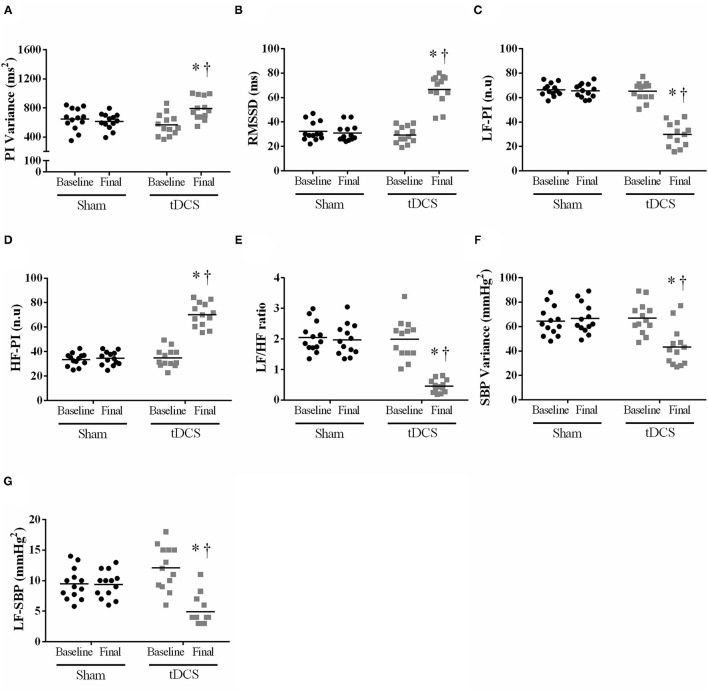
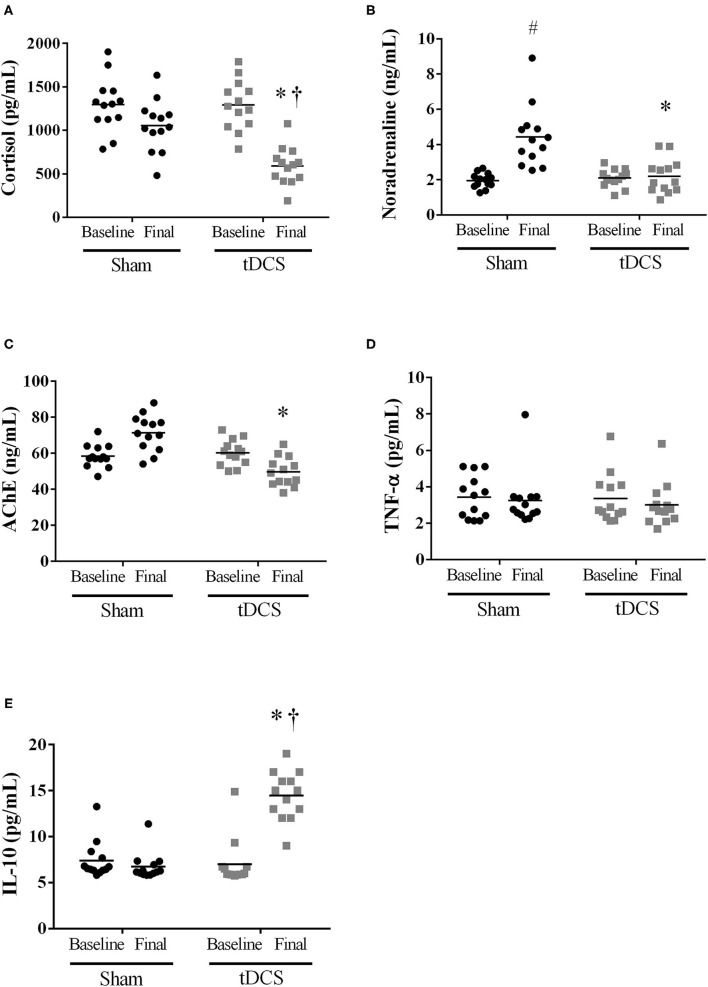
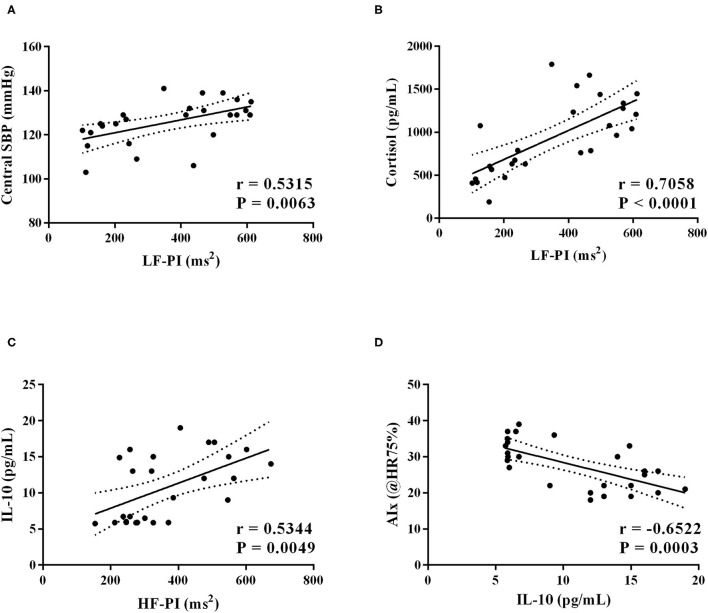
Previously, we demonstrated that acute transcranial direct current stimulation (tDCS) reduced blood pressure (BP) and improved autonomic modulation in hypertensives. We hypothesized that acute and short-term tDCS intervention can promote similar benefits in resistant hypertensive patients (RHT). We assessed the impact of one (acute intervention) and ten (short-term intervention) tDCS or SHAM (20 min, each) sessions on BP, pulse interval (PI) and systolic blood pressure variabilities, humoral mechanisms associated with BP regulation, and cytokines levels. True RHT subjects (n = 13) were randomly submitted to one and ten SHAM and tDCS crossing sessions (1 week of "washout"). Hemodynamic (Finometer®, Beatscope), office BP, and autonomic variables (accessed through spectral analysis of the pulse-to-pulse BP signal, in the time and frequency domain - Fast Fourrier Transform) were measured at baseline and after the short-term intervention. 24 h-ambulatory BP monitoring was measured after acute and short-term protocols. Acute intervention: tDCS reduced BP, cardiac output, and increase high-frequency band of PI (vagal modulation to the heart). Short-term protocol: tDCS did not change BP and cardiac output parameters. In contrast, central systolic BP (-12%), augmentation index (-31%), and pulse wave velocity (34%) were decreased by the short-term tDCS when compared to SHAM. These positive results were accompanied by a reduction in the low-frequency band (-37%) and an increase of the high-frequency band of PI (+62%) compared to SHAM. These findings collectively indicate that short-term tDCS concomitantly improves resting cardiac autonomic control and pulse wave behavior and reduces central BP in RHT patients, https://ensaiosclinicos.gov.br/rg/RBR-8n7c9p.
Keywords: autonomic nervous system; biochemical analyses; blood pressure; resistant hypertension; transcranial direct current stimulation (tDCS).
Copyright © 2022 Rodrigues, Barboza, Moura, Ministro, Ferreira-Melo, Castaño, Nunes, Mostarda, Coca, Vianna and Moreno-Junior.
Conflict of interest statement
The authors declare that the research was conducted in the absence of any commercial or financial relationships that could be construed as a potential conflict of interest.
Figures
Similar articles
-
ACUTE TRANSCRANIAL DIRECT CURRENT STIMULATION (tDCS) IMPROVES VENTILATORY VARIABILITY AND AUTONOMIC MODULATION IN RESISTANT HYPERTENSIVE PATIENTS.Respir Physiol Neurobiol. 2022 Mar;297:103830. doi: 10.1016/j.resp.2021.103830. Epub 2021 Dec 13. Respir Physiol Neurobiol. 2022. PMID: 34915178
-
Transcranial direct current stimulation modulates autonomic nervous system and reduces ambulatory blood pressure in hypertensives.Clin Exp Hypertens. 2021 May 19;43(4):320-327. doi: 10.1080/10641963.2021.1871916. Epub 2021 Jan 11. Clin Exp Hypertens. 2021. PMID: 33423544 Clinical Trial.
-
Effects of transcranial direct current stimulation associated with an aerobic exercise bout on blood pressure and autonomic modulation of hypertensive patients: A pilot randomized clinical trial.Auton Neurosci. 2021 Nov;235:102866. doi: 10.1016/j.autneu.2021.102866. Epub 2021 Aug 6. Auton Neurosci. 2021. PMID: 34380099 Clinical Trial.
-
Cardiovascular Autonomic Responses to Aerobic, Resistance and Combined Exercises in Resistance Hypertensive Patients.Biomed Res Int. 2022 Apr 20;2022:8202610. doi: 10.1155/2022/8202610. eCollection 2022. Biomed Res Int. 2022. PMID: 35496038 Free PMC article. Clinical Trial.
-
Transcranial direct current stimulation on hypertension: a systematic review and meta-analysis.Acta Cardiol. 2024 Sep 17:1-10. doi: 10.1080/00015385.2024.2403925. Online ahead of print. Acta Cardiol. 2024. PMID: 39286998 Review.
Cited by
-
Transcranial Direct Current Stimulation in the Management of Hypertension: A Plausible Hypothesis?Arq Bras Cardiol. 2023 Oct 9;120(9):e20230100. doi: 10.36660/abc.20230100. eCollection 2023. Arq Bras Cardiol. 2023. PMID: 37820174 Free PMC article. English, Portuguese. No abstract available.
-
When blood pressure refuses to budge: exploring the complexity of resistant hypertension.Front Cardiovasc Med. 2023 Jun 21;10:1211199. doi: 10.3389/fcvm.2023.1211199. eCollection 2023. Front Cardiovasc Med. 2023. PMID: 37416924 Free PMC article. Review.
-
Modal Analysis of Cerebrovascular Effects for Digital Health Integration of Neurostimulation Therapies-A Review of Technology Concepts.Brain Sci. 2024 Jun 10;14(6):591. doi: 10.3390/brainsci14060591. Brain Sci. 2024. PMID: 38928591 Free PMC article.
-
The Effect of Transcutaneous Electrical Nerve Stimulation in Peripheral and Central Hemodynamic Parameters on Resistant Hypertension: A Case Report.Vasc Health Risk Manag. 2023 May 16;19:317-323. doi: 10.2147/VHRM.S408082. eCollection 2023. Vasc Health Risk Manag. 2023. PMID: 37215282 Free PMC article.
-
Brain‑heart axis: Neurostimulation techniques in ischemic heart disease (Review).Int J Mol Med. 2025 Oct;56(4):148. doi: 10.3892/ijmm.2025.5589. Epub 2025 Jul 19. Int J Mol Med. 2025. PMID: 40682847 Free PMC article. Review.
References
-
- Calhoun DA, Jones D, Textor S, Goff DC, Murphy TP, Toto RD, et al. . American Heart Association Professional Education Committee. Resistant hypertension: diagnosis, evaluation, and treatment: a scientific statement from the American Heart Association Professional Education Committee of the Council for High Blood Pressure Research. Circulation. (2008) 117:e510–26. 10.1161/CIRCULATIONAHA.108.189141 - DOI - PubMed
-
- Carey RM, Calhoun DA, Bakris GL, Brook RD, Daugherty SL, Dennison-Himmelfarb CR, et al. . American Heart Association Professional/Public Education and Publications Committee of the Council on Hypertension; Council on Cardiovascular and Stroke Nursing; Council on Clinical Cardiology; Council on Genomic and Precision Medicine; Council on Peripheral Vascular Disease; Council on Quality of Care and Outcomes Research; and Stroke Council. Resistant Hypertension: Detection, Evaluation, and Management: A Scientific Statement From the American Heart Association. Hypertension. (2018) 72:e53–90. 10.1161/HYP.0000000000000084 - DOI - PMC - PubMed
LinkOut - more resources
Full Text Sources
Research Materials
Miscellaneous