

Sonification of Complex Spectral Structures
- PMID: 35360157
- PMCID: PMC8960303
- DOI: 10.3389/fnins.2022.832265
Sonification of Complex Spectral Structures
Abstract
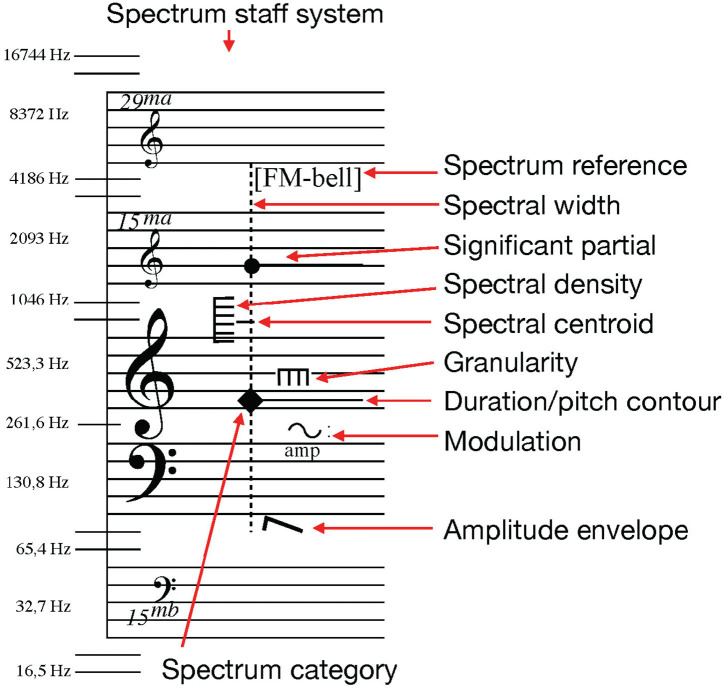
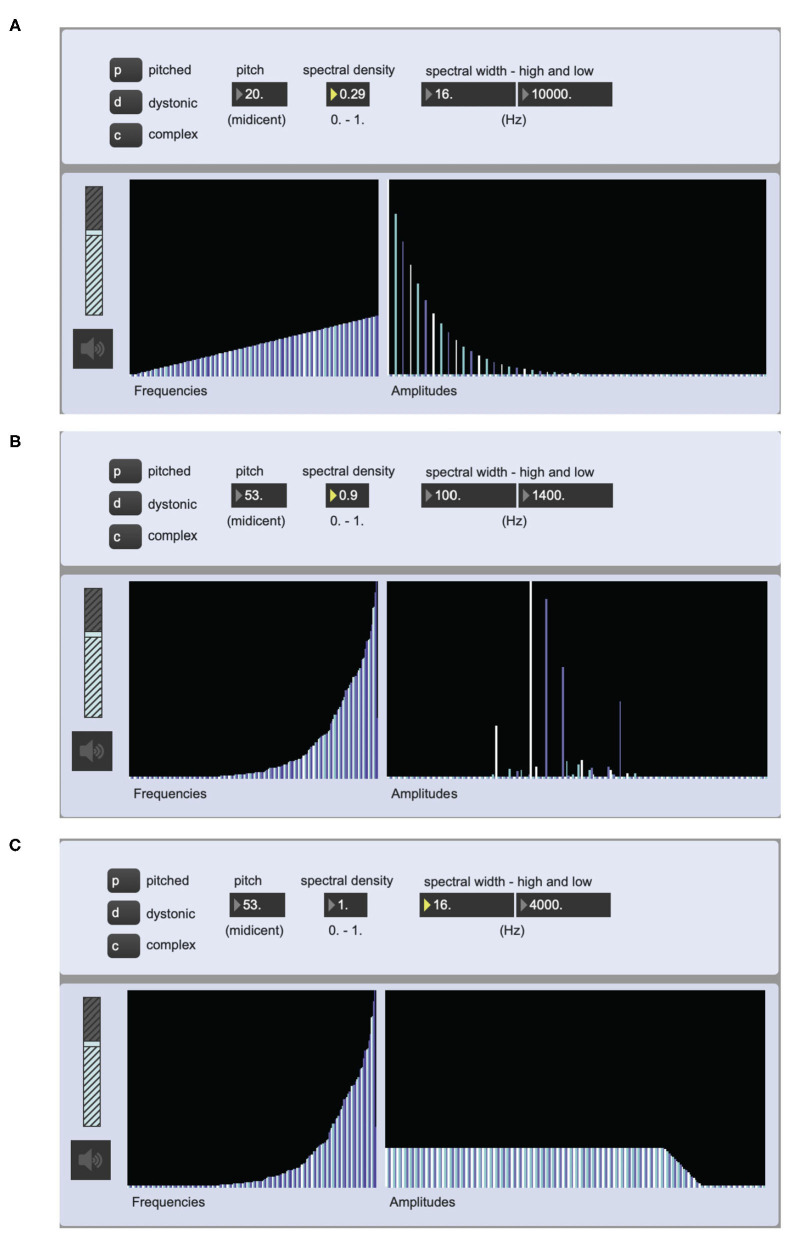
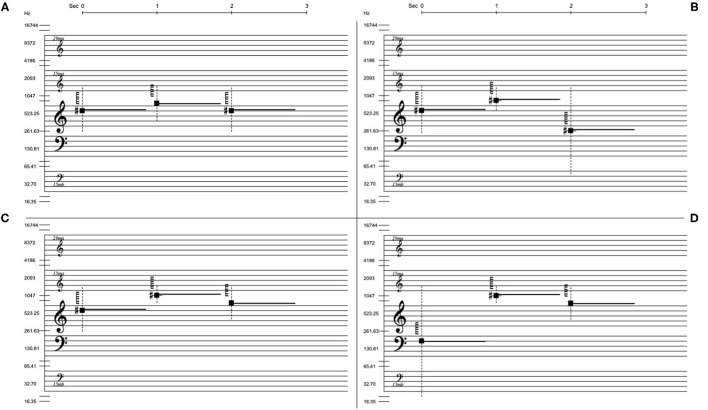
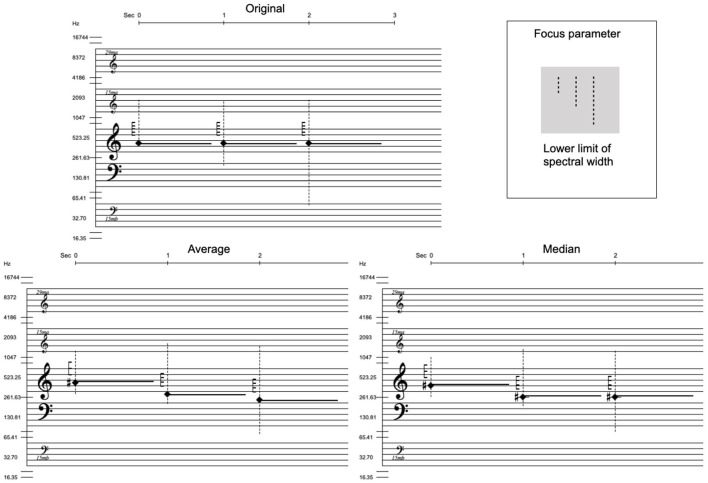
In this article, we present our work on the sonification of notated complex spectral structures. It is part of a larger research project about the design of a new notation system for representing sound-based musical structures. Complex spectral structures are notated with special symbols in the scores, which can be digitally rendered so that the user can hear key aspects of what has been notated. This hearing of the notated data is significantly different from reading the same data, and reveals the complexity hidden in its simplified notation. The digitally played score is not the music itself but can provide essential information about the music in ways that can only be obtained in sounding form. The playback needs to be designed so that the user can make relevant sonic readings of the sonified data. The sound notation system used here is an adaptation of Thoresen and Hedman's spectromorphological analysis notation. Symbols originally developed by Lasse Thoresen from Pierre Schaeffer's typo-morphology have in this system been adapted to display measurable spectral features of timbrel structure for the composition and transcription of sound-based musical structures. Spectrum category symbols are placed over a spectral grand-staff that combines indications of pitch and frequency values for the combined display of music related to pitch-based and spectral values. Spectral features of a musical structure such as spectral width and density are represented as graphical symbols and sonically rendered. In perceptual experiments we have verified that users can identify spectral notation parameters based on their sonification. This confirms the main principle of sonification that is that the data/dimensions relations in one domain, in our case notated representation of spectral features, are transformed in perceived relations in the audio domain, and back.
Keywords: complex spectral structure; comprehension; listening; music; perception; sonification; spectrum.
Copyright © 2022 Sköld and Bresin.
Conflict of interest statement
The authors declare that the research was conducted in the absence of any commercial or financial relationships that could be construed as a potential conflict of interest.
Figures


References
-
- Adhitya S., Kuuskankare M. (2012). Composing graphic scores and sonifying visual music with the SUM tool, in Proceedings of the 9th Sound and Music Computing Conference (SMC 2012) (Copenhagen: ), 171–176.
-
- Ballora M. (2014). Sonification, science and popular music: in search of the 'wow'. Organised Sound 19, 30–40. 10.1017/S1355771813000381 - DOI
-
- Battier M. (2015). Describe, transcribe, notate: prospects and problems facing electroacoustic music. Organised Sound 20, 60–67. 10.1017/S1355771814000430 - DOI
-
- Belkin A. (1993). Composer's mosaic and performer version 4 for apple macintosh computers. Comput. Music J. 17, 84–87.
-
- Caramiaux B., Bevilacqua F., Bianco T., Schnell N., Houix O., Susini P. (2014). The role of sound source perception in gestural sound description. ACM Trans. Appl. Percept. 11, 1–19. 10.1145/2536811 - DOI
LinkOut - more resources
Full Text Sources