Uncovering Cortical Units of Processing From Multi-Layered Connectomes
- PMID: 35360166
- PMCID: PMC8960198
- DOI: 10.3389/fnins.2022.836259
Uncovering Cortical Units of Processing From Multi-Layered Connectomes
Abstract
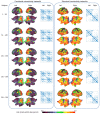
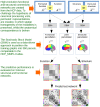
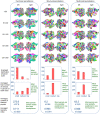
Modern diffusion and functional magnetic resonance imaging (dMRI/fMRI) provide non-invasive high-resolution images from which multi-layered networks of whole-brain structural and functional connectivity can be derived. Unfortunately, the lack of observed correspondence between the connectivity profiles of the two modalities challenges the understanding of the relationship between the functional and structural connectome. Rather than focusing on correspondence at the level of connections we presently investigate correspondence in terms of modular organization according to shared canonical processing units. We use a stochastic block-model (SBM) as a data-driven approach for clustering high-resolution multi-layer whole-brain connectivity networks and use prediction to quantify the extent to which a given clustering accounts for the connectome within a modality. The employed SBM assumes a single underlying parcellation exists across modalities whilst permitting each modality to possess an independent connectivity structure between parcels thereby imposing concurrent functional and structural units but different structural and functional connectivity profiles. We contrast the joint processing units to their modality specific counterparts and find that even though data-driven structural and functional parcellations exhibit substantial differences, attributed to modality specific biases, the joint model is able to achieve a consensus representation that well accounts for both the functional and structural connectome providing improved representations of functional connectivity compared to using functional data alone. This implies that a representation persists in the consensus model that is shared by the individual modalities. We find additional support for this viewpoint when the anatomical correspondence between modalities is removed from the joint modeling. The resultant drop in predictive performance is in general substantial, confirming that the anatomical correspondence of processing units is indeed present between the two modalities. Our findings illustrate how multi-modal integration admits consensus representations well-characterizing each individual modality despite their biases and points to the importance of multi-layered connectomes as providing supplementary information regarding the brain's canonical processing units.
Keywords: brain parcellation; dMRI; fMRI; multi-layered connectomes; stochastic block model.
Copyright © 2022 Albers, Liptrot, Ambrosen, Røge, Herlau, Andersen, Siebner, Hansen, Dyrby, Madsen, Schmidt and Mørup.
Conflict of interest statement
HS has received honoraria as speaker from Sanofi Genzyme, Denmark, and Novartis, Denmark, as consultant from Sanofi Genzyme, Denmark, Lophora, Denmark, and Lundbeck AS, Denmark, and as editor-in-chief (Neuroimage Clinical) and senior editor (NeuroImage) from Elsevier Publishers, Amsterdam, The Netherlands. He has received royalties as book editor from Springer Publishers, Stuttgart, Germany and from Gyldendal Publishers, Copenhagen, Denmark. The remaining authors declare that the research was conducted in the absence of any commercial or financial relationships that could be construed as a potential conflict of interest.
Figures


Similar articles
-
Discovering prominent differences in structural and functional connectomes using a multinomial stochastic block model.Netw Neurosci. 2024 Dec 10;8(4):1243-1264. doi: 10.1162/netn_a_00399. eCollection 2024. Netw Neurosci. 2024. PMID: 39735501 Free PMC article.
-
Using connectomics for predictive assessment of brain parcellations.Neuroimage. 2021 Sep;238:118170. doi: 10.1016/j.neuroimage.2021.118170. Epub 2021 Jun 1. Neuroimage. 2021. PMID: 34087365
-
A cross-modal, cross-species comparison of connectivity measures in the primate brain.Neuroimage. 2016 Jan 15;125:311-331. doi: 10.1016/j.neuroimage.2015.10.057. Epub 2015 Oct 26. Neuroimage. 2016. PMID: 26515902
-
Connectomes: from a sparsity of networks to large-scale databases.Front Neuroinform. 2023 Jun 12;17:1170337. doi: 10.3389/fninf.2023.1170337. eCollection 2023. Front Neuroinform. 2023. PMID: 37377946 Free PMC article. Review.
-
Brain connectomes come of age.Curr Opin Neurobiol. 2020 Dec;65:152-161. doi: 10.1016/j.conb.2020.11.002. Epub 2020 Dec 1. Curr Opin Neurobiol. 2020. PMID: 33276230 Free PMC article. Review.
Cited by
-
Discovering prominent differences in structural and functional connectomes using a multinomial stochastic block model.Netw Neurosci. 2024 Dec 10;8(4):1243-1264. doi: 10.1162/netn_a_00399. eCollection 2024. Netw Neurosci. 2024. PMID: 39735501 Free PMC article.
References
-
- Albers K. J., Moth A. L. A., Mørup M., Schmidt M. N. (2013). Large scale inference in the infinite relational model: gibbs sampling is not enough, in 2013 IEEE International Workshop on Machine Learning for Signal Processing (MLSP), 1–6. 10.1109/MLSP.2013.6661904 - DOI
-
- Ambrosen K. S., Albers K. J., Dyrby T. B., Schmidt M. N., Morup M. (2014). Nonparametric bayesian clustering of structural whole brain connectivity in full image resolution, in 2014 International Workshop on Pattern Recognition in Neuroimaging, 1–4. 10.1109/PRNI.2014.6858507 - DOI
Grants and funding
LinkOut - more resources
Full Text Sources

