. 2022 Mar 10:16:827570.
doi: 10.3389/fnins.2022.827570. eCollection 2022.

Global MicroRNAs Expression Profile Analysis Reveals Possible Regulatory Mechanisms of Brain Injury Induced by Toxoplasma gondii Infection

Affiliations

Global MicroRNAs Expression Profile Analysis Reveals Possible Regulatory Mechanisms of Brain Injury Induced by Toxoplasma gondii Infection

Zhaofeng Hou et al. Front Neurosci. .

Abstract

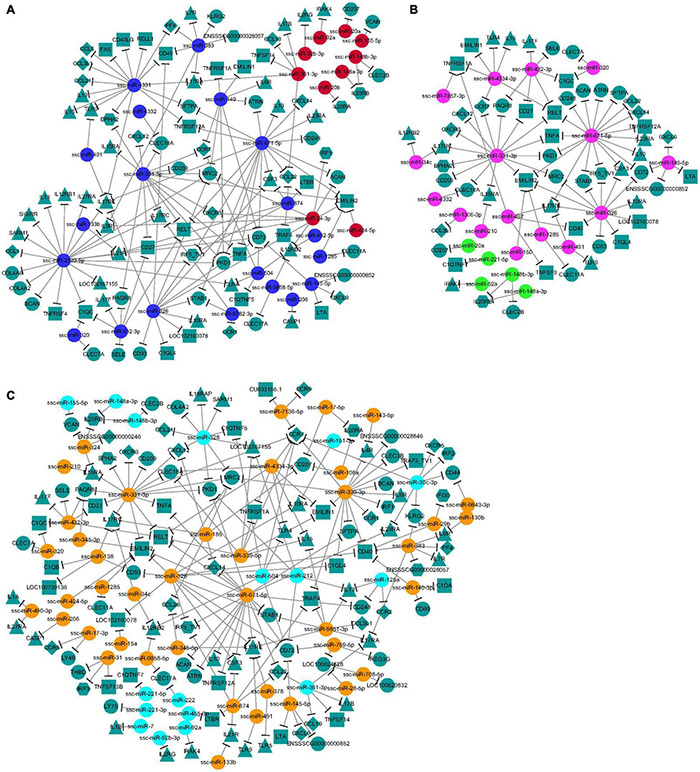
Toxoplasma gondii (T. gondii) is an obligate intracellular parasitic protozoan that can cause toxoplasmosis in humans and other endotherms. T. gondii can manipulate the host gene expression profile by interfering with miRNA expression, which is closely associated with the molecular mechanisms of T. gondii-induced brain injury. However, it is unclear how T. gondii manipulates the gene expression of central nervous system (CNS) cells through modulation of miRNA expression in vivo during acute and chronic infection. Therefore, high-throughput sequencing was used to investigate expression profiles of brain miRNAs at 10, 25, and 50 days post-infection (DPI) in pigs infected with the Chinese I genotype T. gondii strain in this study. Compared with the control group 87, 68, and 135 differentially expressed miRNAs (DEMs) were identified in the infected porcine brains at 10, 25, and 50 DPI, respectively. Gene Ontology (GO) and Kyoto Encyclopedia of Genes and Genomes (KEGG) pathway enrichment analysis showed that a large number significantly enriched GO terms and KEGG pathways were found, and were mostly associated with stimulus or immune response, signal transduction, cell death or apoptosis, metabolic processes, immune system or diseases, and cancers. miRNA-gene network analysis revealed that the crucial connecting nodes, including DEMs and their target genes, might have key roles in the interactions between porcine brain and T. gondii. These results suggest that the regulatory strategies of T. gondii are involved in the modulation of a variety of host cell signaling pathways and cellular processes, containing unfolded protein response (UPR), oxidative stress (OS), autophagy, apoptosis, tumorigenesis, and inflammatory responses, by interfering with the global miRNA expression profile of CNS cells, allowing parasites to persist in the host CNS cells and contribute to pathological damage of porcine brain. To our knowledge, this is the first report on miRNA expression profile in porcine brains during acute and chronic T. gondii infection in vivo. Our results provide new insights into the mechanisms underlying T. gondii-induced brain injury during different infection stages and novel targets for developing therapeutic agents against T. gondii.

Keywords: Toxoplasma gondii; acute and chronic infection; brain injury; microRNA; pig.


Conflict of interest statement

The authors declare that the research was conducted in the absence of any commercial or financial relationships that could be construed as a potential conflict of interest.

Figures

FIGURE 1
FIGURE 1
Histopathological observation of pig brain infected by T. gondii. (A,B) represent histopathology of tissue sections prepared from porcine brain by HE staining. (A) represents the brain prepared from pigs of the control group. (B) represents the brain prepared from pigs in the infected group. (C,D) represents tissue cysts of Toxoplasma in brain tissue homogenate of the infected pigs. (A,B), bar = 200 μm; (C), bar = 20 μm; (D), bar = 10 μm.
FIGURE 2
FIGURE 2
The miRNAs expression distribution and correlation analysis between samples in different groups. (A) TPM boxplot of miRNA expression levels in different samples. (B) Pearson correlation coefficients were calculated to estimate the association of expression levels between samples.
FIGURE 3
FIGURE 3
The differential expression analysis of pig brain miRNAs between the infected and control groups. (A) The number of DEMs between the infected and control groups at 10, 25, and 50 DPI. (BD) The Venn diagrams of the DEMs between the infected and control groups at three time points.
FIGURE 4
FIGURE 4
The GO enrichment analysis for target genes of DEMs. (A) The significant enriched GO terms of biological process, cellular component and molecular function for target genes of DEMs at 10 DPI. (B) The significant enriched GO terms of biological process, cellular component and molecular function for target genes of DEMs at 25 DPI. (C) The significant enriched GO terms of biological process, cellular component and molecular function for target genes of DEMs at 50 DPI.
FIGURE 5
FIGURE 5
The KEGG enrichment analysis for target genes of DEMs. The top 20 KEGG pathways of differentially expressed miRNAs in porcine brain between the infected and control groups at 10 (A), 25 (B), and 50 (C) DPI. Rich factor indicates the ratio of target genes of DEMs enriched in the pathway among genes annotated in the pathway. Adapted from Kanehisa et al. (2017), Young et al. (2010).
FIGURE 6
FIGURE 6
(AC) The network analysis of the interaction between the DEMs and immune-related target genes. The node shapes were used for representing the different miRNAs or target genes (different types of cytokines), which were connected by edges (negative interaction between miRNA to target gene). And the colors of spherical nodes were represented the upregulated or downregulated miRNAs in porcine brain at different time points.
FIGURE 7
FIGURE 7
Sequencing data validated by RT-qPCR. Comparison of the expression pattern of the sequencing data and RT-qPCR data. Log2 (fold change) > 0 indicates the transcript upregulated in infection group compared to the control group. Log2 (fold change) < 0 indicates the transcript downregulated in infection group compared to the control group.

References

    1. Alfonso C., Paola S., Roberto D., Maurizio M., Maria B. G., Gennaro E. (2011). The EMILIN/Multimerin Family. Front. Immunol. 2:93. 10.3389/fimmu.2011.00093 - DOI - PMC - PubMed
    1. Baba T., Fusaki N., Aoyama A., Li D. H., Okamura R. M., Parnes J. R., et al. (2005). Dual regulation of BCR-mediated growth inhibition signaling by CD72. Eur. J. Immunol. 35 1634–1642. 10.1002/eji.200425775 - DOI - PubMed
    1. Barbagallo D., Condorelli A., Ragusa M., Salito L., Sammito M., Banelli B., et al. (2016). Dysregulated miR-671-5p / CDR1-AS / CDR1 / VSNL1 axis is involved in glioblastoma multiforme. Oncotarget 7 4746–4759. 10.18632/oncotarget.6621 - DOI - PMC - PubMed
    1. Besteiro S. (2019). The role of host autophagy machinery in controlling Toxoplasma infection. Virulence 10 438–447. 10.1080/21505594.2018.1518102 - DOI - PMC - PubMed
    1. Blanchard N., Dunay I. R., Schlüter D. (2015). Persistence of Toxoplasma gondii in the central nervous system: a fine-tuned balance between the parasite, the brain and the immune system. Parasite Immunol. 37 150–158. 10.1111/pim.12173 - DOI - PubMed